Pten in stromal fibroblasts suppresses mammary epithelial tumours - PubMed (original) (raw)
. 2009 Oct 22;461(7267):1084-91.
doi: 10.1038/nature08486.
Carmen Z Cantemir-Stone, Fu Li, Julie A Wallace, Anand Merchant, Nicholas Creasap, John C Thompson, Enrico Caserta, Hui Wang, Jean-Leon Chong, Shan Naidu, Guo Wei, Sudarshana M Sharma, Julie A Stephens, Soledad A Fernandez, Metin N Gurcan, Michael B Weinstein, Sanford H Barsky, Lisa Yee, Thomas J Rosol, Paul C Stromberg, Michael L Robinson, Francois Pepin, Michael Hallett, Morag Park, Michael C Ostrowski, Gustavo Leone
Affiliations
- PMID: 19847259
- PMCID: PMC2767301
- DOI: 10.1038/nature08486
Pten in stromal fibroblasts suppresses mammary epithelial tumours
Anthony J Trimboli et al. Nature. 2009.
Abstract
The tumour stroma is believed to contribute to some of the most malignant characteristics of epithelial tumours. However, signalling between stromal and tumour cells is complex and remains poorly understood. Here we show that the genetic inactivation of Pten in stromal fibroblasts of mouse mammary glands accelerated the initiation, progression and malignant transformation of mammary epithelial tumours. This was associated with the massive remodelling of the extracellular matrix (ECM), innate immune cell infiltration and increased angiogenesis. Loss of Pten in stromal fibroblasts led to increased expression, phosphorylation (T72) and recruitment of Ets2 to target promoters known to be involved in these processes. Remarkably, Ets2 inactivation in Pten stroma-deleted tumours ameliorated disruption of the tumour microenvironment and was sufficient to decrease tumour growth and progression. Global gene expression profiling of mammary stromal cells identified a Pten-specific signature that was highly represented in the tumour stroma of patients with breast cancer. These findings identify the Pten-Ets2 axis as a critical stroma-specific signalling pathway that suppresses mammary epithelial tumours.
Figures
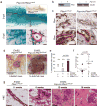
Figure 1. Stromal fibroblast-specific deletion of Pten
(a) Whole mount, X-gal stained mammary glands from Fsp-cre;Rosa+/loxP and Rosa+/loxP (top inset) mice. Higher magnification of whole mount gland (bottom left) and a histological cross section (bottom right); scale bar represent 30 μm. lu, lumen; epi, epithelium; str, stroma. (b) Representative Western blot analysis of mammary fibroblast lysates derived from 8 week-old PtenloxP/loxP mice with (+) without (−) Fsp-cre. (c) Paraffin sections from 8 week-old female mammary glands stained with a Pten-specific antibody; lower panels represent higher magnification of boxed areas; scale bars for top panels represent 200 μm and for bottom panels 30 μm. lu, lumen; epi, epithelial compartment; str, stromal compartment; red dotted line indicates the border between the two compartments. (d) Tumors collected at 26 weeks post-transplantation. (e) Tumor development by 16 weeks in mammary glands with the indicated genotypes. Tumorigenicity was determined by palpation or histological presentation of adenoma/carcinoma at each implantation site and statistically analyzed using Fisher’s Exact test. (n), represents the total number of transplants. (f) Total tumor burden at 26 weeks post-transplantation in mammary glands with the indicated genotypes. Differences were tested using the non-parametric Wilcoxon Rank Sum test. (g) H&E stained sections of mammary glands harvested at time of transplantation (0 weeks) and indicated times post-transplantation; scale bars represent 100 μm.
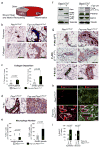
Figure 2. Characterization of ECM deposition and immune cell infiltration
(a) Schematic representation of the biological processes affected by differentially expressed genes (<4 fold) in _Pten_-deleted stromal fibroblasts. (b) Mammary gland paraffin sections stained with Masson’s Trichrome and Collagen I-specific antibodies, respectively; scale bars represent 200 μm. (c) Trichrome stained sections were quantified for collagen deposition; mammary glands in the absence (left graph) or presence of ErBb2 (right graph) were analyzed, respectively. Values shown represent the mean with s.d.; Wilcoxon Rank Sum test was used for the comparison between groups. (d) Mammary gland paraffin sections stained with the macrophage-specific marker F4/80; scale bars represent 50 μm. (e) Quantification of F4/80 positive stained stromal cells in mammary glands in the absence (left graph) or presence of ErBb2 (right graph), respectively. Values shown represent the mean with s.d.; Wilcoxon Rank Sum test was used for the comparison between groups. (f) Western blot analysis of whole-cell lysates derived from mammary stromal fibroblasts (g) Mammary gland paraffin sections stained with the phospho-Akt473/308, phospho-JNK183/185 and phospho-Erk1/2 specific antibodies; scale bars represent 100 μm. All analyses were performed using tissue or cells from 8 week-old females. (h) Frozen mammary tissue sections stained with a phospho-Ets2T72-specific antibody. Note that loss of Pten in the mammary stroma increased Ets2 phosphorylation in both the stromal and epithelial compartments. Dotted-white line indicates the stromal-epithelial boundary. lu, lumen; epi, epithelium; str, stroma and scale bars represent 50 μm. (i) Quantification of mammary epithelial and stromal cells that stained positive for nuclear phospho-Ets2T72. Values represent the mean with s.d.; Wilcoxon Rank Sum test was used for the statistical comparison between groups.
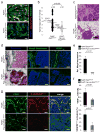
Figure 3. Ets2 ablation in stroma fibroblasts restricts mammary tumorigenesis
(a) Immunofluorescence staining of cultured mammary fibroblasts with Vimentin (green), p-Ets2(T72) (red) antibodies and counterstained with DAPI (blue). (b) Total mammary tumor volume of PyMT;Ets2db//loxP (n = 20) and PyMT;Fsp-cre;Ets2db/loxP (n = 21) mice collected 30 days after tumor initiation. Values represent the mean with s.d. shown in parentheses. (c) H&E staining of tumors harvested from PyMT;Ets2db//loxP or PyMT;Fsp-cre;Ets2db/loxP mice. (d) Consecutive sections stained for (left to right): trichrome, Mmp9 gelatinase activity and VEGF164, and counterstained with DAPI from PyMT;Ets2db/loxP and PyMT;Fsp-cre;Ets2db/loxP mammary tumors. (e) Quantification of Mmp9 mRNA expression by qRT-PCR. (f) Quantification of EGF164 IF staining in tumor stroma (top graph) and tumor endothelial cells co-expressing CD31 and phospho-VEGFR2 (bottom graph). (g) Tumor vascular endothelial cells visualized by IF double staining with CD31 (green) and p-VEGFR2(Tyr1173) (red), and counterstained with DAPI (blue) in mammary tumors collected one week post tumor initiation in PyMT;Ets2db/loxP and PyMT;Fsp-cre;Ets2db/loxP mice. All analyses were performed using tissue or cells from 9–10 week-old females and all scale bars represent 50μm. Bar values in Fig. 3e and 3f represent the mean and error bars represent s.d. Student t-test test was used for all the statistical comparisons between groups.
Figure 4. Loss of Ets2 in stromal fibroblasts diminishes tumor growth in stromal _Pten_-deleted mammary glands
(a) H&E sections of mammary glands after orthotopic injection of the _ErbB2_-expressing tumor cell line NT 2.5. T, tumor; str, stroma and scale bars represent 500 μm. (b) Volumes of tumors collected 21 days after injection. PtenloxP/loxP;Ets2db/loxP (n=10) and PtenloxP/loxP (n=10) control groups were combined ((*), n=20) after it was determined that there was no statistical difference in tumor incidence/load between these two control groups. Values represent the mean with s.d shown in parentheses. (c) Sections from mammary glands with the indicated genotypes stained with the macrophage-specific marker F4/80. Scale bars represent 100 μm. (d) Quantification of stromal cells positive for F4/80 in mammary glands. Values shown represent the mean with s.d. (e) Frozen mammary gland sections stained with the endothelial-specific antibody, CD31. Scale bars represent 50 μm. (f) Quantification of CD31 positive staining. Bar values in Fig. 4d and 4f represent the mean and error bars represent s.d. For all the statistical analyses, an ANOVA model with Bonferroni adjustment was used. Pairwise comparisons shown have a significant difference between marked genetic groups.
Figure 5. Pten-signature is represented in breast cancer stroma
(a) Heat map displaying the expression of the human orthologs of the 70-gene subset in normal- and tumor-stroma from human breast cancer patients. The 70-gene subset derived from the mouse Pten-signature includes 57 genes upregulated (denoted by red bar on the y-axis) and 13 genes downregulated (denoted by the green bar on the y-axis). Red and green regions inside the heat map indicate relative gene expression levels (red, increased and green, decreased). The p-value indicates the ability of the mouse 70-gene signature to partition normal and tumor stroma in breast cancer patients (see Statistical Methods). The coded patient IDs are listed at the bottom. (b) Venn diagram depicting the overlap between the mouse Pten-deleted fibroblast and human stroma microarray data sets. The 12 genes highlighted in red (Fig. 5a, right margin) are common between the mouse Pten 70 gene-signature and the human 163-gene signature that has been shown to associate with recurrence. This overlap is highly significant (p-value=2.5e−8; Fisher’s Exact Test). (c) Representative Pten, P-Ets2T72 and P-AktS473 IHC staining in human breast carcinoma samples from the tissue microarray. Scale bar represents 50 μm. (d) Pearson correlations between Pten, P-Ets2T72 and P-AktS473 expression based on Allred scores of a tissue microarray (Fig 5c) containing 99 patients with advanced breast carcinoma
Similar articles
- Reprogramming of the tumour microenvironment by stromal PTEN-regulated miR-320.
Bronisz A, Godlewski J, Wallace JA, Merchant AS, Nowicki MO, Mathsyaraja H, Srinivasan R, Trimboli AJ, Martin CK, Li F, Yu L, Fernandez SA, Pécot T, Rosol TJ, Cory S, Hallett M, Park M, Piper MG, Marsh CB, Yee LD, Jimenez RE, Nuovo G, Lawler SE, Chiocca EA, Leone G, Ostrowski MC. Bronisz A, et al. Nat Cell Biol. 2011 Dec 18;14(2):159-67. doi: 10.1038/ncb2396. Nat Cell Biol. 2011. PMID: 22179046 Free PMC article. - A ZEB1/p53 signaling axis in stromal fibroblasts promotes mammary epithelial tumours.
Fu R, Han CF, Ni T, Di L, Liu LJ, Lv WC, Bi YR, Jiang N, He Y, Li HM, Wang S, Xie H, Chen BA, Wang XS, Weiss SJ, Lu T, Guo QL, Wu ZQ. Fu R, et al. Nat Commun. 2019 Jul 19;10(1):3210. doi: 10.1038/s41467-019-11278-7. Nat Commun. 2019. PMID: 31324807 Free PMC article. - Ets2 in tumor fibroblasts promotes angiogenesis in breast cancer.
Wallace JA, Li F, Balakrishnan S, Cantemir-Stone CZ, Pecot T, Martin C, Kladney RD, Sharma SM, Trimboli AJ, Fernandez SA, Yu L, Rosol TJ, Stromberg PC, Lesurf R, Hallett M, Park M, Leone G, Ostrowski MC. Wallace JA, et al. PLoS One. 2013 Aug 16;8(8):e71533. doi: 10.1371/journal.pone.0071533. eCollection 2013. PLoS One. 2013. PMID: 23977064 Free PMC article. - Stromal fibroblasts in cancer initiation and progression.
Bhowmick NA, Neilson EG, Moses HL. Bhowmick NA, et al. Nature. 2004 Nov 18;432(7015):332-7. doi: 10.1038/nature03096. Nature. 2004. PMID: 15549095 Free PMC article. Review. - A mouse mammary gland involution mRNA signature identifies biological pathways potentially associated with breast cancer metastasis.
Stein T, Salomonis N, Nuyten DS, van de Vijver MJ, Gusterson BA. Stein T, et al. J Mammary Gland Biol Neoplasia. 2009 Jun;14(2):99-116. doi: 10.1007/s10911-009-9120-1. Epub 2009 Apr 30. J Mammary Gland Biol Neoplasia. 2009. PMID: 19408105 Review.
Cited by
- Can Targeting Stroma Pave the Way to Enhanced Antitumor Immunity and Immunotherapy of Solid Tumors?
Puré E, Lo A. Puré E, et al. Cancer Immunol Res. 2016 Apr;4(4):269-78. doi: 10.1158/2326-6066.CIR-16-0011. Cancer Immunol Res. 2016. PMID: 27036971 Free PMC article. Review. - Interactions between tumor cells and microenvironment in breast cancer: a new opportunity for targeted therapy.
Mitra S, Stemke-Hale K, Mills GB, Claerhout S. Mitra S, et al. Cancer Sci. 2012 Mar;103(3):400-7. doi: 10.1111/j.1349-7006.2011.02183.x. Epub 2012 Jan 30. Cancer Sci. 2012. PMID: 22151725 Free PMC article. Review. - Inactivation of Rb in stromal fibroblasts promotes epithelial cell invasion.
Pickard A, Cichon AC, Barry A, Kieran D, Patel D, Hamilton P, Salto-Tellez M, James J, McCance DJ. Pickard A, et al. EMBO J. 2012 May 29;31(14):3092-103. doi: 10.1038/emboj.2012.153. EMBO J. 2012. PMID: 22643222 Free PMC article. - PTEN is a negative regulator of NK cell cytolytic function.
Briercheck EL, Trotta R, Chen L, Hartlage AS, Cole JP, Cole TD, Mao C, Banerjee PP, Hsu HT, Mace EM, Ciarlariello D, Mundy-Bosse BL, Garcia-Cao I, Scoville SD, Yu L, Pilarski R, Carson WE 3rd, Leone G, Pandolfi PP, Yu J, Orange JS, Caligiuri MA. Briercheck EL, et al. J Immunol. 2015 Feb 15;194(4):1832-40. doi: 10.4049/jimmunol.1401224. Epub 2015 Jan 16. J Immunol. 2015. PMID: 25595786 Free PMC article. - Tumor stroma as targets for cancer therapy.
Zhang J, Liu J. Zhang J, et al. Pharmacol Ther. 2013 Feb;137(2):200-15. doi: 10.1016/j.pharmthera.2012.10.003. Epub 2012 Oct 12. Pharmacol Ther. 2013. PMID: 23064233 Free PMC article. Review.
References
- Mueller MM, Fusenig NE. Friends or foes - bipolar effects of the tumour stroma in cancer. Nat Rev Cancer. 2004;4:839–49. - PubMed
- Schedin P. Pregnancy-associated breast cancer and metastasis. Nat Rev Cancer. 2006;6:281–91. - PubMed
- Littlepage LE, Egeblad M, Werb Z. Coevolution of cancer and stromal cellular responses. Cancer Cell. 2005;7:499–500. - PubMed
Publication types
MeSH terms
Substances
Grants and funding
- R01CA053271/CA/NCI NIH HHS/United States
- P01 CA097189/CA/NCI NIH HHS/United States
- R01 CA085619/CA/NCI NIH HHS/United States
- R01CA85619/CA/NCI NIH HHS/United States
- P01CA097189/CA/NCI NIH HHS/United States
- R01 CA121275/CA/NCI NIH HHS/United States
- P01 CA097189-050002/CA/NCI NIH HHS/United States
- R01 CA085619-05/CA/NCI NIH HHS/United States
- R01 HD047470-05/HD/NICHD NIH HHS/United States
- R01HD47470/HD/NICHD NIH HHS/United States
- R01 CA121275-02/CA/NCI NIH HHS/United States
- R01 CA053271/CA/NCI NIH HHS/United States
- R01 HD047470/HD/NICHD NIH HHS/United States
LinkOut - more resources
Full Text Sources
Other Literature Sources
Medical
Molecular Biology Databases
Research Materials


