Cryo-electron tomography of bacteriophage phi6 procapsids shows random occupancy of the binding sites for RNA polymerase and packaging NTPase - PubMed (original) (raw)
Cryo-electron tomography of bacteriophage phi6 procapsids shows random occupancy of the binding sites for RNA polymerase and packaging NTPase
Daniel Nemecek et al. J Struct Biol. 2010 Sep.
Abstract
Assembly of dsRNA bacteriophage phi6 involves packaging of the three mRNA strands of the segmented genome into the procapsid, an icosahedrally symmetric particle with recessed vertices. The hexameric packaging NTPase (P4) overlies these vertices, and the monomeric RNA-dependent RNA polymerase (RdRP, P2) binds at sites inside the shell. P2 and P4 are present in substoichiometric amounts, raising the questions of whether they are recruited to the nascent procapsid in defined amounts and at specific locations, and whether they may co-localize to form RNA-processing assembly lines at one or more "special" vertices. We have used cryo-electron tomography to map both molecules on individual procapsids. The results show variable complements that accord with binomial distributions with means of 8 (P2) and 5 (P4), suggesting that they are randomly incorporated in copy numbers that simply reflect availability, i.e. their rates of synthesis. Analysis of the occupancy of potential binding sites (20 for P2; 12 for P4) shows no tendency to cluster nor for P2 and P4 to co-localize, suggesting that the binding sites for both proteins are occupied in random fashion. These observations indicate that although P2 and P4 act sequentially on the same substrates there is no direct physical coupling between their activities.
Published by Elsevier Inc.
Figures
Figure 1
(A) Section through a cryo-tomogram of ϕ6 procapsids. About 20% of procapsids are incomplete, with their shells interrupted at icosahedral 2-fold axes (black arrows). Scale bar = 400 Å. (B) The tomograms reveal strong densities at internal sites associated with P2 (white arrows) and external sites associated with P4 (black arrows). (C) A section shifted by 80 Å through the same particles as in (B), showing internal densities taken to be P2 molecules (white arrows). Bars: 500 Å.
Figure 2
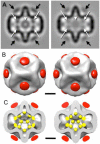
(A) Central sections through icosahedrally symmetrized ϕ6 procapsids obtained by single particle analysis (Sen et al., 2008; left) and from averaged tomograms (right). White arrows: P2; black arrows: P4; white arrowhead: central diffuse density. (B) Isosurface representations of the procapsids in (A) segmented into the different protein components, showing the P1 shell in grey and the P4 hexamers in red. (C) Same as (B) but cut through the center to show the P2 monomers in yellow. (The thresholds for the P2 and P4 densities were adjusted to approximately match the P1 shell). The single particle reconstruction was normalized to have the same reciprocal space amplitude profile as the tomographic average map, and band-limited to the same resolution (37 Å). Bar: 100 Å.
Figure 3
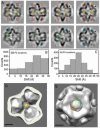
(A) Central sections through cryo-tomograms of four ϕ6 procapsids aligned to standard icosahedral orientation. The first row shows the nominal locations of P2 (yellow circles) and P4 (red circles) molecules, and the second row refined positions for P2 (green circles) and P4 (blue circles). Smaller diameters of some circles in the second row indicate refinements in the z-direction. Only one contact between each P4 hexamer and the P1 shell is observed (black arrowheads). Some internal densities (white arrowheads) are not close to any P2 site and contribute to the density in the center of the averaged and symmetrized density map (Figure 2A). The sections show variations in density in both the contiguous P1 shell and in the associated densities on account of missing wedge effects and low signal-to-noise ratio. (B) Histogram of the displacement of P2 molecules from their nominal sites. (C) Histogram of the displacement of P4 hexamers from their nominal sites. (D) The nominal site for P2 (yellow sphere) encased in a mesh generated by 25 Å shifts to indicate the extent of variability in the location of P2. (E) The central P4 with a mesh generated by 25 Å shifts of P4 to indicate the extent of variability in the location of P4. Bar: 100Å.
Figure 4
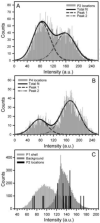
(A) Histogram of average intensities in the refined P2 locations obtained from the 315 selected procapsids, indicating two populations: occupied (left curve, ~55%) and empty (right curve, ~45%). (b) Histogram of average intensities in the refined P4 locations also indicates two populations: occupied (left curve, ~28%) and empty (right curve, ~72%). (c) Histogram of intensity within the P1 shell of an individual procapsid (light grey), and the background (dark grey), overlaid with the averaged intensities of the 20 refined locations for P2 (black bars).
Figure 5
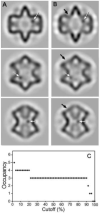
(A) A test case, showing three sections of an average procapsid with spherical densities (white arrows) inserted near the expected P2 locations. (B) The same sections after application of the missing wedge (right column) show smearing of density in the P1 shell (black arrow) and the inserted densities (white arrows). (C) Influence of the cutoff (percentage voxels above threshold) selected to enumerate the occupied P2 locations in the test case, showing a robust region of 22-90%, in which the three inserted densities were correctly identified.
Figure 6
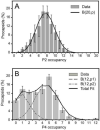
(A) Unimodal distribution of P2 occupancy, with a peak at 8 P2 subunits per procapsid. A binomial distribution for n = 20 locations was fitted to the P2 occupancy distribution (black line). (B) Distribution of P4 occupancies. The black line represents the sum of two binomial distributions with means of 1 and 5 for n = 12 locations. The error bars indicate one standard deviation and the fit is consistent with the data within the 5% confidence level (p-value = 0.22 for P2 and p-value = 0.39 for P4).
Figure 7
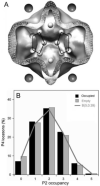
(A) A scheme of P2 (spheres inside) and P4 (spheres outside) locations in a cut-view through the averaged map of bacteriophage ϕ6 procapsid. The pentagonal rings indicate clusters of P2 molecules around five-fold vertices, each defined as close to the P4 hexamer bound at that vertex. (B) Distributions of occupancy of P2 locations around vertices that are either occupied (black bars) or unoccupied (grey bars) by P4 hexamers. Both distributions correspond to random occupancy of P2 subunits as given by a binomial distribution with a mean of 5 occupied sites (line).
Figure 8
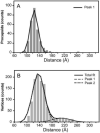
(A) Histogram of distances between the closest P2 - P4 pairs in procapsids, showing a single population centered at ~120 Å. The distance between the P4 location at the 5-fold axis and the closest P2 location at the 3-fold axis is ~150Å, whereas the distance to the second closest P2 location is ~220 Å. (B) Histogram of distances between P4 and the closest P2 for P4-occupied vertices. The histogram shows two populations of P4-occupied vertices that either have at least one of the five adjacent P2 locations occupied (90%) or that have no adjacent P2 location occupied (10%).
Similar articles
- Initial location of the RNA-dependent RNA polymerase in the bacteriophage Phi6 procapsid determined by cryo-electron microscopy.
Sen A, Heymann JB, Cheng N, Qiao J, Mindich L, Steven AC. Sen A, et al. J Biol Chem. 2008 May 2;283(18):12227-31. doi: 10.1074/jbc.M710508200. Epub 2008 Feb 20. J Biol Chem. 2008. PMID: 18287088 Free PMC article. - Probing, by self-assembly, the number of potential binding sites for minor protein subunits in the procapsid of double-stranded RNA bacteriophage Φ6.
Sun X, Bamford DH, Poranen MM. Sun X, et al. J Virol. 2012 Nov;86(22):12208-16. doi: 10.1128/JVI.01505-12. Epub 2012 Aug 29. J Virol. 2012. PMID: 22933292 Free PMC article. - Mutational analysis of the role of nucleoside triphosphatase P4 in the assembly of the RNA polymerase complex of bacteriophage phi6.
Paatero AO, Mindich L, Bamford DH. Paatero AO, et al. J Virol. 1998 Dec;72(12):10058-65. doi: 10.1128/JVI.72.12.10058-10065.1998. J Virol. 1998. PMID: 9811745 Free PMC article. - Self-assembly of double-stranded RNA bacteriophages.
Poranen MM, Tuma R. Poranen MM, et al. Virus Res. 2004 Apr;101(1):93-100. doi: 10.1016/j.virusres.2003.12.009. Virus Res. 2004. PMID: 15010220 Review. - Precise packaging of the three genomic segments of the double-stranded-RNA bacteriophage phi6.
Mindich L. Mindich L. Microbiol Mol Biol Rev. 1999 Mar;63(1):149-60. doi: 10.1128/MMBR.63.1.149-160.1999. Microbiol Mol Biol Rev. 1999. PMID: 10066834 Free PMC article. Review.
Cited by
- Viral life cycles captured in three-dimensions with electron microscopy tomography.
Fu CY, Johnson JE. Fu CY, et al. Curr Opin Virol. 2011 Aug;1(2):125-33. doi: 10.1016/j.coviro.2011.06.008. Curr Opin Virol. 2011. PMID: 21887207 Free PMC article. Review. - Component tree analysis of cystovirus φ6 nucleocapsid Cryo-EM single particle reconstructions.
Oliveira LM, Ye Z, Katz A, Alimova A, Wei H, Herman GT, Gottlieb P. Oliveira LM, et al. PLoS One. 2018 Jan 4;13(1):e0188858. doi: 10.1371/journal.pone.0188858. eCollection 2018. PLoS One. 2018. PMID: 29300742 Free PMC article. - Cryo-electron tomography of bacterial viruses.
Guerrero-Ferreira RC, Wright ER. Guerrero-Ferreira RC, et al. Virology. 2013 Jan 5;435(1):179-86. doi: 10.1016/j.virol.2012.08.022. Virology. 2013. PMID: 23217626 Free PMC article. Review. - Characterization of the first double-stranded RNA bacteriophage infecting Pseudomonas aeruginosa.
Yang Y, Lu S, Shen W, Zhao X, Shen M, Tan Y, Li G, Li M, Wang J, Hu F, Le S. Yang Y, et al. Sci Rep. 2016 Dec 9;6:38795. doi: 10.1038/srep38795. Sci Rep. 2016. PMID: 27934909 Free PMC article. - Protein P7 of the cystovirus φ6 is located at the three-fold axis of the unexpanded procapsid.
Katz G, Wei H, Alimova A, Katz A, Morgan DG, Gottlieb P. Katz G, et al. PLoS One. 2012;7(10):e47489. doi: 10.1371/journal.pone.0047489. Epub 2012 Oct 15. PLoS One. 2012. PMID: 23077625 Free PMC article.
References
- Butcher SJ, Grimes JM, Makeyev EV, Bamford DH, Stuart DI. A mechanism for initiating RNA-dependent RNA polymerization. Nature. 2001;410:235–40. - PubMed
- Cardone G, Grunewald K, Steven AC. A resolution criterion for electron tomography based on cross-validation. J Struct Biol. 2005;151:117–29. - PubMed
- Day LA, Mindich L. The molecular weight of bacteriophage phi 6 and its nucleocapsid. Virology. 1980;103:376–85. - PubMed
- de Haas F, Paatero AO, Mindich L, Bamford DH, Fuller SD. A symmetry mismatch at the site of RNA packaging in the polymerase complex of dsRNA bacteriophage phi6. J Mol Biol. 1999;294:357–72. - PubMed
Publication types
MeSH terms
Substances
LinkOut - more resources
Full Text Sources
Research Materials

