The transcriptional diversity of 25 Drosophila cell lines - PubMed (original) (raw)
doi: 10.1101/gr.112961.110. Epub 2010 Dec 22.
Aarron Willingham, Dayu Zhang, Li Yang, Yi Zou, Brian D Eads, Joseph W Carlson, Jane M Landolin, Philipp Kapranov, Jacqueline Dumais, Anastasia Samsonova, Jeong-Hyeon Choi, Johnny Roberts, Carrie A Davis, Haixu Tang, Marijke J van Baren, Srinka Ghosh, Alexander Dobin, Kim Bell, Wei Lin, Laura Langton, Michael O Duff, Aaron E Tenney, Chris Zaleski, Michael R Brent, Roger A Hoskins, Thomas C Kaufman, Justen Andrews, Brenton R Graveley, Norbert Perrimon, Susan E Celniker, Thomas R Gingeras, Peter Cherbas
Affiliations
- PMID: 21177962
- PMCID: PMC3032933
- DOI: 10.1101/gr.112961.110
The transcriptional diversity of 25 Drosophila cell lines
Lucy Cherbas et al. Genome Res. 2011 Feb.
Abstract
Drosophila melanogaster cell lines are important resources for cell biologists. Here, we catalog the expression of exons, genes, and unannotated transcriptional signals for 25 lines. Unannotated transcription is substantial (typically 19% of euchromatic signal). Conservatively, we identify 1405 novel transcribed regions; 684 of these appear to be new exons of neighboring, often distant, genes. Sixty-four percent of genes are expressed detectably in at least one line, but only 21% are detected in all lines. Each cell line expresses, on average, 5885 genes, including a common set of 3109. Expression levels vary over several orders of magnitude. Major signaling pathways are well represented: most differentiation pathways are "off" and survival/growth pathways "on." Roughly 50% of the genes expressed by each line are not part of the common set, and these show considerable individuality. Thirty-one percent are expressed at a higher level in at least one cell line than in any single developmental stage, suggesting that each line is enriched for genes characteristic of small sets of cells. Most remarkable is that imaginal disc-derived lines can generally be assigned, on the basis of expression, to small territories within developing discs. These mappings reveal unexpected stability of even fine-grained spatial determination. No two cell lines show identical transcription factor expression. We conclude that each line has retained features of an individual founder cell superimposed on a common "cell line" gene expression pattern.
Figures
Figure 1.
Clustering of cell lines by principal component analysis. (A) Clustering of cell lines with whole-animal developmental stages, showing components 1, 2, and 3. The whole-animal data were obtained using the same procedures as the cell line data (Graveley et al. 2011). (Red) Cell lines. (Dotted line) A trajectory for the developmental data. (Blue) Embryonic stages (E_x_, where x is the time, in hours, at the end of a 2-h period measured from egg-laying); (green) larval stages (L_x_ where x is the instar number; 3A, 3B, 3C, and 3D represent sequential periods in the third larval instar); (pink) pupal stages (P_x_, where x is the time, in hours, after white prepupa); (brown) adult males (M_x_, where x is the time, in days, after adult eclosion); (yellow) adult females (F_x_, where x is the time, in days, after adult eclosion). (B) Clustering of 25 cell lines; components 1 and 2 are shown. Cell lines are color-coded to indicate the tissues from which they were derived; a key is shown below the graph.
Figure 2.
Expression of key signaling pathways in the 25 cell lines. Summary data are shown for 10 pathways, indicating the expression of known ligands and receptors for each pathway in each cell line; for a more complete description, see text. Cell lines are color-coded according to the tissue origin, which is shown above.
Figure 3.
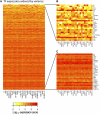
Expression of transcription factors in 25 cell lines. The heat map indicates log10(expression score) for the genes indicated and for all 25 cell lines. The color key is shown below. (A) All 483 transcription factor genes detected in the cell lines. (B) The 28 transcription factor genes whose expression is most variable among the cell lines. (C) The 28 transcription factor genes exhibiting the least variation among the lines.
Figure 4.
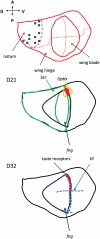
Examples of spatial assignments of two wing disc lines, illustrating the logic used to make these assignments. The examples shown in these cartoons are a few of the genes used to assign spatial identity to cell lines; a more complete list can be found in Table 3. The top panel shows a fate map of a Drosophila wing disc (based on a figure from (Held 2002). The middle panel illustrates the sites of expression of three genes expressed in line D21: Optix expression is confined to a small area of the prospective wing blade, straddling the dorsal/ventral (D/V) boundary near the proximal portion of the anterior wing blade (outlined in yellow). fng is a marker for the dorsal compartment in the wing blade and part of the hinge and notal regions (dark blue). Ser is expressed widely in the dorsal compartment, but in the wing blade region, it is confined to the region just on the dorsal side of the D/V boundary (green). Line D21 therefore has expression properties suggesting an origin in the small region colored red. The bottom panel illustrates the sites of expression of three genes expressed in line D32. Gr23a is expressed strongly in this line; taste receptors in the adult (presumably including Gr23a) are confined to the anterior margin of the wing blade, derived from the region of the D/V boundary within the anterior compartment (thick purple line). Dl is expressed in a line of cells on each side of the D/V boundary (dashed blue lines). fng, as described above, is a marker for the dorsal compartment in the wing blade region (dark blue). The region whose expression resembles D32 therefore is somewhere along the red line, just dorsal to the D/V boundary within the anterior compartment.
Figure 5.
Detection of known exons as a function of the cell lines studied. The number of annotated exons with detectable expression (score ≥ 200) in at least one cell line was computed as a function of the number of cell lines included in the calculation. The calculation was repeated 1000 times using randomly permuted orders for the addition of cell lines.
Figure 6.
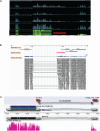
Examples of new UTRs revealed by novel contigs. (A) Novel contig whose expression is correlated with that of chinmo. The region illustrated includes the 3′ portion of the annotated chinmo gene and all of its downstream neighbor, cpb. Signal graphs for the transcripts are shown for eight cell lines. (Red bar) The position of the novel contig; a region of continuously overlapping paired-end sequences (blue line) connects the novel contig to chinmo. (B) Novel contig that appears to encode a novel 3′ exon for Fs(2)Ket. The display is similar to panel A, showing the convergently transcribed genes Fs(2)Ket and CG9310. Much of the region between the two genes is covered by a transposable element and is therefore masked from both tiling array and RNA-seq analysis. However, paired-end RNA-seq showed multiple clones in all four of the lines that were analyzed in which one end lies in the 3′ region of the annotated Fs(2)Ket transcript and the other end lies in the novel contig 7 kb away; the dashed blue line indicates the region that is bridged by these clones. The novel contig also contains overlapping paired-end clones that extend into the annotated CG9310 transcript. These data indicate that the contig probably corresponds to novel overlapping 3′ regions from the two genes. (C) A contig that corresponds to a novel 5′ exon for Prestin, a gene for which only the coding region was previously annotated. (From top to bottom) The novel contig (red bar); a novel splice junction identified from RNA-seq data from S2-DRSC RNA; the FlyBase v5.12 annotation for Prestin, which includes only the coding region (purple); a Prestin transcript from the unpublished annotation MB8 (MJ van Baren, L Langton, CL Comstock, BC Koebbe, and MR Brent, unpubl.;
), which used the RNA-seq splicing data as input for the annotation (blue and white); sequence of a full-length cDNA clone MIP14411 (GenBank accession no. BT120083) retrieved by targeting with the FB 5.12 gene model; and pattern of transcripts from RNA-seq analysis of S2-DRSC cells.
Similar articles
- Biological function of unannotated transcription during the early development of Drosophila melanogaster.
Manak JR, Dike S, Sementchenko V, Kapranov P, Biemar F, Long J, Cheng J, Bell I, Ghosh S, Piccolboni A, Gingeras TR. Manak JR, et al. Nat Genet. 2006 Oct;38(10):1151-8. doi: 10.1038/ng1875. Epub 2006 Sep 3. Nat Genet. 2006. PMID: 16951679 - Dynamic genome wide expression profiling of Drosophila head development reveals a novel role of Hunchback in retinal glia cell development and blood-brain barrier integrity.
Torres-Oliva M, Schneider J, Wiegleb G, Kaufholz F, Posnien N. Torres-Oliva M, et al. PLoS Genet. 2018 Jan 23;14(1):e1007180. doi: 10.1371/journal.pgen.1007180. eCollection 2018 Jan. PLoS Genet. 2018. PMID: 29360820 Free PMC article. - A genetic and molecular characterization of two proximal heterochromatic genes on chromosome 3 of Drosophila melanogaster.
Schulze SR, Sinclair DA, Fitzpatrick KA, Honda BM. Schulze SR, et al. Genetics. 2005 Apr;169(4):2165-77. doi: 10.1534/genetics.103.023341. Epub 2005 Jan 31. Genetics. 2005. PMID: 15687284 Free PMC article. - Morphogenesis of Drosophila melanogaster macrochaetes: cell fate determination for bristle organ.
Furman DP, Bukharina TA. Furman DP, et al. J Stem Cells. 2012;7(1):19-41. J Stem Cells. 2012. PMID: 23550342 Review.
Cited by
- FGF Pyramus Has a Transmembrane Domain and Cell-Autonomous Function in Polarity.
Stepanik V, Sun J, Stathopoulos A. Stepanik V, et al. Curr Biol. 2020 Aug 17;30(16):3141-3153.e5. doi: 10.1016/j.cub.2020.06.006. Epub 2020 Jul 2. Curr Biol. 2020. PMID: 32619487 Free PMC article. - Drosophila protein interaction map (DPiM): a paradigm for metazoan protein complex interactions.
Guruharsha KG, Obar RA, Mintseris J, Aishwarya K, Krishnan RT, Vijayraghavan K, Artavanis-Tsakonas S. Guruharsha KG, et al. Fly (Austin). 2012 Oct-Dec;6(4):246-53. doi: 10.4161/fly.22108. Fly (Austin). 2012. PMID: 23222005 Free PMC article. - Adapting Drosophila melanogaster Cell Lines to Serum-Free Culture Conditions.
Luhur A, Mariyappa D, Klueg KM, Buddika K, Tennessen JM, Zelhof AC. Luhur A, et al. G3 (Bethesda). 2020 Dec 3;10(12):4541-4551. doi: 10.1534/g3.120.401769. G3 (Bethesda). 2020. PMID: 33028628 Free PMC article. - Dynamic changes in ORC localization and replication fork progression during tissue differentiation.
Hua BL, Bell GW, Kashevsky H, Von Stetina JR, Orr-Weaver TL. Hua BL, et al. BMC Genomics. 2018 Aug 22;19(1):623. doi: 10.1186/s12864-018-4992-3. BMC Genomics. 2018. PMID: 30134926 Free PMC article. - Resources for functional genomics studies in Drosophila melanogaster.
Mohr SE, Hu Y, Kim K, Housden BE, Perrimon N. Mohr SE, et al. Genetics. 2014 May;197(1):1-18. doi: 10.1534/genetics.113.154344. Epub 2014 Mar 20. Genetics. 2014. PMID: 24653003 Free PMC article. Review.
References
- Andres AJ, Cherbas P 1992. Tissue-specific ecdysone responses: Regulation of the Drosophila genes Eip28/29 and Eip40 during larval development. Development 16: 865–876 - PubMed
- Arthur CG, Weide CM, Vincent WSI, Goldstein ES 1979. mRNA sequence diversity during early embryogenesis in Drosophila melanogaster. Exp Cell Res 121: 87–94 - PubMed
Publication types
MeSH terms
Substances
LinkOut - more resources
Full Text Sources
Other Literature Sources
Molecular Biology Databases
Research Materials


