Global changes in the nuclear positioning of genes and intra- and interdomain genomic interactions that orchestrate B cell fate - PubMed (original) (raw)
. 2012 Dec;13(12):1196-204.
doi: 10.1038/ni.2432. Epub 2012 Oct 14.
Affiliations
- PMID: 23064439
- PMCID: PMC3501570
- DOI: 10.1038/ni.2432
Global changes in the nuclear positioning of genes and intra- and interdomain genomic interactions that orchestrate B cell fate
Yin C Lin et al. Nat Immunol. 2012 Dec.
Abstract
The genome is folded into domains located in compartments that are either transcriptionally inert or transcriptionally permissive. Here we used genome-wide strategies to characterize domains during B cell development. Structured interaction matrix analysis showed that occupancy by the architectural protein CTCF was associated mainly with intradomain interactions, whereas sites bound by the histone acetyltransferase p300 or the transcription factors E2A or PU.1 were associated with intra- and interdomain interactions that are developmentally regulated. We identified a spectrum of genes that switched nuclear location during early B cell development. In progenitor cells, the transcriptionally inactive locus encoding early B cell factor (Ebf1) was sequestered at the nuclear lamina, which thereby preserved their multipotency. After development into the pro-B cell stage, Ebf1 and other genes switched compartments to establish new intra- and interdomain interactions associated with a B lineage-specific transcription signature.
Conflict of interest statement
COMPETING FINANCIAL INTERESTS
The authors declare no competing financial interests.
Figures
Figure 1
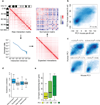
The folding pattern of the pro-B cell genome. (a) Strategy for Hi-C data normalization from expected interaction frequencies. Normalized genome-wide contact matrix revealing intrachromosomal interactions involving chromosome 11. Indicated are the ratios of observed versus expected reads. Blue pixels represent lower than expected whereas red pixels reflect higher than expected interaction frequencies. (b) Conservation of PC1 values of murine pro-B cells versus syntenic regions derived from human mature-B lineage cells. Scatter plot of a genome-wide comparison of PC1 values using 50 kb windows derived from mouse chromosome 11 of pro-B cells and syntenic regions derived from human mature-B lineage cells. Intensities of blue pixels correspond to density of indicated regions. (c) Regions with high average PhastCons scores are more closely associated with transcriptionally permissive compartments to regions exhibiting low average PhastCons scores. (d) Coordinate patterns of gene expression and gene localization correlate well within chromatin domains but not with genes dispersed across domains. Distribution of average pair-wise correlations of gene expression values across 96 mouse tissues. Average pair-wise correlations were computed for each active domain for a minimum of ten genes. Values were calculated by comparing genes within the same domain (intra-domain) or by comparing genes in different domains (inter-domain) (P < 1 x10⁻⁷) (**e**) Genes located in the transcriptionally repressive compartment show a more lineage restricted pattern of gene expression as compared to loci positioned in a transcriptionally permissive compartment. For each annotated gene we calculated the number of tissues with detectable expression. The whisker-box plot shows the distribution of these values for genes located in the transcriptionally repressive compartment (PC1 < −25), genes located in regions that show intermediate PC1 values (−25 < PC1< 25), and genes located in the transcriptionally permissive compartment (PC1 > 25). Single Hi-C analyses were performed using either EGS or formaldehyde fixed cells. Gene expression was obtained from BIOGPS that were derived from two independent experiments (GSE10246).
Figure 2
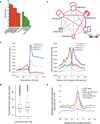
The transcriptionally permissive compartment is spatially segregated into islands of H3K27me3 and H3K4me2. (a) Enrichment of epigenetic marks and genomic annotations such as promoters, transcription start sites, exons, introns and gene deserts (>100 kb from a Refseq gene) at the end points of significant interactions relative to random genomic positions (10 kb window). (b) The transcriptionally permissive compartment is spatially segregated into islands of H3K27me3 and H3K4me2. The relative frequency by which epigenetic marks were associated across loop attachment points was computed and then visualized in Cytoscape. The relative frequency by which epigenetic marks were associated within loop attachment points is indicated by node size. The significance/reproducibility of tethering, in terms of _P_-values, was visualized by the edge width of connecting paired marked elements. The color (red-blue) is representative of the log ratio of observed frequencies relative to expected frequencies (i.e. the strength of the association). (c) Genome-wide repertoires of enhancers act by looping to promoter regions across large genomic distances. Left, the density of nascent RNAs as determined by GRO-Seq as a function of genomic distance from the transcription start site for promoters that showed looping towards putative enhancers defined by promoter-distal H3K4me2 peaks. Both sense (bold blue) and anti-sense transcription (bold red) initiated from the transcription start site are shown. Nascent transcripts initiated from promoters in the absence of enhancer interactions are indicated for sense (light blue) and anti-sense (light red) transcription. Right, the density of nascent RNAs as determined by GRO-Seq as a function of genomic distance from E2A binding sites located in intergenic H3K4me2 peaks (putative enhancer regions) for enhancers. Both sense (bold blue) and anti-sense transcription (bold red) initiated from the putative enhancer regions are shown. Nascent transcripts initiated from the enhancer regions in the absence of interactions with transcription start site are indicated for sense (light blue) and anti-sense (light red) transcription. (d) Distribution of the normalized number of E2A ChIP-Seq reads per peak at peaks either interacting or lacking an interaction with nearby TSS. (e) Promoter and enhancer elements frequently function as anchors across the pro-B cell genome. Distribution of loop attachment points as a function of genomic distance from transcription start sites (TSS) and transcription factor binding sites (referred to as peaks) are indicated. ChIP-Seq and GRO-Seq experiments were performed one time.
Figure 3
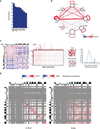
Two distinct classes of anchors establish the pro-B cell interactome. (a) Potential anchors associated with the pro-B cell interactome are indicated. The enrichment for E2A, PU.1, CTCF, Rad21, Ebf1, c-Myc and p300 occupancy at loop attachment regions are shown. (b) Distinct putative anchors across the pro-B cell interactome are visualized in Cytoscape. The relative frequency by which putative anchors were associated with loop attachment points is indicated by node size. The significance/reproducibility of tethering, in terms of _P_-values, is visualized by the edge width of connecting paired marked elements. The color (red-blue) is representative of the ratio of observed frequencies relative to expected frequencies (i.e. the strength of the association). (c) Structured Interaction Matrix Analysis (SIMA) identifies distinct classes of anchors acting at different length scales across the pro-B cell interactome. Binding sites within domains were pooled and examined for interactions across the domains to binding sites in other domains (left and middle). These values were compared to peak positions that were randomized 10,000 times and _P_-values associated with enrichment for interactions were calculated (middle and right). (d) Distinct classes of anchors act at the different length scales. Compartmental interactions across the transcriptionally permissive compartment were examined for enrichment of interactions at sites exhibiting CTCF and E2A occupancy. One independent Hi-C experiment was performed to generate the data presented here. ChIP-Seq experiments were performed in two independent experiments for CTCF and one experiment for p300 and c-myc.
Figure 4
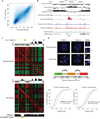
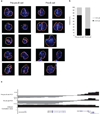
Switching compartments between transcriptionally repressive and permissive nuclear compartments during B lineage specification. (a) B cell development incurs changes in compartment structure. Scatter density plot between pre-pro-B and pro-B defined PC1 values at 25 kb intervals. Genomic regions that switch nuclear environments during the transition from the pre-pro-B to the pro-B cell stage are shown by signals that are located away from the diagonal. (b) Ebf1 locus depicting PC1 values of chromosome 11 of pre-pro-B and pro-B cells in a region surrounding the Ebf1 locus. Inter-experimental correlation is also shown. Nascent RNA (GRO-Seq) and H3K4me2 and E2A ChIP-Seq read densities are indicated. (c) Correlation matrices were derived from chromosome 11 for pre-pro-B and pro-B cells by correlating the normalized interaction ratios for each 25 kb interval against all other regions. The differential correlation values were calculated by comparing the two correlation matrices at each loci. Yellow box indicates the genomic region encoding Ebf1. (d) 3D-FISH in nuclei derived from pre-pro-B and pro-B cells using fluorescently labeled BACs that span three distinct regions across chromosome 11 including the domain containing Ebf1 locus. Digitally magnified pictures of the domains adjacent to the Ebf1 locus are shown. BACs (shown in red, green and orange) were directly labeled with dUTP conjugated to Alexa Fluor dyes. Nuclei were visualized by DAPI staining (blue). Genomic organization of the Ebf1 locus and adjacent regions are indicated. BAC probes specific to the Ebf1 domain (green) and the adjacent constitutively inert domain (orange) as well as a distally located constitutively permissive domain (red) are shown. Lower panel shows the distribution of spatial distances between the probes measured for 102 and 106 alleles in pre-pro-B and pro-B cells, respectively. Data obtained from two 3D-FISH experiments were added and presented.
Figure 5
The Ebf1 locus is closely associated with the nuclear lamina in pre-pro-B cells. (a) Immuno-FISH in nuclei derived from pre-pro-B and pro-B cells using a fluorescently labeled BAC encoding the Ebf1 domain as in previous figure and lamin antibodies. Digitally magnified pictures of nuclear location of the Ebf1 locus in pre-pro-B and pro-B cells are shown. BACs (shown in green) were directly labeled with dUTP conjugated to Alexa dyes. Nuclei were visualized by DAPI staining (blue). Nuclear lamina are shown in orange. (b) The graph shows the fraction of spatial distances (<500 nm) separating the Ebf1 domain from the nuclear lamina in pre-pro-B and pro-B cells, respectively. 112 and 102 measurements were done in pre-pro-B and pro-B cells, respectively. (c) PC1 values for the Bcl11b locus in pre-pro-B and pro-B cells are indicated. Data obtained from two experiments were added and presented.
Figure 6
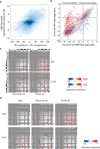
Repositioning of loci during developmental progression from a transcriptionally repressive to a permissive compartment is accompanied either with activation of gene expression or silencing by deposition of H3K27me3. (a) Switching nuclear environments is tightly linked with changes in nascent transcription as measured by GRO-Seq. For each 25 kb interval of the genome, the difference in nascent RNA read density (log2) was plotted versus the differential PC1 values derived from pre-pro-B and pro-B cells. Black line represents moving average values for 100 regions. (b) Relocating chromatin domains from an inert to a transcriptionally permissive compartment during developmental progression of B-lineage cells is associated with changes in gene expression. Pre-pro-B and pro-B RPKM (log2) values for RefSeq genes were plotted against each other. Red dots represent genes located within regions that switched from a transcriptionally repressive to a transcriptionally permissive compartment. Blue dots represent genes in regions that switched from a transcriptionally permissive compartment in pre-pro-B to an inert compartment in pro-B cells. (c) Loop-attachment points associated with E2A occupancy in pro-B cells change during developmental progression. E2A and CTCF binding sites found in pre-pro-B and pro-B cell domains were examined using SIMA. Specifically, reads were pooled and examined for interactions across the transcriptionally permissive environment to binding sites in other compartments. These values were compared to peak positions that were randomized and P-values associated with enrichment for paired interactions were calculated and visualized with red boxes representing higher than expected frequencies and blue boxes representing lower than expected frequencies. Matrices on the left use pre-pro-B Hi-C interactions for SIMA calculations and matrices on the right use pro-B Hi-C interactions. (d) Loop-attachment points enriched for E2A and Sox2 were examined in embryonic stem cells (ESC), pre-pro-B and pro-B cells using SIMA. E2A binding sites were identified in the pro-B cell genome whereas Sox2 occupancy was derived from embryonic stem cells. The data presented were derived from a single Hi-C experiment.
Figure 7
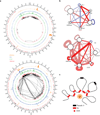
Switching nuclear compartments is closely associated with remodeling of chromatin architecture. (a) Extensive remodeling of chromatin structure is associated with the transition from the pre-pro-B to the pro-B cell stage. Circos diagram of genomic regions including the Igk locus representing significant intrachromosomal interactions in pre-pro-B (top) versus pro-B cells (bottom) (P < 0.05). H3K4me2 deposition is indicated in red. CTCF occupancy is shown in green. E2A occupancy is indicated in blue. GRO-Seq read density is shown in orange. The intronic enhancer (Eik)-Jκ region is indicated by the green bar. Pseudo V segments are indicated in black bars whereas functional V segments are indicated in red bars. (b) Vκ regions cluster across the pro-B cell interactome. The significance/reproducibility of tethering between various genomic regions was determined by SIMA and then visualized using Cytoscape. The width of edges are proportional to the log _P_-value of association, and the color (red-blue) is representative of the ratio of observed interaction frequencies relative to expected frequencies (i.e. the strength of the association). (c) Model depicting depicting the Igk locus. In this model a subset of Vκ segments are anchored in close spatial proximity, surrounding an inner cavity containing the Jκ elements. Data presented were obtained from two Hi-C experiments representing pre-pro-B and pro-B cells.
Similar articles
- A global network of transcription factors, involving E2A, EBF1 and Foxo1, that orchestrates B cell fate.
Lin YC, Jhunjhunwala S, Benner C, Heinz S, Welinder E, Mansson R, Sigvardsson M, Hagman J, Espinoza CA, Dutkowski J, Ideker T, Glass CK, Murre C. Lin YC, et al. Nat Immunol. 2010 Jul;11(7):635-43. doi: 10.1038/ni.1891. Epub 2010 Jun 13. Nat Immunol. 2010. PMID: 20543837 Free PMC article. - Epigenetic Enhancer Marks and Transcription Factor Binding Influence Vκ Gene Rearrangement in Pre-B Cells and Pro-B Cells.
Kleiman E, Loguercio S, Feeney AJ. Kleiman E, et al. Front Immunol. 2018 Sep 13;9:2074. doi: 10.3389/fimmu.2018.02074. eCollection 2018. Front Immunol. 2018. PMID: 30271408 Free PMC article. - Regulation of E2A activities by histone acetyltransferases in B lymphocyte development.
Bradney C, Hjelmeland M, Komatsu Y, Yoshida M, Yao TP, Zhuang Y. Bradney C, et al. J Biol Chem. 2003 Jan 24;278(4):2370-6. doi: 10.1074/jbc.M211464200. Epub 2002 Nov 14. J Biol Chem. 2003. PMID: 12435739 - The regulatory network of B-cell differentiation: a focused view of early B-cell factor 1 function.
Boller S, Grosschedl R. Boller S, et al. Immunol Rev. 2014 Sep;261(1):102-15. doi: 10.1111/imr.12206. Immunol Rev. 2014. PMID: 25123279 Free PMC article. Review. - Lineage commitment in lymphopoiesis.
Busslinger M, Nutt SL, Rolink AG. Busslinger M, et al. Curr Opin Immunol. 2000 Apr;12(2):151-8. doi: 10.1016/s0952-7915(99)00065-5. Curr Opin Immunol. 2000. PMID: 10712946 Review.
Cited by
- Spatial enhancer clustering and regulation of enhancer-proximal genes by cohesin.
Ing-Simmons E, Seitan VC, Faure AJ, Flicek P, Carroll T, Dekker J, Fisher AG, Lenhard B, Merkenschlager M. Ing-Simmons E, et al. Genome Res. 2015 Apr;25(4):504-13. doi: 10.1101/gr.184986.114. Epub 2015 Feb 12. Genome Res. 2015. PMID: 25677180 Free PMC article. - The pluripotent genome in three dimensions is shaped around pluripotency factors.
de Wit E, Bouwman BA, Zhu Y, Klous P, Splinter E, Verstegen MJ, Krijger PH, Festuccia N, Nora EP, Welling M, Heard E, Geijsen N, Poot RA, Chambers I, de Laat W. de Wit E, et al. Nature. 2013 Sep 12;501(7466):227-31. doi: 10.1038/nature12420. Epub 2013 Jul 24. Nature. 2013. PMID: 23883933 - The Function of E2A in B-Cell Development.
Miyazaki M, Miyazaki K. Miyazaki M, et al. Adv Exp Med Biol. 2024;1459:97-113. doi: 10.1007/978-3-031-62731-6_5. Adv Exp Med Biol. 2024. PMID: 39017841 Review. - Major Reorganization of Chromosome Conformation During Muscle Development in Pig.
Marti-Marimon M, Vialaneix N, Lahbib-Mansais Y, Zytnicki M, Camut S, Robelin D, Yerle-Bouissou M, Foissac S. Marti-Marimon M, et al. Front Genet. 2021 Oct 5;12:748239. doi: 10.3389/fgene.2021.748239. eCollection 2021. Front Genet. 2021. PMID: 34675966 Free PMC article. - Causal Gene Regulatory Network Modeling and Genomics: Second-Generation Challenges.
Rothenberg EV. Rothenberg EV. J Comput Biol. 2019 Jul;26(7):703-718. doi: 10.1089/cmb.2019.0098. Epub 2019 May 7. J Comput Biol. 2019. PMID: 31063008 Free PMC article.
References
- Sedat J, Manuelidis L. A direct approach to the structure of eukaryotic chromosomes. Cold Spring Harbor Symp. Quant. Biol. 1977;42:331–350. - PubMed
- Rattner JB, Lin CC. Radial loops and helixcal coils coexist in methaphase chromosomes. Cell. 1985;42:291–296. - PubMed
- Paulson JR, Laemmli UK. The structure of histone depleted metaphase chromosomes. Cell. 1977;12:817–828. - PubMed
- Pienta KJ, Coffey DS. A structural analysis of the nuclear matrix and DNA loops in the organization of the nucleus and chromosome. J. Cell Sci. Suppl. 1984;1:123–135. - PubMed
- Munkel C, Langowski J. Chromosome structure described by a polymer model. Phys. Rev. 1998;E57(5B):5888–5896.
Publication types
MeSH terms
Substances
Grants and funding
- Z01 AI000880/ImNIH/Intramural NIH HHS/United States
- R01 CA054198/CA/NCI NIH HHS/United States
- P30 CA023100/CA/NCI NIH HHS/United States
- R01 AI082850/AI/NIAID NIH HHS/United States
- P30 CA23100/CA/NCI NIH HHS/United States
- R01 AI100880/AI/NIAID NIH HHS/United States
- AI082850A/AI/NIAID NIH HHS/United States
- 3R01AI082850/AI/NIAID NIH HHS/United States
LinkOut - more resources
Full Text Sources
Other Literature Sources
Molecular Biology Databases
Miscellaneous
