Cell surface-specific N-glycan profiling in breast cancer - PubMed (original) (raw)
Cell surface-specific N-glycan profiling in breast cancer
Xia Liu et al. PLoS One. 2013.
Abstract
Aberrant changes in specific glycans have been shown to be associated with immunosurveillance, tumorigenesis, tumor progression and metastasis. In this study, the N-glycan profiling of membrane proteins from human breast cancer cell lines and tissues was detected using modified DNA sequencer-assisted fluorophore-assisted carbohydrate electrophoresis (DSA-FACE). The N-glycan profiles of membrane proteins were analyzed from 7 breast cancer cell lines and MCF 10A, as well as from 100 pairs of breast cancer and corresponding adjacent tissues. The results showed that, compared with the matched adjacent normal tissue samples, two biantennary N-glycans (NA2 and NA2FB) were significantly decreased (p <0.0001) in the breast cancer tissue samples, while the triantennary glycan (NA3FB) and a high-mannose glycan (M8) were dramatically increased (p = 0.001 and p <0.0001, respectively). Moreover, the alterations in these specific N-glycans occurred through the oncogenesis and progression of breast cancer. These results suggested that the modified method based on DSA-FACE is a high-throughput detection technology that is suited for analyzing cell surface N-glycans. These cell surface-specific N-glycans may be helpful in recognizing the mechanisms of tumor cell immunologic escape and could be potential targets for new breast cancer drugs.
Conflict of interest statement
Competing Interests: The authors have declared that no competing interests exist.
Figures
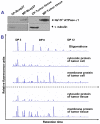
Figure 1. Establishment of the DSA-FACE method for analyzing N-glycan profiling in breast cancer.
(A) Equal amounts (20 μg and 100 μg for cell line and tissue specimens, respectively) of cytoplasmic and membrane proteins (CP and MP) from Bcap 37 cells and tumor tissue were determined by Western blotting using γ-tubulin and Na+/K+ ATPase-α1 antibody, respectively. Na+/K+ ATPase-α1 (an integral membrane protein) and γ-tubulin (a core component of the centrosome) were chosen as the cytomembrane and cytoplasm markers, respectively. (B) The representative N-glycan profiles of cytosolic and membrane proteins from cell line (upper panel, n=8) and tissue (lower panel, n=200).
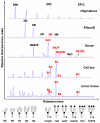
Figure 2. The representative N-glycan profiles of membrane proteins from human breast cancer cell line and tissue.
The desialylated N-glycan profiles of membrane proteins from cell lines (n=8) and tumor tissues (n=100). Oligomaltose is used as a sugar mass reference. The number of glucose units (degree of polymerization, DP) in these structures is indicated. N-glycan profiles from RNaseB and serum were used as N-glycan profile controls. RNaseB contained high mannose from M5 to M9. Serum contained various complex N-glycans and the most abundant glycans detected in serum are marked. The vertical axis represents the glycan intensity of the peaks as a percent of the relative fluorescence level. The X-axis represents the retention time of the peaks. The N-glycan structures of the corresponding peaks are shown below the panels. NGA2F is an agalacto core-α-1, 6-fucosylated biantennary glycan; NA2 is a bigalacto biantennary glycan; NA2F is a bigalacto core-α-1, 6-fucosylated biantennary glycan; NA2FB is a bigalacto core-α-1, 6-fucosylated bisecting biantennary glycan; NA3 is tri-antennary; NA3FB is a core-α-1, 6-fucosylated triantennary glycan. The symbols used in the structural formulas are as follows: (○) β-linked N-acetylglucosamine; (●) β-linked galactose; (□) α-linked mannose; (■) β-linked mannose; (▲) α-1, 6-linked fucose.
Figure 3. The exoglycosidase sequencing of the membrane protein N-glycans from tumor tissues.
(A) Exoglycosidase sequencing of N-glycans of membrane proteins from breast cancer tissue (lower panel) and glycoproteins from healthy human serum as reference (upper panel) to verify the structures of peaks B1, B4 and B5. The structures of peaks B2 and B3 are confirmed in (B) and (C), respectively. The total N-glycans were treated with single or combined exoglycosidase arrays as indicated in context. The arrow lines indicate the changes in glycan peaks that underwent glycosidase digestion. The nomenclature of N-glycans and symbolic representations correspond to those in Figure 2.
Figure 4. The significantly changed N-glycans of the membrane proteins of human breast cancer cell lines.
(A) The representative N-glycan profiles of membrane proteins from human breast cancer cell lines (n=7). MCF 10A: from breast fibrocystic disease as a non-tumorigenic epithelial cell line; SK-BR-3, MCF-7, Bcap 37, MDA-MB-231, T-47D, Hs 578T and ZR-75-30: cancer cell lines; Serum: from healthy humans. (B–D) The statistically significant difference in N-glycan peaks B1, B2, B4 and B5 between MCF 10A and various cancer cell lines. Peak B2 is significantly increased in cancer cell lines compared with MCF 10A. On the contrary, peaks B1 and B4 are dramatically decreased in cancer cell lines. Particularly, peak B4 is completely lost in Bcap 37, MDA-MB-231 and Hs 578T cell lines. The percentages of each specific peak height in the total peak heights are expressed as mean ± SD. Asterisks indicate statistically significant differences between the various cancer cell lines and the MCF 10A cell line (* p < 0.05, ** p < 0.01). Five major glycan peaks B1-B5 in normal control and breast cancer groups were detected. Experiments were repeated three times.
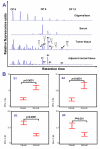
Figure 5. The significantly changed N-glycans in breast cancer tissues compared to adjacent normal tissues.
(A) The typical cell surface-specific N-glycan profiles from breast cancer tissue (n=100) and adjacent normal tissue (n=100). (B) The statistically significant differences of N-glycan peaks B1, B2, B4 and B5 between breast cancer and adjacent normal tissues. The statistically significant differences between groups are indicated as p value. The structures of the N-glycan peaks B1, B2, B4 and B5 are shown in the Figure 2.
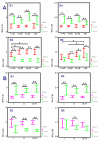
Figure 6. The significantly changed N-glycans in breast cancer tissues according to age and clinical stage.
(A) The correlation of cell surface specific N-glycans with four age groups. (B) The correlation of cell-surface specific N-glycans with clinical stages. Statistically significant differences between groups is indicated by p value (* p < 0.05, ** p < 0.01). The structures of N-glycan peaks B1, B2, B4 and B5 are shown in Figure 2.
Figure 7. The schematic presentation of changes in N-linked glycans in breast cancer.
The increased concentration of NA3FB (peak B5) and decreased concentration of NA2 (peak B1) and NA2FB (peak B4) in breast cancer tissues could be attributed to the increased activity of GnT-V, which competes for substrate with GnT-III and is associated with the consequential elevated level of branched N-glycans.
Similar articles
- Specific N-glycans of Hepatocellular Carcinoma Cell Surface and the Abnormal Increase of Core-α-1, 6-fucosylated Triantennary Glycan via N-acetylglucosaminyltransferases-IVa Regulation.
Nie H, Liu X, Zhang Y, Li T, Zhan C, Huo W, He A, Yao Y, Jin Y, Qu Y, Sun XL, Li Y. Nie H, et al. Sci Rep. 2015 Nov 5;5:16007. doi: 10.1038/srep16007. Sci Rep. 2015. PMID: 26537865 Free PMC article. - Functional roles of sialylation in breast cancer progression through miR-26a/26b targeting ST8SIA4.
Ma X, Dong W, Su Z, Zhao L, Miao Y, Li N, Zhou H, Jia L. Ma X, et al. Cell Death Dis. 2016 Dec 29;7(12):e2561. doi: 10.1038/cddis.2016.427. Cell Death Dis. 2016. PMID: 28032858 Free PMC article. - Altered desialylated plasma N-glycan profile in patients with non-small cell lung carcinoma.
Bartling B, Vanhooren V, Dewaele S, Libert C, Hofmann HS, Haerting J, Nuding S, Silber RE, Simm A, Chen CC. Bartling B, et al. Cancer Biomark. 2011-2012;10(3-4):145-54. doi: 10.3233/CBM-2012-0239. Cancer Biomark. 2011. PMID: 22674300 - Functional impact of tumor-specific N-linked glycan changes in breast and ovarian cancers.
Guo H, Abbott KL. Guo H, et al. Adv Cancer Res. 2015;126:281-303. doi: 10.1016/bs.acr.2014.11.006. Epub 2015 Feb 7. Adv Cancer Res. 2015. PMID: 25727151 Review. - In Situ Cellular Glycan Analysis.
Chen Y, Ding L, Ju H. Chen Y, et al. Acc Chem Res. 2018 Apr 17;51(4):890-899. doi: 10.1021/acs.accounts.7b00617. Epub 2018 Mar 29. Acc Chem Res. 2018. PMID: 29595964 Review.
Cited by
- Non-glycanated ΔDCN isoform in muscle invasive bladder cancer mediates cancer stemness and gemcitabine resistance.
Wu N, Wang J, Fan M, Liang Y, Wei Qi X, Deng F, Zeng F. Wu N, et al. Cell Oncol (Dordr). 2024 Dec;47(6):2163-2181. doi: 10.1007/s13402-024-00998-8. Epub 2024 Oct 28. Cell Oncol (Dordr). 2024. PMID: 39466536 - Oligomannose _N_-Glycans 3D Architecture and Its Response to the FcγRIIIa Structural Landscape.
Fogarty CA, Fadda E. Fogarty CA, et al. J Phys Chem B. 2021 Mar 18;125(10):2607-2616. doi: 10.1021/acs.jpcb.1c00304. Epub 2021 Mar 4. J Phys Chem B. 2021. PMID: 33661628 Free PMC article. - Structure and anticancer activity of a new lectin from the cultivated red alga, Kappaphycus striatus.
Hung LD, Trinh PTH. Hung LD, et al. J Nat Med. 2021 Jan;75(1):223-231. doi: 10.1007/s11418-020-01455-0. Epub 2020 Oct 6. J Nat Med. 2021. PMID: 33025357 Free PMC article. - Trends in oligomannosylation and α1,2-mannosidase expression in human cancers.
Chatterjee S, Ugonotti J, Lee LY, Everest-Dass A, Kawahara R, Thaysen-Andersen M. Chatterjee S, et al. Oncotarget. 2021 Oct 12;12(21):2188-2205. doi: 10.18632/oncotarget.28064. eCollection 2021 Oct 12. Oncotarget. 2021. PMID: 34676051 Free PMC article. - Increased expression of the high-mannose M6N2 and NeuAc3H3N3M3N2F tri-antennary _N_-glycans in cholangiocarcinoma.
Talabnin K, Talabnin C, Ishihara M, Azadi P. Talabnin K, et al. Oncol Lett. 2018 Jan;15(1):1030-1036. doi: 10.3892/ol.2017.7384. Epub 2017 Nov 9. Oncol Lett. 2018. PMID: 29399163 Free PMC article.
References
- Ries L, Eisner M, C.L. K (2005) SEER Cancer statistics Review. Bethesda, MD: National Cancer Institute.
- Celis JE, Gromov P, Cabezón T, Moreira JM, Ambartsumian N et al. (2004) Proteomic characterization of the interstitial fluid perfusing the breast tumor microenvironment: a novel resource for biomarker and therapeutic target discovery. Mol Cell Proteomics 3: 327-344. doi:10.1074/mcp.M400009-MCP200. PubMed: 14754989. - DOI - PubMed
- Hudelist G, Singer CF, Pischinger KID, Kaserer K, Manavi M et al. (2006) Proteomic analysis in human breast cancer: Identification of a characteristic protein expression profile of malignant breast epithelium. Proteomics 6: 1989-2002. doi:10.1002/pmic.200500129. PubMed: 16470630. - DOI - PubMed
- Minafra IP, Cancemi P, Fontana S, Minafra L, Feo S et al. (2006) Expanding the protein catalogue in the proteome reference map of human breast cancer cells. Proteomics 6: 2609-2625. doi:10.1002/pmic.200500627. PubMed: 16526084. - DOI - PubMed
- Contessa JN, Bhojani MS, Freeze HH, Rehemtulla A, Lawrence TS (2008) Inhibition of N-linked glycosylation disrupts receptor tyrosine kinase signaling in tumor cells. Cancer Res 68: 3803-3809. doi:10.1158/0008-5472.CAN-07-6389. PubMed: 18483264. - DOI - PMC - PubMed
Publication types
MeSH terms
Substances
Grants and funding
This work was supported by a grant from The National Natural Science Foundation of China (30700987 and 81171945), China Postdoctoral Science Foundation funded project (20090451003) and Project Supported by Development Program for Outstanding Young Teachers in Harbin Institute of Technology (HITQNJS.2007.026). The funders had no role in study design, data collection and analysis, decision to publish, or preparation of the manuscript.
LinkOut - more resources
Full Text Sources
Other Literature Sources
Medical
Research Materials


