QSOX1 inhibits autophagic flux in breast cancer cells - PubMed (original) (raw)
QSOX1 inhibits autophagic flux in breast cancer cells
Laura Poillet et al. PLoS One. 2014.
Abstract
The QSOX1 protein (Quiescin Sulfhydryl oxidase 1) catalyzes the formation of disulfide bonds and is involved in the folding and stability of proteins. More recently, QSOX1 has been associated with tumorigenesis and protection against cellular stress. It has been demonstrated in our laboratory that QSOX1 reduces proliferation, migration and invasion of breast cancer cells in vitro and reduces tumor growth in vivo. In addition, QSOX1 expression has been shown to be induced by oxidative or ER stress and to prevent cell death linked to these stressors. Given the function of QSOX1 in these two processes, which have been previously linked to autophagy, we wondered whether QSOX1 might be regulated by autophagy inducers and play a role in this catabolic process. To answer this question, we used in vitro models of breast cancer cells in which QSOX1 was overexpressed (MCF-7) or extinguished (MDA-MB-231). We first showed that QSOX1 expression is induced following amino acid starvation and maintains cellular homeostasis. Our results also indicated that QSOX1 inhibits autophagy through the inhibition of autophagosome/lysosome fusion. Moreover, we demonstrated that inhibitors of autophagy mimic the effect of QSOX1 on cell invasion, suggesting that its role in this process is linked to the autophagy pathway. Previously published data demonstrated that extinction of QSOX1 promotes tumor growth in NOG mice. In this study, we further demonstrated that QSOX1 null tumors present lower levels of the p62 protein. Altogether, our results demonstrate for the first time a role of QSOX1 in autophagy in breast cancer cells and tumors.
Conflict of interest statement
Competing Interests: The authors have declared that no competing interests exist.
Figures
Figure 1. QSOX1 is induced following a nutrient stress and protects against cell death.
(A, B) MDA-MB-231 shC cells were cultured in the presence or absence of EBSS for 2, 4, 6 and 8 h. (A) After a reverse transcription step, relative QSOX1 mRNA expression was determined by qPCR. H3B-2 mRNA was used for normalization. Data are means ± S.D. of two independent experiments performed in triplicate. *P<0.05, compared to the control. (B) Cells were lysed and total proteins (50 µg) were separated on a 10% SDS-PAGE followed by immunoblotting using anti-QSOX1 and anti-actin antibodies. QSOX1 levels were quantified using the Image Lab software. NS: Non specific signal. (C, D) MCF-7 C, QSOX1S-1, QSOX1S-2 and MDA-MB-231 shC, shQSOX1-1, shQSOX1-2 cells were cultured in the presence or absence of EBSS for 8 h. Cell viability was estimated using a MTT assay (C) or a trypan blue exclusion assay (D). Results were expressed as a ratio between treated and untreated cells. Data are means ± S.D. of two independent experiments performed in 8 replicates for the MTT assay and in duplicate for the trypan blue exclusion assay). *P<0.05 compared to the control.
Figure 2. QSOX1 regulates the levels of autophagic markers, p62 and LC3-II.
(A) MCF-7 C (lanes 1–3), QSOX1S-1 (lanes 4–6), QSOX1S-2 (lanes 7–9) and (B) MDA-MB-231 shC (lanes 1–3), shQSOX1-2 (lanes 4–6), shQSOX1-1 (lanes 7–9) cells were cultured for 24 h. Cells were then lysed and total proteins (40 µg) were separated on a 12.5% SDS-PAGE followed by immunoblotting using anti-p62, anti-LC3 and anti-actin antibodies. (C and D) p62 and LC3-II levels, observed on the western blot in A and B respectively, were quantified using the Image Lab software. Data are means ± S.D. of one representative experiment performed in triplicate. *P<0.05 compared to the control. (E and F) After reverse transcription, relative p62 mRNA levels in MCF-7 C, QSOX1S-1, QSOX1S-2 (E) and MDA-MB-231 shC, shQSOX1-1, shQSOX1-2 (F) cells were determined by qPCR. H3B-2 mRNA was used for normalization. Data are means ± S.D. of one representative experiment performed in triplicate.
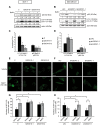
Figure 3. QSOX1 inhibits autophagic flux.
(A) MCF-7 C, QSOX1S-1, QSOX1S-2 and (B) MDA-MB-231 shC, shQSOX1-2, shQSOX1-1 cells were cultured in complete medium with or without 100 nM bafilomycin A1 for 8 h. Cells were then lysed and total proteins (40 µg) were separated on 12.5% SDS-PAGE followed by immunoblotting with anti-p62, anti-LC3 and anti-actin antibodies. p62 and LC3-II levels were quantified using the Image Lab software. (C and D) The autophagic flux, observed in A and B respectively, was determined as the ratio of LC3-II protein levels in the presence of bafilomycin A1 versus the levels in the absence of bafilomycin A1. Data are means ± S.D. of three independent experiments. *P<0.05 compared to the control. (E) MCF-7 C, QSOX1S-1, QSOX1S-2 and (F) MDA-MB-231 shC, shQSOX1-1, shQSOX1-2 cells were transfected with the pGFP-LC3 vector. 24 h after transfection, cells were incubated with or without 100 nM bafilomycin A1 for 8 h. GFP-LC3 puncta were then analyzed by confocal microscopy. Each picture is representative of a typical cell staining observed in 10 fields chosen at random. Scale bar represents 20 µm. (G and H) GFP-LC3 puncta, observed in E and F respectively, were counted using the ImageJ software. For each group, 20 cells were randomly selected. Data are means ± S.D. of three independent experiments. *P<0.05 compared to the control.
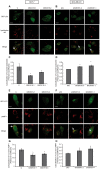
Figure 4. QSOX1 inhibits autophagosome/lysosome fusion.
(A) MCF-7 C, QSOX1S-1, QSOX1S-2 and (B) MDA-MB-231 shC, shQSOX1-1, shQSOX1-2 cells were transfected with the pGFP-LC3 vector. 24 h after transfection, cells were incubated in complete medium supplemented with 500 nM Lysotracker red for 1 h. Scale bar represents 10 µm. (C and D) Colocalization between Lysotracker-stained acidic vesicles and GFP-LC3-positive autophagosomes, observed in A and B respectively, was quantified using a confocal microscope and the Pearson’s coefficient using coloc_2 plugin (ImageJ software). The data representative of two independent experiments are shown. *P<0.05 compared to the control. Arrows indicate colocalization. (E) MCF-7 C, QSOX1S-1, QSOX1S-2 and (F) MDA-MB-231 shC, shQSOX1-1, shQSOX1-2 cells were transfected with the pGFP-LC3 vector and then immunostained for LAMP1. Arrows indicate colocalization and Scale bar represents 10 µm. (G and H) Colocalization of the autophagosome marker GFP-LC3 and the lysosomal marker LAMP1 was analyzed using a confocal microscope and the Pearson’s coefficient using coloc_2 (ImageJ software). A representative image of two independent experiments is shown. *P<0.05 compared to the control.
Figure 5. QSOX1 function in cell invasion is related to its role in autophagy.
(A) MCF-7 C, QSOX1S-1, QSOX1S-2 and (B) MDA-MB-231 shC, shQSOX1-1, shQSOX1-2 cells were seeded on polycarbonate filters coated with Matrigel and incubated for 24 h, in the presence or absence of autophagy inhibitors 3-MA (10 mM) or wortmannin (100 nM). Inserts were then stained with a 2% crystal violet solution and photographed. A representative image of ten fields of view (FOV) of each membrane is shown. Scale bar represents 30 µm. (C and D) 10 FOV were randomly selected and the number of invasive cells, observed in A and B respectively, was determined. Data are means ± S.D. of two independent experiments performed in duplicate. *P<0.05 compared to the control.
Figure 6. The extinction of QSOX1 expression in tumors is correlated with low levels of p62.
(A) Tissue sections of MDA-MB-231 shC, shQSOX1-2 and shQSOX1-1 tumors fixed in formol were subjected to p62 immunostaining. Sections were then analyzed by confocal microscopy and a representative image of 3 independent experiments performed in duplicate is shown. Scale bar represents 30 µm. (B) The number of p62 puncta per cell and (C) the number of p62-positive cells were determined using the ImageJ software. To determine the number of p62 puncta, 40 cells per tumor were randomly counted. To determine the number of p62-positive cells count, 23 fields were randomly chosen. *P<0.05 compared to the control.
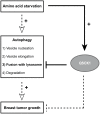
Figure 7. QSOX1 functions in breast cancer cells.
Our results demonstrate that QSOX1 expression is induced following a nutrient stress-induced autophagy. QSOX1 also inhibits autophagy through the inhibition of autophagosome/lysosome fusion and its inhibitory effect on autophagy could explain its function in breast cancer cell invasion and tumor growth. Dotted arrows and lines represent data which have already been described whereas solid arrows and lines represent results obtained in our study.
Similar articles
- High expression of QSOX1 reduces tumorogenesis, and is associated with a better outcome for breast cancer patients.
Pernodet N, Hermetet F, Adami P, Vejux A, Descotes F, Borg C, Adams M, Pallandre JR, Viennet G, Esnard F, Jouvenot M, Despouy G. Pernodet N, et al. Breast Cancer Res. 2012 Oct 25;14(5):R136. doi: 10.1186/bcr3341. Breast Cancer Res. 2012. PMID: 23098186 Free PMC article. - Expression of quiescin sulfhydryl oxidase 1 is associated with a highly invasive phenotype and correlates with a poor prognosis in Luminal B breast cancer.
Katchman BA, Ocal IT, Cunliffe HE, Chang YH, Hostetter G, Watanabe A, LoBello J, Lake DF. Katchman BA, et al. Breast Cancer Res. 2013 Mar 28;15(2):R28. doi: 10.1186/bcr3407. Breast Cancer Res. 2013. PMID: 23536962 Free PMC article. - Elevated transcription of the gene QSOX1 encoding quiescin Q6 sulfhydryl oxidase 1 in breast cancer.
Soloviev M, Esteves MP, Amiri F, Crompton MR, Rider CC. Soloviev M, et al. PLoS One. 2013;8(2):e57327. doi: 10.1371/journal.pone.0057327. Epub 2013 Feb 27. PLoS One. 2013. PMID: 23460839 Free PMC article. - The emerging role of QSOX1 in cancer.
Lake DF, Faigel DO. Lake DF, et al. Antioxid Redox Signal. 2014 Jul 20;21(3):485-96. doi: 10.1089/ars.2013.5572. Epub 2014 Feb 19. Antioxid Redox Signal. 2014. PMID: 24359107 Free PMC article. Review. - Extracellular Acidification Induces Lysosomal Dysregulation.
Ordway B, Gillies RJ, Damaghi M. Ordway B, et al. Cells. 2021 May 13;10(5):1188. doi: 10.3390/cells10051188. Cells. 2021. PMID: 34067971 Free PMC article. Review.
Cited by
- Multi-proteomic analyses of 5xFAD mice reveal new molecular signatures of early-stage Alzheimer's disease.
Lee S, Jang KI, Lee H, Jo YS, Kwon D, Park G, Bae S, Kwon YW, Jang JH, Oh YS, Lee C, Yoon JH. Lee S, et al. Aging Cell. 2024 Jun;23(6):e14137. doi: 10.1111/acel.14137. Epub 2024 Mar 4. Aging Cell. 2024. PMID: 38436501 Free PMC article. - Quiescin Sulfhydryl Oxidase 1 (QSOX1) Secreted by Lung Cancer Cells Promotes Cancer Metastasis.
Sung HJ, Ahn JM, Yoon YH, Na SS, Choi YJ, Kim YI, Lee SY, Lee EB, Cho S, Cho JY. Sung HJ, et al. Int J Mol Sci. 2018 Oct 17;19(10):3213. doi: 10.3390/ijms19103213. Int J Mol Sci. 2018. PMID: 30336636 Free PMC article. - Differences in the expression of chromosome 1 genes between lung telocytes and other cells: mesenchymal stem cells, fibroblasts, alveolar type II cells, airway epithelial cells and lymphocytes.
Sun X, Zheng M, Zhang M, Qian M, Zheng Y, Li M, Cretoiu D, Chen C, Chen L, Popescu LM, Wang X. Sun X, et al. J Cell Mol Med. 2014 May;18(5):801-10. doi: 10.1111/jcmm.12302. J Cell Mol Med. 2014. PMID: 24826900 Free PMC article. - QSOX1 expression is associated with aggressive tumor features and reduced survival in breast carcinomas.
Knutsvik G, Collett K, Arnes J, Akslen LA, Stefansson IM. Knutsvik G, et al. Mod Pathol. 2016 Dec;29(12):1485-1491. doi: 10.1038/modpathol.2016.148. Epub 2016 Aug 26. Mod Pathol. 2016. PMID: 27562495 - Tumor-initiating cells of breast and prostate origin show alterations in the expression of genes related to iron metabolism.
Rychtarcikova Z, Lettlova S, Tomkova V, Korenkova V, Langerova L, Simonova E, Zjablovskaja P, Alberich-Jorda M, Neuzil J, Truksa J. Rychtarcikova Z, et al. Oncotarget. 2017 Jan 24;8(4):6376-6398. doi: 10.18632/oncotarget.14093. Oncotarget. 2017. PMID: 28031527 Free PMC article.
References
- Musard JF, Sallot M, Dulieu P, Fraichard A, Ordener C, et al. (2001) Identification and expression of a new sulfhydryl oxidase SOx-3 during the cell cycle and the estrus cycle in uterine cells. Biochem Biophys Res Commun 287: 83–91. - PubMed
- Thorpe C, Hoober KL, Raje S, Glynn NM, Burnside J, et al. (2002) Sulfhydryl oxidases: emerging catalysts of protein disulfide bond formation in eukaryotes. Arch Biochem Biophys 405: 1–12. - PubMed
- Tury A, Mairet-Coello G, Poncet F, Jacquemard C, Risold PY, et al. (2004) QSOX sulfhydryl oxidase in rat adenohypophysis: localization and regulation by estrogens. J Endocrinol 183: 353–363. - PubMed
- Benayoun B, Esnard-Feve A, Castella S, Courty Y, Esnard F (2001) Rat seminal vesicle FAD-dependent sulfhydryl oxidase. Biochemical characterization and molecular cloning of a member of the new sulfhydryl oxidase/quiescin Q6 gene family. J Biol Chem 276: 13830–13837. - PubMed
Publication types
MeSH terms
Substances
LinkOut - more resources
Full Text Sources
Other Literature Sources
Medical
Molecular Biology Databases
Miscellaneous


