Connexins modulate autophagosome biogenesis - PubMed (original) (raw)
Connexins modulate autophagosome biogenesis
Eloy Bejarano et al. Nat Cell Biol. 2014 May.
Abstract
The plasma membrane contributes to the formation of autophagosomes, the double-membrane vesicles that sequester cytosolic cargo and deliver it to lysosomes for degradation during autophagy. In this study, we have identified a regulatory role for connexins (Cx), the main components of plasma membrane gap junctions, in autophagosome formation. We have found that plasma-membrane-localized Cx proteins constitutively downregulate autophagy through a direct interaction with several autophagy-related proteins involved in the initial steps of autophagosome formation, such as Atg16 and components of the PI(3)K autophagy initiation complex (Vps34, Beclin-1 and Vps15). On nutrient starvation, this inhibitory effect is released by the arrival of Atg14 to the Cx-Atg complex. This promotes the internalization of Cx-Atg along with Atg9, which is also recruited to the plasma membrane in response to starvation. Maturation of the Cx-containing pre-autophagosomes into autophagosomes leads to degradation of these endogenous inhibitors, allowing for sustained activation of autophagy.
Conflict of interest statement
Competing Financial Interest
The authors declare that they have no competing interests.
Figures
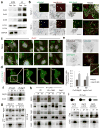
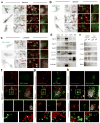
Figure 1. Atg16 associates with Cx43 in an early step of autophagosome biogenesis
(a) Immunoblot for the indicated Cx of homogenates and autophagic vacuoles (AV) isolated from fed or 6h starved (Stv) mice. Quantification of enrichment is shown in Supplementary Fig. 1a. (b) Immunofluorescence for LC3 and Atg16 in NRK cells expressing GFP-Cx43 maintained in the presence or absence of serum for 4h. Single channels are shown in reverse black and white and magnification of single and merged images are shown in color. Arrows: colocalization of Atg16/Cx43 (yellow) or Atg16/Cx43/LC3 (white). Quantification is shown in Supplementary Fig. 1c. (c) Immunofluorescence for the indicated endogenous proteins in NRK cells maintained in serum-supplemented media without additions (None) or treated with chloroquine (CQ) for 4h. Full fields are shown in Supplementary Fig. 1d. (d) Maximum projection confocal microscopy 3D reconstruction (left) followed by a single plane time-lapse acquisition of the region outlined by the white square in HeLa cells expressing EBFP2-Cx43 (pseudocolored in red) and sfGFP-ATG16. (e) Immunofluorescence for LC3 and Atg16 in NRK cells expressing GFP-Cx43 but knocked down for Eps15. Single channels are shown in reverse black and white and merged images in color. Inset shows higher magnification. Bottom: Quantification of colocalization between Atg16 and Cx43 (n=3 wells, 4 independent experiments, >20 cells per experiment). Values are mean+s.e.m. (*) p <0.05. (f, g) Immunoblot for the indicated proteins of immunoprecipitates (IP) of endogenous Cx43 and Atg16 from mouse embryonic fibroblasts (MEF) wild type cells maintained in the presence (f, g) or absence of serum (4h) (g). I: input; FT: flow through. (h) Immunoblot for the indicated proteins of immunoprecipitates (IP) of endogenous Cx43 from MEFs wild type untreated (Wt), upon incubation with 3-methyladenine (3MA) or in MEFs from Atg5 null mice (Atg5−/−). (i) Immunoblot for flag and Cx43 of immunoprecipitates (IP) of endogenous Cx43 in Wt MEFs transfected with the indicated flag-tagged constructs of truncated Atg16. GAPDH, LC3 and Atg5 are show as negative controls for IP. All values are mean+s.e.m. Nuclei are highlighted with DAPI. Bars: 5 μm. Uncropped images of blots are shown in Supplementary Fig. 9.
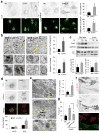
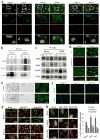
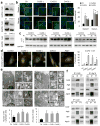
Figure 2. Autophagy is highly upregulated in cells from Cx43 knock-out mice
(a) Immunostaining for LC3 and GABARAP in mouse osteoblasts (MOB) from wild type (Wt) or Cx43 null mice (Cx43−/−) grown in serum-supplemented media. Reverse black and white channels (top) and color images (bottom). Right: Average number of LC3 and GABARAP puncta per cell (n=3 wells, 3 independent experiments, >50 cells per experiment). (b) Electron micrographs of Wt and Cx43−/− MOB grown in serum-supplemented media. Yellow arrows: autophagic vacuoles. Insets: autophagic vacuoles (AV) at higher magnification. Right: Percentage of cytoplasm area occupied by AV (top) and number of AV per area (bottom) (n=3 mice, >10 micrographs per mice). (c) Immunoblot for LC3 of the same cells grown in serum-supplemented media untreated or treated with lysosomal protease inhibitors (PI) for 2 or 4h. Top: representative immunoblot. GAPDH is shown as loading control. Bottom: LC3 flux (left) and increase in LC3-II during lysosomal inhibition (right) (n= 3 independent experiments). (d) Representative images of the same cells transfected with the mCherry-GFP-LC3 tandem reporter and grown in serum-supplemented media. Single channel images (inverted black and white) and merged images (color). Bottom: Number of vesicles positive for GFP and mCherry (autophagosomes; APG) and only for mCherry (autophagolysosomes; APL) (n=4 wells, 4 independent experiments, >30 cells per experiment). (e) Electron micrographs of livers from Wt and Cx43+/− mice. Arrows indicate AV. Right: Percentage of cytosolic area occupied by AVs (n=3 mice, >10 micrographs per mice). (f) Immunofluorescence for LC3 in Cx43−/− MOBs expressing GFP-tagged full-length Cx43. Single channels (inverted black and white) and merged channels (color). Asterisks: transfected (green) and untransfected (red) cells. (g) LC3-positive puncta per cell in the indicated cells (n=3 wells, 3 independent experiments, >50 cells per experiment). All values are mean+s.e.m. and differences with Wt were significant for (*) p<0.01. Nuclei are highlighted with DAPI. Bars: 5 μm in fluorescence images; 1 μm and 0.1 μm in top panels and inserts of b and e. Uncropped images of blots are shown in Supplementary Fig. 9
Figure 3. Cx43 domains responsible for the inhibitory effect over macroautophagy
(a) Immunoblot for LC3 in MOB from wild type (Wt) or Cx43 null mice (Cx43−/−) treated with vehicle or with 18α glycyrrhetinic acid (18α GA). Glyceraldehyde-3-dehydrogenae (GPD) is shown as loading control. Levels of LC3-II (left) and LC3-II flux (right) (n= 3 independent experiments). (b) Immunofluorescence for LC3 in MOB cells treated with vehicle or 18α GA. Where indicated, chloroquine (CQ) was added to block lysosomal degradation. Bottom: Quantification of the average number of LC3-positive puncta per cell (n=3 wells, 3 independent experiments, >30 cells per experiment). (c) Immunofluorescence for LC3 in Wt or Cx43−/− MOBs cells treated with the indicated kinase inhibitors for 2 hours. Insets: Higher magnification images in inverted black and white. (d) Endogenous LC3 puncta in the same cells shown in c (n=3 wells, 3 independent experiments, >50 cells per experiment). *, differences with Wt and §, differences with untreated. (e) LC3 puncta in Cx43−/− MOBs transfected with constructs coding for different forms of Cx43 (full length, CT, ΔCT258 or ΔCT245) tagged as indicated in the scheme. Left: Representative images. Merged fields (left) and LC3 channel in reverse black and white (right) are shown (images of GFP-Cx43 are shown in Fig. 2f). Right: Quantification of the average number of LC3 puncta per cell (n=3 wells, 3 independent experiments, >50 cells per experiment). (f, g) Immunoblot for the indicated proteins of the immunoprecipitates (IP) of Atg16 from MEFs transfected with GFP-tagged full length (FL-) Cx43 or flag tagged C-terminus (CT-) Cx43 (f) or ΔCT258-Cx43 (g) I: input; FT: flow through. GAPDH and GFP alone were used as negative controls for IP and Atg5 as positive control. All values are mean+s.e.m. Differences with control were significant for (*, §) p<0.01. Bars: 5 μm. Uncropped images of blots are shown in Supplementary Fig. 9.
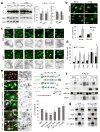
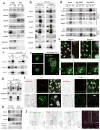
Figure 4. Cx43 internalization triggers mobilization of pre-autophagosomal structures from the plasma membrane and autophagosome biogenesis
(a) Immunoblots for the indicated proteins in mouse embryonic fibroblasts (MEFs) treated with tamoxifen (Tx) or lindane (Lnd) in the absence or presence of lysosomal protease inhibitors (PI). Right: Changes in LC3-II levels relative to those detected in untreated cells (n=4 independent experiments). (b) Immunofluorescence for Cx43 and LC3 in NRK cells treated as in a in the presence or absence of chloroquine (CQ) for 3h. Right: Quantification of the average number of LC3-positive puncta per cell (n= 3 wells, 3 independent experiments, >30 cells per experiment). (c) Time course of changes in the average LC3-positive puncta per cell after addition of Lnd to control NRK cells. (d) Fluorescence images of Wt or Cx43−/− MOBs transfected with mCherry-GFP-LC3 and incubated or not with Tx or Lnd. Bottom: Quantification of autophagolysosomes (n= 3 wells, 3 independent experiments, >50 cells per experiment). (e) Immunostaining for Atg16 and Cx43 in MEFs treated with the indicated compounds. Representative images as merged channels are shown. Right: quantification of the average of cytosolic Atg16-positive puncta per cell (n= 3 wells, 3 independent experiments, >30 cells per experiment). (f) Immunofluorescence for LC3 and Atg16 in NRK cells expressing GFP-Cx43 treated with Lnd and untreated. Single channel images in inverse black and white and merged color images are shown. Boxed areas are shown at higher magnification. Arrows: double (yellow) and triple (white) colocalization. (g, h) Immunostaining for Atg16 in Cx43 knocked down (−) (g) or knocked out (−/−) (h) cells. Right: quantification of the average of cytosolic Atg16 positive puncta per cell (n= 3 wells, 3 independent experiments, >50 cells per experiment). (i) Immunoblot for Atg16 and Atg14 in immunoprecipitates (IP) of endogenous Cx43 from MEFs wild type cells maintained in the absence of serum (4h) or incubated in presence of Tx or Lind. I: input; FT: flow through. All values are mean+s.e.m and differences with untreated cells are significant for (*) p<0.01. Bars: 5 μm. Uncropped images of blots are shown in Supplementary Fig. 9.
Figure 5. Internalized Cx43 is targeted to recycling endosomes during serum deprivation
(a–c) Immunofluorescence for the indicated endosomal markers in NRK cells expressing GFP-Cx43 maintained in presence of serum (a), absence of serum (b) or treated with lindane (c). Single black and white inverted channels, merged channels and higher magnification insets are shown. (d) Immunoblots for indicated proteins in isolated fractions from starved mouse liver HOM: homogenate; LE: late endosomes; CYT: cytosol; APG: autophagosomes; APL: autophagolysosomes. (e) Immunoblots for different connexins in homogenates and late endosomes isolated from fed and 6h starved mice. (f–h) Fluorescence images of NRK cells expressing GFP-Cx43 maintained in presence of serum (f), absence of serum (g) or treated with lindane (h) and incubated with Alexa594-transferrin for 15 minutes before fixation. Top: single and merged channels and boxed area at higher magnification. Bottom: 3D reconstructions and higher magnification details of the boxed areas. Nuclei are highlighted with DAPI. Bars: 5 μm. Uncropped images of blots are shown in Supplementary Fig. 9.
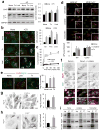
Figure 6. Atg14 is recruited to Cx43-enriched plasma membrane regions during nutritional deprivation
(a) Immunoblot for the indicated proteins in homogenates and purified plasma membrane from fed (F) and 24 h starved mice (Stv). Starvation-induced changes in the PM content relative to fed levels were as follows: Vps15 (1.2+0.2), Beclin-1 (0.7+0.5), Vps34 (0.9+0.1), Atg16 (1.1+0.3), Atg14 (2.5+0.2) and only Atg14 were significant for p<0.01. (b) Immunoblot of Cx43 immunoprecipitates (IP) in mouse embryonic fibroblasts (MEFs) maintained in the presence or absence of serum. I: input; FT: flow through. GAPDH is shown as negative control for IP. (c) Immunoblot of Cx43 IP in MEFs from Wt or Atg5−/− mice grown in serum-supplemented media. (d) Immunoblot of Cx43 IP in Wt or Atg16 knockdowns (KD) MEFs maintained in the presence/ absence of serum for 4h. (e) Co-staining for Atg14 and Cx43 in NRK cells maintained in presence/absence of serum. Merged channels are shown and single channels and broad field images are shown in Supplementary Fig. 5d. Insets: higher magnification. (f) Maximum intensity confocal microscopy 3D reconstruction in HeLa cells expressing EBFP2-Cx43 (pseudocolored in red) and EGFP-ATG14 followed by a single-plane time-lapse acquisition of the boxed area; cells were incubated in serum-deprived medium for 1h before imaging. (g) Immunoblot of Atg14 IP in Wt or Atg5−/− MEFs maintained in the presence of serum. (h) Immunoblot in total homogenates and plasma membrane (PM) purified from Wt or Cx43−/− mice. (i) Immunofluorescence for e-cadherin and Vps34 in NRK cells wild-type (Wt) or knocked down (−) for Cx43. Single channel and merge (left) and Z-stack surface reconstruction and higher magnification of the boxed region (right). (j) Immunostaining for Cx43 and e-cadherin in NRK cells expressing a tandem FYVE domain (2xFYVE) tagged to GFP and maintained in serum-free media for 4h. Single channels (inverted black and white) and the merged image of the boxed area (color). Inset: higher magnification image. Bars: 5 μm. Uncropped images of blots are shown in Supplementary Fig. 9.
Figure 7. Cx43 modulates formation of pre-autophagosomal structures through direct interaction with autophagy-related proteins
(a) Co-immunostaining for Cx43 and the indicated Atgs in NRK cells maintained in the presence or absence of serum (top). Single and merged channels of the 3D reconstruction of the boxed regions are shown (bottom). Nuclei are highlighted with DAPI. (b, c) Immunoblot for the indicated proteins of immunoprecipitates (IP) of Cx43 in NRK cells maintained in the presence or absence of serum (b) or treated or not with 3-methyladenine (c) Atg5 is shown as negative control for IP. (d) Co-staining for Atg9 and e-cadherin in NRK cells control and knocked down for Cx43. Single and merged channels at higher magnification areas are shown. (e) Immunofluorescence for endogenous Atg9 and Cx43 in NRK cells control or knocked down for Eps15. (f, g) Immunofluorescence for endogenous Cx43 (green) in NRK cells control or knocked down for Atg14 (f) or Atg9 (g) maintained in the presence or absence of serum. (h) Immunofluorescence of endogenous Cx43 in NRK cells control or knocked down for Atg14 treated (or not) with Tx or Lnd (left). e-cadherin staining (red) is shown to highlight plasma membrane in g and h. Full fields are shown in Supplementary Fig. 6h. Quantification of intracytoplasmic Cx43-positives vesicles (right) (n= 3 wells, 3 independent experiments, >30 cells per experiment). Values are mean+s.e.m and significant for (*) p<0.01 using ANOVA+Bonferroni test. Bars: 5 μm. Uncropped images of blots are shown in Supplementary Fig. 9.
Figure 8. Depletion of connexins induces autophagosome formation
(a) Immunoblot for the indicated proteins in mouse embryonic fibroblasts (MEFs) control or knocked down (−) for the three different connexins. (b) Immunofluorescence of LC3 in MEFs control (Ctr) or knocked down (−) for three different Cx maintained in the presence or absence of serum. Left: representative fields and higher magnification insets. Nuclei are highlighted with DAPI. Right: Quantification of the average number of LC3-positive puncta per cell (n= 3 wells, 3 independent experiments, >50 cells per experiment). (c) Immunoblot for LC3 in the same cells maintained in the presence of serum untreated (−) or treated with inhibitors of lysosomal proteases (PI) for the indicated times. GAPDH is shown as loading control. (d) Representative images of MEFs control or knocked-down (−) for the indicated proteins transfected with the mCherry-GFP-LC3 tandem reporter. Right: quantification of the average number per cell of puncta positive for GFP and mCherry (autophagosomes; APG) and those positive only for mCherry (autophagolysosomes; APL) (n= 3 wells, 3 independent experiments, >50 cells per experiment). (e) Electron micrographs of MEFs control or knock-down for the indicated Cx. Insets show autophagic vesicles. Bottom: Quantification of the average number of AV (left) and percentage of cytosolic area (right) occupied by AVs (n= 4 wells, 4 independent experiments, >10 micrographs per well). (f) Immunoblot for indicated proteins in immunoprecipitates (IP) for Cx26 or Cx32 (left) or Atg16 (right) from liver homogenates. Inp: input, FT: flow through. BIP is shown as negative control for IP. All values are mean+s.e.m and significant for (*) p<0.01 (ANOVA+Bonferroni test was used in b). Bars: 5 μm in fluorescence images; 1 μm and 0.1 μm in top panels and inserts of e. Uncropped images of blots are shown in Supplementary Fig. 9.
Similar articles
- NRBF2 regulates macroautophagy as a component of Vps34 Complex I.
Cao Y, Wang Y, Abi Saab WF, Yang F, Pessin JE, Backer JM. Cao Y, et al. Biochem J. 2014 Jul 15;461(2):315-22. doi: 10.1042/BJ20140515. Biochem J. 2014. PMID: 24785657 Free PMC article. - WIPI proteins: essential PtdIns3P effectors at the nascent autophagosome.
Proikas-Cezanne T, Takacs Z, Dönnes P, Kohlbacher O. Proikas-Cezanne T, et al. J Cell Sci. 2015 Jan 15;128(2):207-17. doi: 10.1242/jcs.146258. J Cell Sci. 2015. PMID: 25568150 Review. - RACK1 Promotes Autophagy by Enhancing the Atg14L-Beclin 1-Vps34-Vps15 Complex Formation upon Phosphorylation by AMPK.
Zhao Y, Wang Q, Qiu G, Zhou S, Jing Z, Wang J, Wang W, Cao J, Han K, Cheng Q, Shen B, Chen Y, Zhang WJ, Ma Y, Zhang J. Zhao Y, et al. Cell Rep. 2015 Nov 17;13(7):1407-1417. doi: 10.1016/j.celrep.2015.10.011. Epub 2015 Nov 5. Cell Rep. 2015. PMID: 26549445 - Nrbf2 protein suppresses autophagy by modulating Atg14L protein-containing Beclin 1-Vps34 complex architecture and reducing intracellular phosphatidylinositol-3 phosphate levels.
Zhong Y, Morris DH, Jin L, Patel MS, Karunakaran SK, Fu YJ, Matuszak EA, Weiss HL, Chait BT, Wang QJ. Zhong Y, et al. J Biol Chem. 2014 Sep 19;289(38):26021-26037. doi: 10.1074/jbc.M114.561134. Epub 2014 Aug 1. J Biol Chem. 2014. PMID: 25086043 Free PMC article. - Overview of macroautophagy regulation in mammalian cells.
Mehrpour M, Esclatine A, Beau I, Codogno P. Mehrpour M, et al. Cell Res. 2010 Jul;20(7):748-62. doi: 10.1038/cr.2010.82. Epub 2010 Jun 15. Cell Res. 2010. PMID: 20548331 Review.
Cited by
- Interplay Between Lipid Metabolism and Autophagy.
Xie Y, Li J, Kang R, Tang D. Xie Y, et al. Front Cell Dev Biol. 2020 Jun 3;8:431. doi: 10.3389/fcell.2020.00431. eCollection 2020. Front Cell Dev Biol. 2020. PMID: 32582708 Free PMC article. Review. - RAB30 regulates PI4KB (phosphatidylinositol 4-kinase beta)-dependent autophagy against group A Streptococcus.
Nakajima K, Nozawa T, Minowa-Nozawa A, Toh H, Yamada S, Aikawa C, Nakagawa I. Nakajima K, et al. Autophagy. 2019 Mar;15(3):466-477. doi: 10.1080/15548627.2018.1532260. Epub 2018 Oct 18. Autophagy. 2019. PMID: 30290718 Free PMC article. - Gap Junction-Dependent and -Independent Functions of Connexin43 in Biology.
Zhu Y. Zhu Y. Biology (Basel). 2022 Feb 11;11(2):283. doi: 10.3390/biology11020283. Biology (Basel). 2022. PMID: 35205149 Free PMC article. Review. - Autophagy mediated CoCrMo particle-induced peri-implant osteolysis by promoting osteoblast apoptosis.
Wang Z, Liu N, Liu K, Zhou G, Gan J, Wang Z, Shi T, He W, Wang L, Guo T, Bao N, Wang R, Huang Z, Chen J, Dong L, Zhao J, Zhang J. Wang Z, et al. Autophagy. 2015;11(12):2358-69. doi: 10.1080/15548627.2015.1106779. Autophagy. 2015. PMID: 26566231 Free PMC article.
References
- Mizushima N, Yoshimori T, Ohsumi Y. The role of Atg proteins in autophagosome formation. Annu Rev Cell Dev Biol. 2011;27:107–132. - PubMed
Publication types
MeSH terms
Substances
Grants and funding
- R01 AG021904/AG/NIA NIH HHS/United States
- P01 DK041918/DK/NIDDK NIH HHS/United States
- AG031782/AG/NIA NIH HHS/United States
- R37 AG021904/AG/NIA NIH HHS/United States
- AG038072/AG/NIA NIH HHS/United States
- UL1 TR001073/TR/NCATS NIH HHS/United States
- P30 AG038072/AG/NIA NIH HHS/United States
- R01 AR057139/AR/NIAMS NIH HHS/United States
- R01 DK098408/DK/NIDDK NIH HHS/United States
- P01 AG031782/AG/NIA NIH HHS/United States
- DK041018/DK/NIDDK NIH HHS/United States
- 5T32NS007439/NS/NINDS NIH HHS/United States
- T32 NS007439/NS/NINDS NIH HHS/United States
- P30 DK041296/DK/NIDDK NIH HHS/United States
- R01 DK021860/DK/NIDDK NIH HHS/United States
LinkOut - more resources
Full Text Sources
Other Literature Sources
Molecular Biology Databases
Research Materials
Miscellaneous
