TP53 supports basal-like differentiation of mammary epithelial cells by preventing translocation of deltaNp63 into nucleoli - PubMed (original) (raw)
TP53 supports basal-like differentiation of mammary epithelial cells by preventing translocation of deltaNp63 into nucleoli
Pauliina M Munne et al. Sci Rep. 2014.
Abstract
Multiple observations suggest a cell type-specific role for TP53 in mammary epithelia. We developed an in vitro assay, in which primary mouse mammary epithelial cells (mMECs) progressed from lumenal to basal-like phenotypes based on expression of Krt18 or ΔNp63, respectively. Such transition was markedly delayed in Trp53(-/-) mMECs suggesting that Trp53 is required for specification of the basal, but not lumenal cells. Evidence from human basal-like cell lines suggests that TP53 may support the activity of ΔNp63 by preventing its translocation from nucleoplasm into nucleoli. In human lumenal cells, activation of TP53 by inhibiting MDM2 or BRCA1 restored the nucleoplasmic expression of ΔNp63. Trp53(-/-) mMECs eventually lost epithelial features resulting in upregulation of MDM2 and translocation of ΔNp63 into nucleoli. We propose that TP63 may contribute to TP53-mediated oncogenic transformation of epithelial cells and shed light on tissue- and cell type-specific biases observed for TP53-related cancers.
Figures
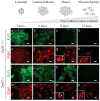
Figure 1. Loss of Trp53 in mMECs cultured in adhesive conditions delays their transition from a luminal to basal-like phenotype.
Freshly isolated Trp53+/+ (a–h) and Trp53−/− (i–p) primary mMECs were cultured in plastic dishes and sampled every three days. (a–d, i–l) Luminal differentiation was monitored by immunofluorescence staining for cytokeratin 18 (Krt18, green). (e–h, m–p) Basal differentiation was monitored by staining for ΔNp63 (red). Insets in (g, h, o, and p) demonstrate selected nuclei at a higher magnification. Arrowheads indicate ΔNp63 excluded from nucleoli. Arrows show ΔNp63 located in nucleoli. Scale bars correspond to 20 μm.
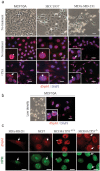
Figure 2. Trp53−/− mMECs acquire mesenchymal features in vitro.
(a) Expression of a mesenchymal marker Vimentin increases, while that of epithelial keratins (Krt18 and Krt14) decreases with time, when mMEC cultures at 6 days and 4 weeks were compared using qRT-PCR. The bar plot shows the mRNA expression as a fold change relative to wild type mMECs. (b) Phase contrast images illustrate a spindle-shaped morphology of primary Trp53−/− mMECs (middle) in contrast to a tight epithelial sheet of wild type mMECs (left). Extensively passaged Trp53−/− mMECs morphologically resemble fibroblasts (right). Scale bars correspond to 100 μm.
Figure 3. Nucleolar localization of ΔNp63 correlates with EMT and functional inactivation.
(a) Phase contrast images (upper row) demonstrate an epithelial cobblestone-like (MCF10A and HCC1937) and mesenchymal (MDA-MB-231) morphology of human basal mammary cell lines. In cobblestone-like cells, ΔNp63 is excluded from nucleoli (arrowheads, second row). In mesenchymal-like cells, ΔNp63 is found in nucleoli (arrow). Functional inactivation of ΔNp63 using HDAC1 inhibitor trichostatin A (+TSA, third row) leads to a relocation of ΔNp63 into nucleoli in all cell lines. (b) MCF10A cells plated at a low density spontaneously undergo EMT and demonstrate a mesenchymal morphology. In these cells ΔNp63 is found predominantly in nucleoli (arrows). Insets demonstrate higher power views of selected cells in corresponding samples. (c) Co-staining of ΔNp63 with a nucleolar marker nucleophosmin (NPM) showing a nucleolar localization of ΔNp63 protein in MDA-MB-231, MCF7 and TP53−/− MCF10A cells, but not the parental MCF10A cells. Red, ΔNp63; blue, DAPI. Scale bars correspond to 20 μm in (a–b), and 10 μm in (c).
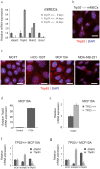
Figure 4. TP53 and ΔNp63 negatively regulate TAp63.
(a) mRNA expression was measured using qRT-PCR in Trp53−/− and wild type mMECs cultured for 14 days. Values represent fold changes relative to wild type mMECs. Notice a sharp increase in TAp63 in Trp53−/− mMECs. (b) Immunofluorescence staining of immortalized Trp53−/− mMECs showing a nucleolar localization of TAp63 isoform (red). Nuclei are counterstained with DAPI shown in blue. (c) TAp63 is detected in nucleoli in all tested stable mammary epithelial cell lines. (d) qRT-PCR showing a 36-fold increase in the mRNA level of TAp63 in MCF10A cells after ΔNp63 was inhibited using TSA treatment. (e) qRT-PCR showing a two-fold increase in expression of TAp63 in isogenic TP53−/− compared with its parental TP53+/+ MCF10A cell line. (f–g) qRT-PCR showing a negative regulation of TAp63 by ΔNp63 in TP53+/+ MCF10A cells (f), and their mutual suppression in TP53−/− MCF10A cells (g). Scale bars correspond to 20 μm.
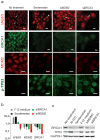
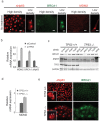
Figure 5. ΔNp63 is suppressed by MDM2 and BRCA1 in lumenal MCF7 cells.
(a) Immunofluorescence showing the ΔNp63 protein (top row) in MCF7 cells treated as indicated above. BRCA1 protein (second row) is readily detectable in control cells, but disappears after treatments promoting expression of ΔNp63. MDM2 protein (third row) correlates with the expression of BRCA1. (b) qRT-PCR showing fold change in mRNA levels for ΔNp63, MDM2, and BRCA1 following treatments indicated above. (c) Western blot confirming an effective reduction of BRCA1 protein level and stabilization of the TP53 protein after treatments indicated above. F12, cells were cultured in DMEM/F12 medium instead of the regular DMEM; Serdemetan, cells treated with MDM2 inhibitor as described in Materials and Methods; siBRCA1 and siMDM2, cells treated with siRNAs targeting corresponding genes. Scale bars correspond to 20 µm.
Figure 6. TP53 and ΔNp63 negatively regulate MDM2 and BRCA1 in basal-like cells.
(a) Untreated MCF10A cells express high levels of ΔNp63, and low levels of BRCA1 and MDM2. Cells plated at a low density translocate ΔNp63 to nucleoli, and elevate expression of BRCA1, and MDM2. (b) Knockdown of TP63 (siTP63) results in upregulation of BRCA1 and MDM2. (c) Western blot confirming an efficient siRNA-mediated knockdown of BRCA1 and ΔNp63 proteins, and lack of TP53 in TP53−/− MCF10A cells. Notice a higher level of ΔNp63 protein in BRCA1-depleted TP53-mutant cells. Asterisk indicates a 75 kDa band from a molecular weight marker loaded in the same lane as the siMDM2 sample. (d) TP53-deficiency in MCF10A cells leads to an increase in MDM2 mRNA level as measured by qRT-PCR. (e) Immunofluorescence staining of TP53−/− and its parental isogenic TP53+/+ MCF10A cell lines demonstrates a ubiquitous relocation of ΔNp63 protein from the nucleoplasm in TP53+/+ cells (arrowheads) to nucleoli in TP53−/− cells (arrows), and upregulation of BRCA1 in TP53−/− cells. Insets illustrate the differences at a higher magnification. Scale bars correspond to 20 µm.
Figure 7. Inhibition of TAp63, BRCA1, or MDM2 in TP53−/− cells restores the nucleoplasmic localization of ΔNp63.
Isogenic TP53+/+ or TP53−/− MCF10A cells were co-stained for ΔNp63 (red) and NPM (nucleophosmin, green) to reveal their distribution relative to nucleoli after siRNA treatments indicated above. Yellow frames highlight a suppressed state of ΔNp63. Notice that in these cells ΔNp63 is found in nucleoli as well as in the nucleoplasm, and NPM is almost evenly distributed within nucleoli (arrows). Knockdown of TAp63 and others restores a nucleolar exclusion of ΔNp63 and a peripheral distribution of NPM within nucleoli (arrowheads).
Figure 8. Model describing the role of TP53 in mammary epithelia.
TP53 prevents translocation of ΔNp63 from the nucleoplasm into nucleoli. Active TP53 and a nucleoplasmic ΔNp63 inversely correlate with MDM2, BRCA1, and TAp63. MDM2 and BRCA1 in luminal cells inhibit TP53, thus preventing the nucleoplasmic expression of ΔNp63 and suppressing the basal-like differentiation. Loss of TP53 leads to an upregulation of TAp63, which is associated with an unlimited cell proliferation rather than a particular epithelial subtype. Relocation of ΔNp63 to nucleoli in basal epithelial cells is associated with EMT.
Similar articles
- The downregulation of ΔNp63 in p53-deficient mouse epidermal tumors favors metastatic behavior.
Bornachea O, López-Calderón FF, Dueñas M, Segrelles C, Lorz C, Suárez-Cabrera C, Marañón M, Paradela-Dobarro B, Santos M, Paramio JM. Bornachea O, et al. Oncotarget. 2015 Sep 15;6(27):24230-45. doi: 10.18632/oncotarget.4353. Oncotarget. 2015. PMID: 26203771 Free PMC article. - The expression of TA and DeltaNp63 are regulated by different mechanisms in liver cells.
Petitjean A, Cavard C, Shi H, Tribollet V, Hainaut P, Caron de Fromentel C. Petitjean A, et al. Oncogene. 2005 Jan 13;24(3):512-9. doi: 10.1038/sj.onc.1208215. Oncogene. 2005. PMID: 15543231 - Antagonistic roles of Notch and p63 in controlling mammary epithelial cell fates.
Yalcin-Ozuysal O, Fiche M, Guitierrez M, Wagner KU, Raffoul W, Brisken C. Yalcin-Ozuysal O, et al. Cell Death Differ. 2010 Oct;17(10):1600-12. doi: 10.1038/cdd.2010.37. Epub 2010 Apr 9. Cell Death Differ. 2010. PMID: 20379195 - The Mdm network and its regulation of p53 activities: a rheostat of cancer risk.
Eischen CM, Lozano G. Eischen CM, et al. Hum Mutat. 2014 Jun;35(6):728-37. doi: 10.1002/humu.22524. Epub 2014 Mar 6. Hum Mutat. 2014. PMID: 24488925 Free PMC article. Review. - TP53 family members and human cancers.
Bénard J, Douc-Rasy S, Ahomadegbe JC. Bénard J, et al. Hum Mutat. 2003 Mar;21(3):182-91. doi: 10.1002/humu.10172. Hum Mutat. 2003. PMID: 12619104 Review.
Cited by
- p53 controls the plasticity of mammary luminal progenitor cells downstream of Met signaling.
Chiche A, Di-Cicco A, Sesma-Sanz L, Bresson L, de la Grange P, Glukhova MA, Faraldo MM, Deugnier MA. Chiche A, et al. Breast Cancer Res. 2019 Jan 25;21(1):13. doi: 10.1186/s13058-019-1101-8. Breast Cancer Res. 2019. PMID: 30683141 Free PMC article. - Rad51c- and Trp53-double-mutant mouse model reveals common features of homologous recombination-deficient breast cancers.
Tumiati M, Munne PM, Edgren H, Eldfors S, Hemmes A, Kuznetsov SG. Tumiati M, et al. Oncogene. 2016 Sep 1;35(35):4601-10. doi: 10.1038/onc.2015.528. Epub 2016 Jan 25. Oncogene. 2016. PMID: 26820992 - Role of epithelial mesenchymal transition in prostate tumorigenesis.
Khan MI, Hamid A, Adhami VM, Lall RK, Mukhtar H. Khan MI, et al. Curr Pharm Des. 2015;21(10):1240-8. doi: 10.2174/1381612821666141211120326. Curr Pharm Des. 2015. PMID: 25506896 Free PMC article. Review. - Transcriptional profiling of swine mammary gland during the transition from colostrogenesis to lactogenesis using RNA sequencing.
Palombo V, Loor JJ, D'Andrea M, Vailati-Riboni M, Shahzad K, Krogh U, Theil PK. Palombo V, et al. BMC Genomics. 2018 May 3;19(1):322. doi: 10.1186/s12864-018-4719-5. BMC Genomics. 2018. PMID: 29724161 Free PMC article. - Multi-Omics Characterization of Tumor Microenvironment Heterogeneity and Immunotherapy Resistance Through Cell States-Based Subtyping in Bladder Cancer.
Hu R, Tao T, Yu L, Ding Q, Zhu G, Peng G, Zheng S, Yang L, Wu S. Hu R, et al. Front Cell Dev Biol. 2022 Feb 9;9:809588. doi: 10.3389/fcell.2021.809588. eCollection 2021. Front Cell Dev Biol. 2022. PMID: 35223867 Free PMC article.
References
- Vousden K. H. & Prives C. Blinded by the Light: The Growing Complexity of p53. Cell 137, 413–431 (2009). - PubMed
- Flores E. R. et al. Tumor predisposition in mice mutant for p63 and p73: evidence for broader tumor suppressor functions for the p53 family. Cancer Cell 7, 363–373 (2005). - PubMed
- Jacks T. et al. Tumor spectrum analysis in p53-mutant mice. Curr Biol 4, 1–7 (1994). - PubMed
- Jerry D. J. et al. Delayed involution of the mammary epithelium in BALB/c-p53null mice. Oncogene 17, 2305–2312 (1998). - PubMed
Publication types
MeSH terms
Substances
LinkOut - more resources
Full Text Sources
Other Literature Sources
Molecular Biology Databases
Research Materials
Miscellaneous
