Expression patterns and subcellular localization of carbonic anhydrases are developmentally regulated during tooth formation - PubMed (original) (raw)
Expression patterns and subcellular localization of carbonic anhydrases are developmentally regulated during tooth formation
Claes-Göran Reibring et al. PLoS One. 2014.
Abstract
Carbonic anhydrases (CAs) play fundamental roles in several physiological events, and emerging evidence points at their involvement in an array of disorders, including cancer. The expression of CAs in the different cells of teeth is unknown, let alone their expression patterns during odontogenesis. As a first step towards understanding the role of CAs during odontogenesis, we used immunohistochemistry, histochemistry and in situ hybridization to reveal hitherto unknown dynamic distribution patterns of eight CAs in mice. The most salient findings include expression of CAII/Car2 not only in maturation-stage ameloblasts (MA) but also in the papillary layer, dental papilla mesenchyme, odontoblasts and the epithelial rests of Malassez. We uncovered that the latter form lace-like networks around incisors; hitherto these have been known to occur only in molars. All CAs studied were produced by MA, however CAIV, CAIX and CARPXI proteins were distinctly enriched in the ruffled membrane of the ruffled MA but exhibited a homogeneous distribution in smooth-ended MA. While CAIV, CAVI/Car6, CAIX, CARPXI and CAXIV were produced by all odontoblasts, CAIII distribution displayed a striking asymmetry, in that it was virtually confined to odontoblasts in the root of molars and root analog of incisors. Remarkably, from initiation until near completion of odontogenesis and in several other tissues, CAXIII localized mainly in intracellular punctae/vesicles that we show to overlap with LAMP-1- and LAMP-2-positive vesicles, suggesting that CAXIII localizes within lysosomes. We showed that expression of CAs in developing teeth is not confined to cells involved in biomineralization, pointing at their participation in other biological events. Finally, we uncovered novel sites of CA expression, including the developing brain and eye, the olfactory epithelium, melanoblasts, tongue, notochord, nucleus pulposus and sebaceous glands. Our study provides important information for future single or multiple gene targeting strategies aiming at deciphering the function of CAs during odontogenesis.
Conflict of interest statement
Competing Interests: The authors have declared that no competing interests exist.
Figures
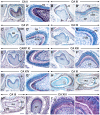
Figure 1. CA XIII, Car2 and Car6 distribution during early tooth development.
Sections from E12.5 (A), E13.5 (B) and E14.5 (C–E) embryo heads at the levels of developing first molar at the placodal (A), bud (B) and cap (C–E) stages. Mandibular (A–C, E) and maxillary (D) molar sections. Sections of third molars at 12 dpp at the level of their less differentiated cusps (F–G’). Immunostaing showing CA XIII distribution (A–C). Dark magenta color indicates the sites of immunostaining. CA XIII appears as intracellular punctae. In situ hybridization showing expression of Car2 (D, F, F’) and Car6 (E, G, G’). Signals appear as shiny dots in dark-field images (F’, G’). Bright-field images (D, E, F, G). Robust signals appear as black silver grains in bright-field images. In addition to the dental mesenchyme, the mesenchyme at the periphery of the tooth expresses Car2 (arrow in D). Abbreviations: DE, dental epithelium; DM, dental mesenchyme; IDE, inner dental epithelium; ODE, outer dental epithelium; OC, osteoclasts; SR, stellate reticulum. Scale bars: 50 µm (A–C), 100 µm (D, E), 200 µm (F, F’, G, G’).
Figure 2. Carbonic anhydrase distribution during the bell/cytodifferentiation stage of odontogenesis.
Sections of first molars at 1 dpp (A–G’) and posterior segments of incisors at 12 dpp (H–I”) after immunostaining for the different carbonic anhydrases as indicated on the panels. Dark magenta color indicates the sites of immunoreactivities. The dental papilla mesenchyme and newly differentiated odontoblasts (nOd) show robust CA II staining. CA III is asymmetrically expressed in incisors (H–H”). The arrow in H points at the first odontoblasts that differentiate in the root analog of the incisor which initiate robust expression of CA III. CA VI, CARP XI and CA XIV are expressed in preameloblasts and newly differentiated odontoblasts but not in the dental papilla mesenchyme. Intracytoplasmic punctae/vesicles show strong CA XIII immunostaining (F, F’, I–I”). A’, B’, C’, D’, E’, F’, G’ and I’ are high magnification views of A, B, C, D, E, F, G and I, respectively. I’’ is a high magnification view of I’. Abbreviations: B, alveolar bone; CA, crown analog part of the incisor; DP, dental papilla mesenchyme; Od, odontoblasts, ODE, outer dental epithelium; PA, preameloblasts; RA, root analog part of the incisor; SR, stellate reticulum; SI, stratum intermedium. Scale bars: 200 µm (A–I), 50 µm (A’–G’, I’), 20 µm (I”).
Figure 3. CA distribution patterns in postnatal molars at the maturation stage of enamel formation.
Immunohistochemistry (IHC) showing the distribution patterns (Magenta color) of CA II, CA III, CA IV and CA VI as indicated on the panels. Ruffle-ended (RMA in B, F, N) and smooth-ended (SMA in C, G, O) maturation-stage ameloblasts show robust immunostaining representing CA II, CA III and CA VI. CA IV (J) is enriched in the ruffled border of the RMA whereas the SMA exhibit a homogeneous CA IV staining (K). CA II (D), CA IV (L) and CA VI (P) immunostaining of odontoblasts (Od). Odontoblasts in the root (arrows in E and H) display strong staining portraying CA III, whereas their crown counterparts display nearly background levels of immunostaining (arrowheads in E and H). The occlusal outer dental epithelium displays strong staining for CA III (red cercle in E). The papillary layer (PL) adjacent to both RMA and SMA display strong CA II immunostaining (B, C). The PL adjacent to the RMA (F) shows stronger staining for CA III than the PL adjacent to the SMA (G). Images in B, D F, H J, K, L, N and P are high magnification views of the areas indicated in A, E, I and M, respectively. Because some sections of molars at the maturation stage of enamel formation do not always comprise SMA, the images shown in C, G and O are taken either from the same molar, but a few sections away or from a section of another molar after IHC under the same conditions. Additional abbreviations: B, bone; ERM, epithelial rests of Malassez; PD, predentin/dentin; TA, transition-stage ameloblasts. Scale bars: 200 µm (A, E, I, M), 20 µm (B–D, F–H, J–L, N–P).
Figure 4. CA immunohistochemistry in postnatal molars at the maturation stage of enamel formation.
Immunohistochemistry showing the distribution patterns of CARP XI, CA IX, CA XIII and CA XIV in sections of molars at 12 dpp as indicated on the panels. The latter three isoforms were detected with the Goat anti-CA IX, rabbit anti-mouse CA XIII antiserum and goat anti-CA XIV. CA IX (B) and CARP XI (F) are enriched in the ruffled border of ruffle-ended maturation-stage ameloblasts (RMA). Smooth-ended maturation-stage ameloblasts (SMA) exhibit a homogeneous staining portraying CA IX (C) and CARP XI (G). CA XIV immunostaining is homogeneous in RMA (N) and SMA (O). Odontoblasts (Od) express CA IX (D), CARP XI (H) and CA XIV (P). CA XIII immunostaining is strong in intracytoplasmic punctae/vesicles in the papillary layer (PL), RMA and SMA (J, K) as well as in odontoblasts, including the site of emergence of their processes (L). Because not all molar sections include SMA, the images in C and O were taken from other sections of the molars that have been processed for IHC under the same conditions. Images in B, D, F–H, J–L, N and P are high magnification views of the indicated areas in A, E, I and M, respectively. Additional abbreviations: DP, dental pulp mesenchyme, PD, predentin/dentin; TA, transition-stage ameloblasts. Scale bars: 200 µm (A, E, I, M), 20 µm (B–D, F–H, J–L, N–P).
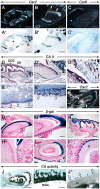
Figure 5. In situ hybridization, immunohistochemistry and histochemistry in postnatal teeth.
In situ hybridization (ISH) showing expression of Car2 (A, A’, B, B’) and Car6 (C, C’) in sections at the level of roots from first molars and Car2 in a sagittal section of a maxillary incisor (arrow in F). Signals in dark-field views appear as shiny dots (A–C, F) and robust signals appear as black dots in bright-field images (A’–C’). The epithelial rests of Malassez (ERM; arrows) are _Car2_-positive (B, B’) and in the incisor they display a lace-like network (F). Asterisk in A’ indicates an artifact subsequent to loss of dental pulp mesenchyme during processing. Immunoshistochemistry showing CA II-positive (dark magenta color) ERM (arrows) along the first molar’s root surface (D–D”). The ERM (arrows) form a CA-II-positive (E, E’) lace-like network at the surface of the incisor’s root analog as shown in a section tangential to the surface of the tooth. The ERM (arrows) are visualized by β-galactosidase histochemistry (dark blue color) in sagittal (G–H’) and transversal (I, I’) sections of molars (H, H’) and incisors (G, G’, I, I’) from K14-Cre; R26R reporter mice. The β–positive ERM form a lace-like network (G, G’). Histochemistry visualizing CA activity (blackish color) in ruffle-ended maturation-stage ameloblasts (RMA), the papillary layer (PL) as well as in the ERM (arrows) in an incisor’s section (J–J”). Images in BB’ and D’ are high magnification views of areas in AA’ and D, respectively. Images in D”, E’, G’, H’, I’, J’ and J” are high magnification views of areas in D’, E, G, H, I and J, respectively. Additional abbreviations: B, bone/bone marrow; ODE, outer dental epithelium; OC, osteoclasts; SR, stellate reticulum. Scale bars: 500 µm (AA’, D, F, G, H), 200 µm (B, B’, C;C’, D’, E, G’, I, J), 50 µm (D”, I’, J’, J”).
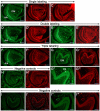
Figure 6. Immunofluorescence showing the distribution of CA XIII, LAMP-1 and LAMP-2 in developing teeth.
Images of sections of incisors (A–F’; H, H’) and molars (G, G’, I, I’) at 1 dpp. Incisor sections after single immunostaining showing CA XIII (green fluorescence (GF) in A), LAMP-1 (red fluorescence (RF) in B) and LAMP-2 (RF in C). Incisor sections after double immunostaining showing CA XIII (GF in D) and LAMP-1 (RF in D’) or CA XIII (GF in E) and LAMP-2 (RF in E’). Incisor and molar sections after triple immunostaining showing CA XIII (GF in F and G) and LAMP-1+ LAMP-2 (RF in F’ and G’). Negative controls processed without the primary antibodies (H, H’, I, I’). The GF and RF spots are artifacts due to autofluorescence of red blood cells, somes areas in preameloblasts (PA) as well as areas with tissue folds. G”, G’’’, I” and I”’ are high magnifications views of areas in G, G’, I and I’, respectively. Abbreviations: Am, differentiating ameloblasts; DM, dental papilla mesenchyme. Scale bars: 200 µm (G–G’, I, I’), 100 µm (A–F’, H, H’, G”, G”’, I”, I”’).
Similar articles
- Associations of FGF-3 and FGF-10 with signaling networks regulating tooth morphogenesis.
Kettunen P, Laurikkala J, Itäranta P, Vainio S, Itoh N, Thesleff I. Kettunen P, et al. Dev Dyn. 2000 Nov;219(3):322-32. doi: 10.1002/1097-0177(2000)9999:9999<::AID-DVDY1062>3.0.CO;2-J. Dev Dyn. 2000. PMID: 11066089 - Expression and localization of laminin-5 subunits during mouse tooth development.
Yoshiba K, Yoshiba N, Aberdam D, Meneguzzi G, Perrin-Schmitt F, Stoetzel C, Ruch JV, Lesot H. Yoshiba K, et al. Dev Dyn. 1998 Feb;211(2):164-76. doi: 10.1002/(SICI)1097-0177(199802)211:2<164::AID-AJA5>3.0.CO;2-F. Dev Dyn. 1998. PMID: 9489770 - Developmentally regulated expression of intracellular Fgf11-13, hormone-like Fgf15 and canonical Fgf16, -17 and -20 mRNAs in the developing mouse molar tooth.
Kettunen P, Furmanek T, Chaulagain R, Kvinnsland IH, Luukko K. Kettunen P, et al. Acta Odontol Scand. 2011 Nov;69(6):360-6. doi: 10.3109/00016357.2011.568968. Epub 2011 Mar 30. Acta Odontol Scand. 2011. PMID: 21449687 - Tissue Interactions Regulating Tooth Development and Renewal.
Balic A, Thesleff I. Balic A, et al. Curr Top Dev Biol. 2015;115:157-86. doi: 10.1016/bs.ctdb.2015.07.006. Epub 2015 Oct 6. Curr Top Dev Biol. 2015. PMID: 26589925 Review. - The role of carbonic anhydrases in renal physiology.
Purkerson JM, Schwartz GJ. Purkerson JM, et al. Kidney Int. 2007 Jan;71(2):103-15. doi: 10.1038/sj.ki.5002020. Epub 2006 Dec 13. Kidney Int. 2007. PMID: 17164835 Review.
Cited by
- G protein-coupled receptor Gpr115 (Adgrf4) is required for enamel mineralization mediated by ameloblasts.
Chiba Y, Yoshizaki K, Saito K, Ikeuchi T, Iwamoto T, Rhodes C, Nakamura T, de Vega S, Morell RJ, Boger ET, Martin D, Hino R, Inuzuka H, Bleck CKE, Yamada A, Yamada Y, Fukumoto S. Chiba Y, et al. J Biol Chem. 2020 Nov 6;295(45):15328-15341. doi: 10.1074/jbc.RA120.014281. Epub 2020 Aug 31. J Biol Chem. 2020. PMID: 32868297 Free PMC article. - Functional Involvement of Carbonic Anhydrase in the Lysosomal Response to Cadmium Exposure in Mytilus galloprovincialis Digestive Gland.
Caricato R, Giordano ME, Schettino T, Lionetto MG. Caricato R, et al. Front Physiol. 2018 Apr 4;9:319. doi: 10.3389/fphys.2018.00319. eCollection 2018. Front Physiol. 2018. PMID: 29670538 Free PMC article. - Assessment of databases to determine the validity of β- and γ-carbonic anhydrase sequences from vertebrates.
Zolfaghari Emameh R, Kuuslahti M, Nosrati H, Lohi H, Parkkila S. Zolfaghari Emameh R, et al. BMC Genomics. 2020 May 11;21(1):352. doi: 10.1186/s12864-020-6762-2. BMC Genomics. 2020. PMID: 32393172 Free PMC article. - Genome-wide analysis of dental caries and periodontitis combining clinical and self-reported data.
Shungin D, Haworth S, Divaris K, Agler CS, Kamatani Y, Keun Lee M, Grinde K, Hindy G, Alaraudanjoki V, Pesonen P, Teumer A, Holtfreter B, Sakaue S, Hirata J, Yu YH, Ridker PM, Giulianini F, Chasman DI, Magnusson PKE, Sudo T, Okada Y, Völker U, Kocher T, Anttonen V, Laitala ML, Orho-Melander M, Sofer T, Shaffer JR, Vieira A, Marazita ML, Kubo M, Furuichi Y, North KE, Offenbacher S, Ingelsson E, Franks PW, Timpson NJ, Johansson I. Shungin D, et al. Nat Commun. 2019 Jun 24;10(1):2773. doi: 10.1038/s41467-019-10630-1. Nat Commun. 2019. PMID: 31235808 Free PMC article. - Evidence for Bicarbonate Secretion by Ameloblasts in a Novel Cellular Model.
Bori E, Guo J, Rácz R, Burghardt B, Földes A, Kerémi B, Harada H, Steward MC, Den Besten P, Bronckers AL, Varga G. Bori E, et al. J Dent Res. 2016 May;95(5):588-96. doi: 10.1177/0022034515625939. Epub 2016 Jan 20. J Dent Res. 2016. PMID: 26792171 Free PMC article.
References
- Pastorekova S, Parkkila S, Pastorek J, Supuran CT (2004) Carbonic anhydrases: Current state of the art, therapeutic applications and future prospects. J Enz Inhib Med Chem 19: 199–229. - PubMed
- Neri D, Supuran CT (2011) Interfering with pH regulation in tumors as a therapeutic strategy. Nat Rev Drug Discov 10: 767–777. - PubMed
- Hassan IM, Shajee B, Waheed A, Ahmad F, Sly WS (2013) Structure, function and applications of carbonic anhydrase isozymes. Bioorg Med Chem 21: 1570–1582. - PubMed
- Aspatwar A, Tolvanen MEE, Parkkila S (2013) An update on carbonic anhydrase-related proteins VIII, X and XI. J Enzyme Inhib Med Chem 28: 1129–1142. - PubMed
- Harju A–K, Bootorabib F, Kuuslahti M, Supuran CT, Parkkila S (2013) Carbonic anhydrase III: a neglected isoenzyme is stepping into the limelight. J Enz Inhib Med Chem 28: 231–239. - PubMed
Publication types
MeSH terms
Substances
Grants and funding
This work was supported by the Swedish Research Council-Medicine (grant 20614) (www.vr.se); the Thuréus Foundation; The Swedish Institute (www.si.se); TUA Västra Götaland Region; and the Institute of Odontology, Sahlgrenska Academy at the University of Gothenburg. The funders had no role in study design, data collection and analysis, decision to publish, or preparation of the manuscript.
LinkOut - more resources
Full Text Sources
Other Literature Sources
Molecular Biology Databases
Research Materials
Miscellaneous


