Upregulation of Shiga toxin receptor CD77/Gb3 and interleukin-1β expression in the brain of EHEC patients with hemolytic uremic syndrome and neurologic symptoms - PubMed (original) (raw)
Upregulation of Shiga toxin receptor CD77/Gb3 and interleukin-1β expression in the brain of EHEC patients with hemolytic uremic syndrome and neurologic symptoms
Christian Hagel et al. Brain Pathol. 2015 Mar.
Abstract
In 2011, a large outbreak of Shiga toxin-producing enterohemorrhagic Escherichia coli (EHEC) infections occurred in northern Germany, which mainly affected adults. Out of 3842 patients, 104 experienced a complicated course comprising hemolytic uremic syndrome and neurological complications, including cognitive impairment, aphasia, seizures and coma. T2 hyperintensities on magnet resonance imaging (MRI) bilateral in the thalami and in the dorsal pons were found suggestive of a metabolic toxic effect. Five of the 104 patients died because of toxic heart failure. In the present study, the post-mortem neuropathological findings of the five EHEC patients are described. Histological investigation of 13 brain regions (frontal, temporal, occipital cortex, corpora mammillaria, thalamus, frontal operculum, corona radiata, gyrus angularis, pons, medulla oblongata, cerebellar vermis and cerebellar hemisphere) showed no thrombosis, ischemic changes or fresh infarctions. Further, no changes were found in electron microscopy. In comparison with five age-matched controls, slightly increased activation of microglia and a higher neuronal expression of interleukin-1β and of Shiga toxin receptor CD77/globotriaosylceramide 3 was observed. The findings were confirmed by Western blot analyses. It is suggested that CD77/globotriaosylceramide upregulation may be a consequence to Shiga toxin exposure, whereas increased interleukin-1β expression may point to activation of inflammatory cascades.
Keywords: CD77/Gb3; enterohemorrhagic Escherichia coli; hemolytic uremic syndrome; microglia; neuropathology; vasculature.
© 2014 International Society of Neuropathology.
Figures
Figure 1
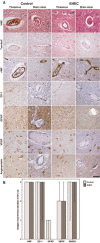
Vasculature‐related parameters in adult enterohemorrhagic
E
scherichia coli (
EHEC
) patients and controls. A. Upper row: small vessels in thalamus and brain stem of controls and
EHEC
brains showing some congestion but no thrombotic microangiopathy; second row: no signs of previous microbleeds in Turnbull stain; third row: regular endothelial expression of von Willebrand Factor (
vWF
) without evidence for
vWF
multimers; forth row: zonulo‐occludens‐1 (
ZO
‐1) immunohistochemistry showing regular expression in controls and
EHEC
cases; fifth row: normal glial fibrillary acidic protein (
GFAP
) expression in controls and
EHEC
cases; sixth row: normal vascular endothelial growth factor (
VEGF
) expression in neurons in both, controls and
EHEC
cases; seventh row: normal angiopoietin‐1 expression in neurons of controls and
EHEC
patients; all microphotographs from case #2 and #6, respectively; counter stain for all immunohistochemical samples hemalum. Scale bar: 50 μm. B. Semiquantitative evaluation of vasculature related antigens expressed in controls and
EHEC
patients, median values ± 95% confidence intervals.
Figure 2
Lack of apoptosis and normal ultrastructure in adult enterohemorrhagic
E
scherichia coli (
EHEC
) patients and controls. Upper row: representative samples of thalamus and brain stem of
EHEC
patients and controls depicting neurons with normal morphology,
H
&
E
; middle row: negative labeling with antibodies against activated caspase 3, counter stain hemalum, all microphotographs in the first two rows from case #2 and #6, respectively; scale bar for first two rows, 50 μm; lower row: normal ultrastructure of neurons in post‐mortem brain tissue showing intact nuclei (
N
), mitochondria (
M
) and endoplasmic reticulum (
ER
), scale bar in left picture 5 μm, scale bar in left close up view 1 μm, scale bars apply accordingly to the
EHEC
sample on the right.
Figure 3
Inflammation‐related parameters in the brain of adult enterohemorrhagic
E
scherichia coli (
EHEC
) patients and controls. A. First row: representative samples of thalamus and brain stem of
EHEC
patients and controls showing few scattered lymphocytes in both groups by labeling with antibodies against common leukocyte antigen (
LCA
); second and third row: labeling of major histocompatibility complex
II
(
HLA‐DR
) and
IBA
‐1 demonstrating slightly increased ramified microglia cells in
EHEC
patients; fourth row; no differences in
TNF
‐α expression in both groups; all microphotographs in the first five rows from case #2 and #6, respectively; scale bar 50 μm applies for the first five rows, counterstain hemalum; fifth row: increased
IL
‐1β expression in cortical neurons in
EHEC
patients in immunofluorescence, nuclear staining with
DAPI
. Scale bar: 10 μm. B. Semiquantitative evaluation of expression of inflammation associated antigens in controls and
EHEC
patients, median values ± 95% confidence intervals. C. Quantification of cytoplasmic
IL
‐1β‐immunofluorescence in 50 neurons of the frontal cortex in a control and an
EHEC
brain in relation to the area, arbitrary units, mean values ± 1 standard error of the mean, P < 0.0001.
Figure 4
Neuronal and endothelial
CD
77 expression in the brain of enterohemorrhagic
E
scherichia coli (
EHEC
) patients and controls. A.
CD
77 immunohistochemistry of thalamus samples of all 10 cases demonstrating increased
CD
77 expression in
EHEC
cases in the second row compared with controls in the first row, counter stain hemalum. Scale bar: 50 μm. B. Median expression levels of
CD
77 in thalamus and brain stem of controls and
EHEC
patients, median values of semiquantitative evaluation ± 95% confidence intervals. C. Percent of vessels with endothelial expression of
CD
77 in a randomly chosen area of 9 mm2 ± 1 standard error of the mean. D. Example of a vessel with
CD
77‐positive endothelia, counter stain hemalum. Scale bar: 50 μm.
Figure 5
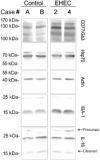
Immunoblots of
CD
77,
H
sp70, actin, IBA‐1 and
IL
‐1β. Western blot analyses of frontal cortex of
EHEC
patients compared with controls using antibodies against
CD
77/Gb3,
H
sp70 IBA‐1 and the mature (cleaved) and precursor forms of
IL
‐1β. Actin is shown as loading control and sizes of marker is indicated in kDa. Elevated steady‐state levels in homogenates of frontal cortex of
EHEC
patients compared with controls.
Similar articles
- Neuronal apoptosis and inflammatory responses in the central nervous system of a rabbit treated with Shiga toxin-2.
Takahashi K, Funata N, Ikuta F, Sato S. Takahashi K, et al. J Neuroinflammation. 2008 Mar 21;5:11. doi: 10.1186/1742-2094-5-11. J Neuroinflammation. 2008. PMID: 18355415 Free PMC article. - Shiga Toxins: An Update on Host Factors and Biomedical Applications.
Liu Y, Tian S, Thaker H, Dong M. Liu Y, et al. Toxins (Basel). 2021 Mar 18;13(3):222. doi: 10.3390/toxins13030222. Toxins (Basel). 2021. PMID: 33803852 Free PMC article. Review. - The neurological syndrome in adults during the 2011 northern German E. coli serotype O104:H4 outbreak.
Magnus T, Röther J, Simova O, Meier-Cillien M, Repenthin J, Möller F, Gbadamosi J, Panzer U, Wengenroth M, Hagel C, Kluge S, Stahl RK, Wegscheider K, Urban P, Eckert B, Glatzel M, Fiehler J, Gerloff C. Magnus T, et al. Brain. 2012 Jun;135(Pt 6):1850-9. doi: 10.1093/brain/aws090. Epub 2012 Apr 26. Brain. 2012. PMID: 22539260 - Enterohemorrhagic Escherichia coli suppresses inflammatory response to cytokines and its own toxin.
Bellmeyer A, Cotton C, Kanteti R, Koutsouris A, Viswanathan VK, Hecht G. Bellmeyer A, et al. Am J Physiol Gastrointest Liver Physiol. 2009 Sep;297(3):G576-81. doi: 10.1152/ajpgi.00050.2009. Epub 2009 Jun 25. Am J Physiol Gastrointest Liver Physiol. 2009. PMID: 19556613 Free PMC article. - Shiga toxin-glycosphingolipid interaction: Status quo of research with focus on primary human brain and kidney endothelial cells.
Legros N, Pohlentz G, Steil D, Müthing J. Legros N, et al. Int J Med Microbiol. 2018 Dec;308(8):1073-1084. doi: 10.1016/j.ijmm.2018.09.003. Epub 2018 Sep 8. Int J Med Microbiol. 2018. PMID: 30224239 Review.
Cited by
- Neurological manifestations of thrombotic microangiopathy syndromes in adult patients.
Weil EL, Rabinstein AA. Weil EL, et al. J Thromb Thrombolysis. 2021 May;51(4):1163-1169. doi: 10.1007/s11239-021-02431-5. Epub 2021 Mar 23. J Thromb Thrombolysis. 2021. PMID: 33755882 - Neurological Sequelae in Adults After E coli O104: H4 Infection-Induced Hemolytic-Uremic Syndrome.
Schuppner R, Maehlmann J, Dirks M, Worthmann H, Tryc AB, Sandorski K, Bahlmann E, Kielstein JT, Giesemann AM, Lanfermann H, Weissenborn K. Schuppner R, et al. Medicine (Baltimore). 2016 Feb;95(6):e2337. doi: 10.1097/MD.0000000000002337. Medicine (Baltimore). 2016. PMID: 26871766 Free PMC article. - Shiga Toxins as Multi-Functional Proteins: Induction of Host Cellular Stress Responses, Role in Pathogenesis and Therapeutic Applications.
Lee MS, Koo S, Jeong DG, Tesh VL. Lee MS, et al. Toxins (Basel). 2016 Mar 17;8(3):77. doi: 10.3390/toxins8030077. Toxins (Basel). 2016. PMID: 26999205 Free PMC article. Review. - No reactivation of JCV and CMV infections in the temporal cortex and cerebellum of sporadic Creutzfeldt-Jakob disease patients.
Löffler J, Krasemann S, Zerr I, Matschke J, Glatzel M. Löffler J, et al. Am J Neurodegener Dis. 2014 Dec 5;3(3):152-7. eCollection 2014. Am J Neurodegener Dis. 2014. PMID: 25628966 Free PMC article. - Cerebral Hemodynamics in Patients with Hemolytic Uremic Syndrome Assessed by Susceptibility Weighted Imaging and Four-Dimensional Non-Contrast MR Angiography.
Löbel U, Forkert ND, Schmitt P, Dohrmann T, Schroeder M, Magnus T, Kluge S, Weiler-Normann C, Bi X, Fiehler J, Sedlacik J. Löbel U, et al. PLoS One. 2016 Nov 1;11(11):e0164863. doi: 10.1371/journal.pone.0164863. eCollection 2016. PLoS One. 2016. PMID: 27802295 Free PMC article.
References
- Blackwell CC, Dundas S, James VS, Mackenzie DA, Braun JM, Alkout AM et al (2002) Blood group and susceptibility to disease caused by Escherichia coli O157. J Infect Dis 185:393–396. - PubMed
- Branch DR (2010) Blood groups and susceptibility to virus infection: new developments. Curr Opin Hematol 17:558–564. - PubMed
- Cilmi SA, Karalius BJ, Choy W, Smith RN, Butterton JR (2006) Fabry disease in mice protects against lethal disease caused by Shiga toxin‐expressing enterohemorrhagic Escherichia coli . J Infect Dis 194:1135–1140. - PubMed
MeSH terms
Substances
LinkOut - more resources
Full Text Sources
Other Literature Sources
Medical
Miscellaneous


