HGK/MAP4K4 deficiency induces TRAF2 stabilization and Th17 differentiation leading to insulin resistance - PubMed (original) (raw)
Wayne H-H Sheu 2, Yi-Ting Lin 1, Ching-Yi Tsai 1, Chia-Yu Yang 1, Yu-Jhen Cheng 1, Pau-Yi Huang 1, Ju-Pi Li 1, Li-Li Chiu 3, Xiaohong Wang 4, Min Xie 5, Michael D Schneider 6, Tse-Hua Tan 7
Affiliations
- PMID: 25098764
- PMCID: PMC4143962
- DOI: 10.1038/ncomms5602
HGK/MAP4K4 deficiency induces TRAF2 stabilization and Th17 differentiation leading to insulin resistance
Huai-Chia Chuang et al. Nat Commun. 2014.
Abstract
Proinflammatory cytokines play important roles in insulin resistance. Here we report that mice with a T-cell-specific conditional knockout of HGK (T-HGK cKO) develop systemic inflammation and insulin resistance. This condition is ameliorated by either IL-6 or IL-17 neutralization. HGK directly phosphorylates TRAF2, leading to its lysosomal degradation and subsequent inhibition of IL-6 production. IL-6-overproducing HGK-deficient T cells accumulate in adipose tissue and further differentiate into IL-6/IL-17 double-positive cells. Moreover, CCL20 neutralization or CCR6 deficiency reduces the Th17 population or insulin resistance in T-HGK cKO mice. In addition, leptin receptor deficiency in T cells inhibits Th17 differentiation and improves the insulin sensitivity in T-HGK cKO mice, which suggests that leptin cooperates with IL-6 to promote Th17 differentiation. Thus, HGK deficiency induces TRAF2/IL-6 upregulation, leading to IL-6/leptin-induced Th17 differentiation in adipose tissue and subsequent insulin resistance. These findings provide insight into the reciprocal regulation between the immune system and the metabolism.
Figures
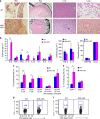
Figure 1. Normal T-cell development in T-HGK cKO mice.
(a) Schematic diagram of the mouse HGK WT allele, the gene targeting vector and the targeted HGK floxed allele. (b) T-cell-specific deletion of HGK in T-HGK cKO mice. T cells were purified from the spleen of mice. The remaining cells (non-T cells) were studied as a control. The expression of HGK and tubulin in T cells and non T cells was determined by immunoblotting analyses. (c,d) Flow cytometry analyses of T cells (c) and Treg cells (d) from the thymus and spleen of 5-week-old WT and T-HGK cKO mice. WT, littermate controls (HGKf/f mice or CD4-Cre mice); HGK cKO, T-HGK cKO mice. Data shown are representatives of three independent experiments.
Figure 2. T-HGK cKO mice show inflammation-associated disorders and IL-6/IL-17 induction.
(a) Haematoxylin and eosin-stained sections of organs from 16-week-old mice. Arrows, infiltrating immune cells. Scale bar, 100 μm. WT, littermate controls (HGKf/f mice or CD4-Cre mice); HGK cKO, T-HGK cKO mice. (b) The levels of serum cytokines from 8-week-old mice were determined by ELISA assays. _n_=20. Means±s.e.m. are shown. (c) Statistical analyses of IL-6-producing cells in the peripheral blood of 8-week-old mice. The frequency of IL-6-producing cells was normalized to the total number of each cell type. _n_=8. Means±s.e.m. are shown. (d) The representative flow cytometry data of IL-6-producing T cells from peripheral blood of mice. (e) Statistical analyses of IL-17-producing peripheral blood T cells from 8-week-old mice. The frequency of IL-17-producing T cells was normalized to the total number of T-cell subsets. _n_=8. Means±s.e.m. are shown. (f) Representative flow cytometry data of IL-17-producing T cells from peripheral blood of mice. WT, littermate controls (HGKf/f mice or CD4-Cre mice); HGK cKO, T-HGK cKO mice. Data shown (a,b) are representatives of three independent experiments. *_P_-value<0.05; **_P_-value<0.01; ***_P_-value<0.005 (two-tailed Mann–Whitney _U_-test).
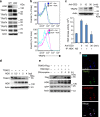
Figure 3. HGK induces the lysosomal degradation of TRAF2.
(a) Immunoblotting analyses of HGK and TRAFs in primary splenic T cells of WT and T-HGK cKO mice. (b) Flow cytometry analyses of TRAF2-positive cells from WT and HGK cKO (cKO) T cells transfected with empty vector (Vec, encoding CFP alone) or vector encoding HGK tagged with CFP. Means±s.e.m. are shown. (c) Immunoblotting analyses of TRAF2 and actin in Jurkat T cells stimulated with anti-CD3 antibodies (upper panel). In vitro kinase assays of the endogenous HGK proteins immunoprecipitated from lysates of Jurkat T cells stimulated with anti-CD3 antibodies (lower panel). NS, normal serum. _n_=3. Means±s.e.m. are shown. (d) Immunoblotting analyses of indicated molecules in lysates of HEK293T cells transfected with TRAF2 (2 μg) and HGK (various amounts) plasmids. (e) Immunoblotting analyses of indicated molecules in lysates of HEK293T cells transfected with TRAF2 and/or HGK, and treated with the lysosome inhibitor chloroquine. (f) Confocal microscopy analyses of co-localization of HGK-CFP (blue), TRAF2-YFP (green) and lysosome (lysotracker; red) in HEK293T cells treated with chloroquine. Original magnification, × 630; scale bar, 10 μm. Data shown are representatives of three independent experiments.
Figure 4. HGK directly phosphorylates TRAF2 at serine 35 that mediates TRAF2 degradation.
(a) Co-immunoprecipitations (IP) of endogenous HGK with TRAF2 in lysates of mouse primary splenic T cells treated with chloroquine. NS, normal serum. IB, immunoblotting. (b) In vitro binding assays of purified HGK-Myc and Flag-TRAF2 proteins. (c) Signals of the interaction between HGK-Myc and TRAF2-Flag in lysates of HEK293T cells determined by amplified luminescent proximity homogeneous assays (α). Means±s.e.m. are shown. (d) In vitro kinase assays using purified HGK-Myc and Flag-TRAF2 proteins. (e) Mass spectrometry (MS)/MS fragmentation spectra of the tryptic peptides of TRAF2 contain the phosphorylation of Ser35. In vitro phosphorylated Flag-tagged TRAF2 was isolated, digested with trypsin and subjected to LC-MS/MS analyses. (f) Immunoblotting analyses of indicated molecules in lysates of HEK293T cells transfected with WT TRAF2 or TRAF2 mutants in the presence or absence of HGK plasmids. (g) IL-6 production in the mouse primary splenic T cells. T cells were transfected with GFP-TRAF2 short hairpin RNA (shRNA) and a control GFP vector. The transfected T cells were stimulated with PMA plus ionomycin for 3 h and then determined by flow cytometry at day 3 after transfection. Data show the percentages of IL-6 producing T cells (green fluorescent protein (GFP)-gated) and presented as mean±s.e.m. from triplicate experiments. WT, littermate controls (HGKf/f mice); HGK cKO, T-HGK cKO mice. Data shown are representatives of three (a–d,g) and two (e,f) independent experiments. *_P_-value<0.05; **_P_-value<0.01 (two-tailed Mann–Whitney _U_-test).
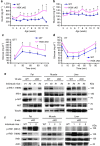
Figure 5. T-HGK cKO mice develop insulin resistance mediated by IL-6 and IL-17.
(a,b) Fasting insulin (a) and glucose levels (b) in the sera of WT and T-HGK cKO mice. n, at least 18. (c) GTT tests were performed on 12-week-old WT and T-HGK cKO mice. Glucose levels were plotted versus time post glucose injection. _n_=6. (d) ITT tests were performed on 12-week-old mice. Blood glucose levels were measured at indicated time periods post insulin injection. _n_=6. (e,f) Immunoblotting analyses of p-IRS-1 (Y896 or S612), IRS-1, p-AKT, AKT or tubulin/actin in hepatocytes, skeletal muscle cells and adipocytes of 16-week-old (e) or 8-week-old (f) WT and T-HGK cKO mice. Mice were injected with 2 g kg−1 glucose for 1 h after 16-h fasting. WT, littermate controls (HGKf/f mice or CD4-Cre mice); HGK cKO, T-HGK cKO mice. *_P_-value<0.05; **_P_-value<0.01 (a–d, two-tailed Student’s _t_-test).
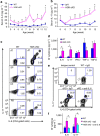
Figure 6. Accumulation of IL-6/IL-17 double-positive T cells in adipose tissue mediated by CCL20-CCR6 interactions.
(a) Cells were isolated from adipose tissue of 8-week-old WT or T-HGK cKO mice. Cells (without stimulation) were stained for expression of IL-6, IL-17, CD3, CD4 or CD45, and then cells were analysed by flow cytometry. Representative contour plots show percentages of IL-6- and IL-17-producing, non-stimulated CD4+ T cells in the insulin-targeted tissues. (b) The peripheral blood of T-HGK cKO mice at indicated ages were isolated, stained for IL-6+ and IL-17+ CD4+ T cells and analysed by flow cytometry. wks, weeks. (c) The levels of indicated chemokines from adipose tissue (AT) of WT or T-HGK cKO mice were determined by ELISA assays. (d) Cells were isolated from adipose tissue of mice at day 2 after CCL20 or CCL2 neutralization. Cells (without stimulation) were stained for expression of IL-6, IL-17, CD4 or CD45, and then cells were analysed by flow cytometry. (e) GTT tests were performed on T-HGK cKO mice at day 2 after CCL2 or CCL20 neutralization. Glucose levels were plotted versus time post glucose injection. _n_=5 per group. (f) GTT tests were performed on 18-week-old T-HGK cKO (CD4-Cre;HGKf/f) mice (_n_=6) and CCR6 KO/T-HGK cKO (CD4-Cre;HGKf/f;CCR6−/−) mice (_n_=5). Glucose levels were plotted versus time post glucose injection. Means±s.e.m. are shown. Glucose levels were plotted versus time. Data shown are representatives of three (a,d) and two (c,b,e,f) independent experiments. Means±s.e.m. are shown. *_P_-value<0.05; **_P_-value<0.01 (two-tailed Mann–Whitney _U_-test).
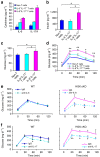
Figure 7. IL-6/IL-17 double-positive T cells are pathogenic.
ELISA assay of fasting (a) IL-6/IL-17, (b) insulin and (c) glucose levels in the sera of indicated recipients 14 days after adoptive transfer. _n_=3 in (a); n, at least 5 (b,c). (d) GTT tests were performed on indicated recipients at 14 days after adoptive transfer. n, at least 5. (e,f) GTT tests of 12-week-old mice at day 2 after IL-6 (e) or IL-17 (f) neutralization. Glucose levels were plotted versus time post glucose injection. _n_=6 per group. Data shown are representatives of two independent experiments. Means±s.e.m. are shown. WT, littermate controls (HGKf/f mice or CD4-Cre mice); HGK cKO, T-HGK cKO mice. *_P_-value<0.05; **_P_-value<0.01 (two-tailed Mann–Whitney _U_-test).
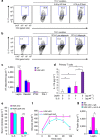
Figure 8. IL-6 promotes Th17 differentiation in adipose tissue of T-HGK cKO mice.
(a) Fasting IL-6 and (b) IL-17 levels in mouse sera were measured by ELISA assays. _n_=18–23. (c) The percentages of IL-6- and IL-17-producing, non-stimulated CD4+ T cells in the adipose tissue (AT), spleen (Sp), lymph nodes (LN) and peripheral blood (PB) of 10-week-old mice were analysed by flow cytometry. (d) The levels of indicated cytokines from adipose tissue of mice were determined by ELISA assays. (e) Contour plots show the percentages of IL-6- and IL-17-producing, non-stimulated CD4+ T cells from adipose tissue of mice at 2 days after IL-6 neutralization. _n_=5. (f) The levels of IL-6 and IL-17 from adipose tissue of mice at 2 days after IL-6 neutralization. Data shown are representatives of three (c) and two (e,f) independent experiments. Data are expressed as mean±s.e.m. WT, littermate controls (HGKf/f mice); HGK cKO, T-HGK cKO mice. *_P_-value<0.05; **_P_-value<0.01 (a,b, two-tailed Student’s _t_-test; d,f, two-tailed Mann–Whitney _U_-test).
Figure 9. Leptin cooperates with IL-6 to promote Th17 differentiation.
(a,b) CD4+CD25− T cells were purified from spleens of WT mice and cultured for 4 days under Th17 differentiation conditions in the presence or absence adipose tissue fluids (a) or 3T3-L1 adipocyte conditioned medium (b). After Th17 differentiation, T cells were stimulated with PMA and ionomycin, and analysed for IL-17 expression by intracellular staining. Contour plots depict IL-17-producing CD4 T cells. Numbers indicate the percentages of cells in the quadrants. (c) The levels of indicated adipokines from adipose tissue of WT and T-HGK cKO mice were determined by ELISA assays. (d) The IL-17 levels in supernatants of the primary T cells stimulated with leptin and/or IL-6 for 3 days were determined by ELISA assays. (e) IL-6 and IL-17 levels in the sera of 16-week-old T-HGK cKO (CD4-Cre;HGKf/f) mice and T-HGK/LepR cKO (CD4-Cre;HGKf/f;leptin receptorf/f) mice were measured by ELISA assays. _n_=6. (f) GTT tests were performed on 16-week-old T-HGK cKO mice and T-HGK/LepR cKO mice. Glucose levels were plotted versus times post glucose injection. (g) The leptin levels in adipose tissue of mice after IL-6 neutralization. Data shown are representatives of three (a,b,d) and two (c,e,f,g) independent experiments. Data are expressed as mean±s.e.m. *_P_-value<0.05; **_P_-value<0.01; ***_P_-value<0.001 (two-tailed Mann–Whitney _U_-test).
Figure 10. Schematic diagram of HGK-mediated reciprocal regulation between T cells and adipocytes.
HGK deficiency leads to constitutive TRAF2 overexpression and IL-6 overproduction in T cells. The circulating IL-6-producing T cells infiltrate to adipose tissue and enhance the production of leptin, which in turn cooperates with IL-6 to induce Th17 differentiation. The induction of adipose tissue Th17 cells leads to insulin resistance.
Similar articles
- Epigenetic regulation of HGK/MAP4K4 in T cells of type 2 diabetes patients.
Chuang HC, Wang JS, Lee IT, Sheu WH, Tan TH. Chuang HC, et al. Oncotarget. 2016 Mar 8;7(10):10976-89. doi: 10.18632/oncotarget.7686. Oncotarget. 2016. PMID: 26918832 Free PMC article. - MAP4K Family Kinases in Immunity and Inflammation.
Chuang HC, Wang X, Tan TH. Chuang HC, et al. Adv Immunol. 2016;129:277-314. doi: 10.1016/bs.ai.2015.09.006. Epub 2015 Oct 26. Adv Immunol. 2016. PMID: 26791862 Review. - TNFR-Associated Factors 2 and 5 Differentially Regulate the Instructive IL-6 Receptor Signaling Required for Th17 Development.
Nagashima H, Okuyama Y, Hayashi T, Ishii N, So T. Nagashima H, et al. J Immunol. 2016 May 15;196(10):4082-9. doi: 10.4049/jimmunol.1501610. Epub 2016 Apr 13. J Immunol. 2016. PMID: 27076680 - Regulation of Interleukin-6 Receptor Signaling by TNF Receptor-Associated Factor 2 and 5 During Differentiation of Inflammatory CD4+ T Cells.
Nagashima H, Ishii N, So T. Nagashima H, et al. Front Immunol. 2018 Aug 30;9:1986. doi: 10.3389/fimmu.2018.01986. eCollection 2018. Front Immunol. 2018. PMID: 30214449 Free PMC article. Review. - MAP4K4 gene silencing in human skeletal muscle prevents tumor necrosis factor-alpha-induced insulin resistance.
Bouzakri K, Zierath JR. Bouzakri K, et al. J Biol Chem. 2007 Mar 16;282(11):7783-9. doi: 10.1074/jbc.M608602200. Epub 2007 Jan 16. J Biol Chem. 2007. PMID: 17227768
Cited by
- Association of Serum Adipsin Level with Insulin Resistance and Inflammatory Markers in Newly Diagnosed Type two Diabetes Mellitus Patients.
Singh S, Hussain S, Yadav SS, Tiwari NP, Usman K, Sawlani KK, Khattri S. Singh S, et al. Indian J Clin Biochem. 2024 Jul;39(3):415-420. doi: 10.1007/s12291-023-01126-3. Epub 2023 Mar 30. Indian J Clin Biochem. 2024. PMID: 39005860 - [The effect of obesity on disease activity of inflammatory rheumatic diseases].
Müller-Ladner U, Frommer K, Karrasch T, Neumann E, Schäffler A. Müller-Ladner U, et al. Z Rheumatol. 2021 May;80(4):353-361. doi: 10.1007/s00393-021-00987-4. Epub 2021 Mar 27. Z Rheumatol. 2021. PMID: 33774725 Review. German. - The Role of Tumor Necrosis Factor Associated Factors (TRAFs) in Vascular Inflammation and Atherosclerosis.
Gissler MC, Stachon P, Wolf D, Marchini T. Gissler MC, et al. Front Cardiovasc Med. 2022 Feb 17;9:826630. doi: 10.3389/fcvm.2022.826630. eCollection 2022. Front Cardiovasc Med. 2022. PMID: 35252400 Free PMC article. Review. - Development of MAP4 Kinase Inhibitors as Motor Neuron-Protecting Agents.
Bos PH, Lowry ER, Costa J, Thams S, Garcia-Diaz A, Zask A, Wichterle H, Stockwell BR. Bos PH, et al. Cell Chem Biol. 2019 Dec 19;26(12):1703-1715.e37. doi: 10.1016/j.chembiol.2019.10.005. Epub 2019 Oct 31. Cell Chem Biol. 2019. PMID: 31676236 Free PMC article. - MAP4K4 mediates the SOX6-induced autophagy and reduces the chemosensitivity of cervical cancer.
Huang H, Han Q, Zheng H, Liu M, Shi S, Zhang T, Yang X, Li Z, Xu Q, Guo H, Lu F, Wang J. Huang H, et al. Cell Death Dis. 2021 Dec 20;13(1):13. doi: 10.1038/s41419-021-04474-1. Cell Death Dis. 2021. PMID: 34930918 Free PMC article.
References
- Korn T., Bettelli E., Oukka M. & Kuchroo V. K. IL-17 and Th17 Cells. Annu. Rev. Immunol. 27, 485–517 (2009). - PubMed
- Singh S. P., Zhang H. H., Foley J. F., Hedrick M. N. & Farber J. M. Human T cells that are able to produce IL-17 express the chemokine receptor CCR6. J. Immunol. 180, 214–221 (2008). - PubMed
- Lim H. W., Lee J., Hillsamer P. & Kim C. H. Human Th17 cells share major trafficking receptors with both polarized effector T cells and FOXP3+ regulatory T cells. J. Immunol. 180, 122–129 (2008). - PubMed
Publication types
MeSH terms
Substances
LinkOut - more resources
Full Text Sources
Other Literature Sources
Molecular Biology Databases
Miscellaneous

