Comprehensive analysis of DNA methylation data with RnBeads - PubMed (original) (raw)
. 2014 Nov;11(11):1138-1140.
doi: 10.1038/nmeth.3115. Epub 2014 Sep 28.
Affiliations
- PMID: 25262207
- PMCID: PMC4216143
- DOI: 10.1038/nmeth.3115
Comprehensive analysis of DNA methylation data with RnBeads
Yassen Assenov et al. Nat Methods. 2014 Nov.
Abstract
RnBeads is a software tool for large-scale analysis and interpretation of DNA methylation data, providing a user-friendly analysis workflow that yields detailed hypertext reports (http://rnbeads.mpi-inf.mpg.de/). Supported assays include whole-genome bisulfite sequencing, reduced representation bisulfite sequencing, Infinium microarrays and any other protocol that produces high-resolution DNA methylation data. Notable applications of RnBeads include the analysis of epigenome-wide association studies and epigenetic biomarker discovery in cancer cohorts.
Figures
Figure 1. RnBeads workflow for analyzing large-scale DNA methylation data
The RnBeads workflow consists of seven modules and is essentially self-configuring based on a sample annotation table provided by the user. Each module generates part of the RnBeads hypertext report, which includes method descriptions, diagrams, and links to data tables. Furthermore, all data and annotations are stored in RnBSet objects to facilitate custom analysis workflows in R, and they are exported for visualization using genome browsers and follow-up analyses using other software tools. IDAT, signal intensity data; GS, Illumina GenomeStudio data; TAB, TAB-delimited data; GEO, Gene Expression Omnibus data.
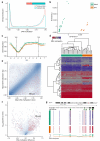
Figure 2. Analysis of DNA methylation during adult stem cell differentiation
RnBeads was used to re-analyze an RRBS dataset comprising 19 cell types of the blood and skin lineages. All diagrams shown were calculated by RnBeads but have been reformatted according to journal standards. (a) Global distribution of DNA methylation levels among retained and removed CpGs after the preprocessing step. (b) Relative similarity and differences of DNA methylation profiles between cell types. Two maximally informative dimensions were calculated using multi-dimensional scaling (MDS) based on the matrix of average methylation levels in 5kb tiling regions. Samples are color-coded according to cell type. (c) Composite plot of DNA methylation levels in blood (green) and skin (orange) cell types averaged across all genes. Each gene was covered by six equally sized bins and by two flanking regions of the same size. Smoothing was done using cubic splines. (d) Heatmap with hierarchical clustering of DNA methylation levels among lineage marker genes that are specifically expressed in the blood lineage. Clustering used average linkage and Manhattan distance. (e) Scatterplot of groupwise mean DNA methylation levels across genes, with the 1,000 highest-ranking differentially methylated genes highlighted in red. Point density is shown as blue shading. (f) Volcano plot illustrating effect size and statistical significance across genes, with the 1,000 highest-ranking differentially methylated genes highlighted in red. Point density is shown as blue shading. (g) DNA methylation profile of the Hoxb3 gene locus on Chromosome 11 (brown triangle). Heatmaps show DNA methylation levels of single CpGs according to the color scheme in panel d. Smoothing of DNA methylation levels (bottom) was done using cubic splines.
Similar articles
- RnBeads 2.0: comprehensive analysis of DNA methylation data.
Müller F, Scherer M, Assenov Y, Lutsik P, Walter J, Lengauer T, Bock C. Müller F, et al. Genome Biol. 2019 Mar 14;20(1):55. doi: 10.1186/s13059-019-1664-9. Genome Biol. 2019. PMID: 30871603 Free PMC article. - epiGBS: reference-free reduced representation bisulfite sequencing.
van Gurp TP, Wagemaker NC, Wouters B, Vergeer P, Ouborg JN, Verhoeven KJ. van Gurp TP, et al. Nat Methods. 2016 Apr;13(4):322-4. doi: 10.1038/nmeth.3763. Epub 2016 Feb 8. Nat Methods. 2016. PMID: 26855363 - MethGo: a comprehensive tool for analyzing whole-genome bisulfite sequencing data.
Liao WW, Yen MR, Ju E, Hsu FM, Lam L, Chen PY. Liao WW, et al. BMC Genomics. 2015;16 Suppl 12(Suppl 12):S11. doi: 10.1186/1471-2164-16-S12-S11. Epub 2015 Dec 9. BMC Genomics. 2015. PMID: 26680022 Free PMC article. - Strategies for analyzing bisulfite sequencing data.
Wreczycka K, Gosdschan A, Yusuf D, Grüning B, Assenov Y, Akalin A. Wreczycka K, et al. J Biotechnol. 2017 Nov 10;261:105-115. doi: 10.1016/j.jbiotec.2017.08.007. Epub 2017 Aug 16. J Biotechnol. 2017. PMID: 28822795 Review. - Methodological aspects of whole-genome bisulfite sequencing analysis.
Adusumalli S, Mohd Omar MF, Soong R, Benoukraf T. Adusumalli S, et al. Brief Bioinform. 2015 May;16(3):369-79. doi: 10.1093/bib/bbu016. Epub 2014 May 27. Brief Bioinform. 2015. PMID: 24867940 Review.
Cited by
- Differential methylation analysis for bisulfite sequencing using DSS.
Feng H, Wu H. Feng H, et al. Quant Biol. 2019 Dec 31;7(4):327-334. doi: 10.1007/s40484-019-0183-8. Epub 2019 Dec 15. Quant Biol. 2019. PMID: 34084562 Free PMC article. - Methylome profiling of young adults with depression supports a link with immune response and psoriasis.
Lapsley CR, Irwin R, McLafferty M, Thursby SJ, O'Neill SM, Bjourson AJ, Walsh CP, Murray EK. Lapsley CR, et al. Clin Epigenetics. 2020 Jun 15;12(1):85. doi: 10.1186/s13148-020-00877-7. Clin Epigenetics. 2020. PMID: 32539844 Free PMC article. - Implementing a method for studying longitudinal DNA methylation variability in association with age.
Wang Y, Pedersen NL, Hägg S. Wang Y, et al. Epigenetics. 2018;13(8):866-874. doi: 10.1080/15592294.2018.1521222. Epub 2018 Oct 2. Epigenetics. 2018. PMID: 30251590 Free PMC article. - Analysis of GWAS-nominated loci for lung cancer and COPD revealed a new asthma locus.
Madore AM, Bossé Y, Margaritte-Jeannin P, Vucic E, Lam WL, Bouzigon E, Bourbeau J, Laprise C. Madore AM, et al. BMC Pulm Med. 2022 Apr 23;22(1):155. doi: 10.1186/s12890-022-01890-7. BMC Pulm Med. 2022. PMID: 35461280 Free PMC article. - Longitudinal Effects of Developmental Bisphenol A Exposure on Epigenome-Wide DNA Hydroxymethylation at Imprinted Loci in Mouse Blood.
Kochmanski JJ, Marchlewicz EH, Cavalcante RG, Perera BPU, Sartor MA, Dolinoy DC. Kochmanski JJ, et al. Environ Health Perspect. 2018 Jul 23;126(7):077006. doi: 10.1289/EHP3441. eCollection 2018 Jul. Environ Health Perspect. 2018. PMID: 30044229 Free PMC article.
References
- Bibikova M, et al. Genomics. 2011;98:288–295. - PubMed
Methods-only References
- Gentleman R, Temple Lang D. Bioconductor Project Working Paper 2. 2004.
- Hebestreit K, Dugas M, Klein HU. Bioinformatics. 2013;29:1647–1653. - PubMed
Publication types
MeSH terms
Substances
LinkOut - more resources
Full Text Sources
Other Literature Sources

