γδ T cells promote inflammation and insulin resistance during high fat diet-induced obesity in mice - PubMed (original) (raw)
γδ T cells promote inflammation and insulin resistance during high fat diet-induced obesity in mice
Pooja Mehta et al. J Leukoc Biol. 2015 Jan.
Abstract
γδ T cells are resident in AT and increase during diet-induced obesity. Their possible contribution to the inflammatory response that accompanies diet-induced obesity was investigated in mice after a 5 to 10 week milk HFD. The HFD resulted in significant increases in CD44(hi), CD62L(lo), and TNF-α(+) γδ T cells in eAT of WT mice. Mice deficient in all γδ T cells (TCRδ(-/-)) or only Vγ4 and Vγ6 subsets (Vγ4/6(-/-)) were compared with WT mice with regard to proinflammatory cytokine production and macrophage accumulation in eAT. Obesity among these mouse strains did not differ, but obese TCRδ(-/-) and Vγ4/6(-/-) mice had significantly reduced eAT expression of F4/80, a macrophage marker, and inflammatory mediators CCL2 and IL-6 compared with WT mice. Obese TCRδ(-/-) mice had significantly reduced CD11c(+) and TNF-α(+) macrophage accumulation in eAT after 5 and 10 weeks on the HFD, and obese Vγ4/6(-/-) mice had significantly increased CD206(+) macrophages in eAT after 5 weeks on the diet and significantly reduced macrophages after 10 weeks. Obese TCRδ(-/-) mice had significant reductions in systemic insulin resistance and inflammation in liver and skeletal muscle after longer-term HFD feeding (10 and 24 weeks). In vitro studies revealed that isolated γδ T cells directly stimulated RAW264.7 macrophage TNF-α expression but did not stimulate inflammatory mediator expression in 3T3-L1 adipocytes. These findings are consistent with a role for γδ T cells in the proinflammatory response that accompanies diet-induced obesity.
Keywords: CCL2; IL-6; adipose tissue; liver; macrophage; skeletal muscle.
© Society for Leukocyte Biology.
Figures
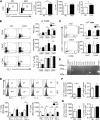
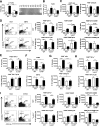
Figure 1.. Characterization of γδ T cells in eAT of mice after 5 weeks of HFD.
(A) Analysis of CD3+GL3+ γδ T cells in SVF isolated by collagenase digestion of eAT from male C57BL/6J mice on 5 weeks of ND (white bars) or HFD (black bars). Cells were gated on the CD3+ population and analyzed for coexpression of GL3 by flow cytometry. Data are represented as total number of γδ T cells in eAT/mouse (# of cells/fat pads) and number of cells relative to grams of AT mass (# of cells/fat pads/g fat) and as percentage of total leukocytes in eAT, and numbers inside boxes refer to percentage of γδ T cells of total T cells; n = 8–10 mice in each group. *P < 0.05, ns, Not significant. (B) Flow cytometric analysis of CD69, CD62L and CD44 expression on γδ T cells in eAT of mice after 5 weeks of ND or HFD. (C) Flow cytometric analysis of CD27 and CCR6 expression on γδ T cells in eAT of mice after 5 weeks of ND or HFD. (D) Flow cytometric analysis of intracellular cytokine IFN-γ, IL-17, IL-6, and TNF-α expression by γδ T cells in eAT after 5 weeks of ND or HFD. SVF cells were isolated from eAT and cultured overnight in DMEM containing Brefeldin A. (B–D) Data are represented as number of cells/fats pads and number of cells/fat pads/gram of fat and as a percentage of γδ T cells in eAT (numbers inside box). *P < 0.05, and **P < 0.01 comparing ND- and HFD-fed groups of mice; n = 4–5 mice in each group. (E) PCR analysis to determine the γ and δ TCR chains expressed in eAT of C57BL/6J mice after 5 weeks of HFD. Representative gel picture of at least 3 repeat experiments. (F and G) Flow cytometric analysis of γδ T cells in (F) spleen and (G) whole blood after 5 weeks of ND or HFD, represented as number of cells/tissue and as a percent of total T cells; n = 3–5 mice in each group. Values are mean ±
sem
. *P < 0.05 by Student’s _t_-test.
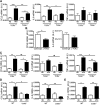
Figure 2.. CCL2, IL-6, and TNF-α expression in eAT of HFD-fed TCR_δ_−/− mice, V_γ_4/6−/− mice, and mice treated with anti-TCR_γδ_ antibody.
(A) mRNA expression of CCL2, IL-6, and TNF-α in eAT of TCR_δ_−/− and TCR_δ_+/+ mice after 5 weeks of ND or HFD, as determined by qPCR analysis, expressed relative to housekeeping gene GAPDH; n = 6–9 mice in each group. (B) mRNA expression of CCL2 and IL-6 in eAT of HFD-fed C57BL/6J mice treated with IgG isotype control antibody (white bar) or anti-TCR_γδ_ antibody (black bar), as determined by qPCR analysis; n = 5 mice in each group. *P < 0.05 by Student’s t_-test. (C) mRNA expression of CCL2, IL-6, and TNF-α in eAT of TCR_δ_−/− and TCR_δ+/+ mice after 10 weeks of ND or HFD, as determined by qPCR analysis; n = 5–6 mice in each group. (D) mRNA expression of CCL2 and IL-6 in eAT of V_γ_4/6−/− and WT mice after 5 weeks of ND or HFD, as determined by qPCR; n = 4–6 mice in each group. (E) mRNA expression of TNF-α in eAT of V_γ_4/6−/− and WT mice after 10 weeks of ND or HFD, as determined by qPCR; n = 4–6 mice in each group. Values are mean ±
sem.
, (A, C–E) *P < 0.05, **P < 0.01, and ***P < 0.001 by one-way ANOVA with Tukey’s post hoc test. One representative cohort of 2 independent cohorts of mice.
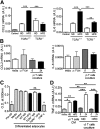
Figure 3.. Effect of γδ T cells on cytokine expression by 3T3-L1 adipocytes and RAW264.7 macrophages in vitro.
(A) qPCR gene expression of CCL2 and IL-6 by differentiated 3T3-L1 adipocytes treated for 24 h with eAT explant media from TCR_δ_+/+ or TCR_δ_−/− mice after 5 weeks of ND or HFD; n = 3–5 replicates/group. (B) qPCR gene expression of CCL2 and IL-6 by differentiated 3T3-L1 adipocytes treated with CM from γδ T cells or cocultured with γδ T cells for 24 h. As control, γδ T cells were plated onto 3T3-L1 cells and washed away immediately before harvesting the 3T3-L1 cells for RNA isolation (0 h). γδ T cells were isolated from spleen of C57BL/6J mice fed HFD for 5 weeks; n = 3 replicates/group. (C) Preadipocyte (Pre-AD)-to-adipocyte differentiation of 3T3-L1 cells treated with eAT explant media from WT or TCR_δ_−/− mice fed ND or HFD for 5 weeks. Undifferentiated preadipocytes and adipocytes treated with DMEM or eAT explant control media or mouse recombinant TNF-α used as controls for 3T3-L1 adipocyte differentiation. Oil Red O staining performed on Day 8 of adipocyte differentiation; n = 6 replicates/group. (D) TNF-α gene expression by RAW264.7 murine macrophage cell line cocultured with γδ T cells from spleens of male WT mice on ND or HFD, as analyzed by qPCR. RAW264.7 cells were cocultured with γδ T cells at a ratio of 20:1 (macrophages:γδ T cells) for 24 h. As control, γδ T cells were plated onto RAW264.7 cells and washed away immediately before harvesting the RAW264.7 cells for RNA isolation; n = 3 replicates/group. Data from a representative experiment of 3 independent experiments. Values are mean ±
sem.
*P < 0.05, **P < 0.01, and ***P < 0.001 by one-way ANOVA with Tukey’s post hoc test.
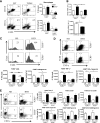
Figure 4.. HFD-fed TCR_δ_−/− mice have fewer proinflammatory macrophages in eAT after 5 weeks of HFD.
(A) Flow cytometric analysis of F4/80+CD11b+ macrophages and F4/80+CD11c+ M1 macrophages in eAT of 5-week-old WT and TCR_δ_−/− mice at baseline before starting on HFD. Data are represented as number of cells/fat pads and number of cells/fat pads/gram fat; n = pool of eAT from 5 mice, 2–3 pools/group. (B) F4/80 mRNA expression in eAT of TCR_δ_−/− and TCR_δ_+/+ mice after 5 weeks of ND or HFD (n = 6–9 mice in each group) and in eAT of HFD-fed C57BL/6J mice treated with IgG isotype control antibody or anti-TCR_γδ_ antibody (n = 5 mice in each group). *P < 0.05 by Student’s t_-test, as determined by qPCR analysis. (C–E) Flow cytometric analysis of SVF cells in eAT of TCR_δ_−/− and TCR_δ+/+ mice after 5 weeks of ND or HFD. (C) Total F4/80+ macrophages, represented as percentage of cells within macrophage gate based on scatter pattern, (D) TNF-α+ macrophages, and (E) F4/80+CD11c+CD206– M1, F4/80+CD11c–CD206+ M2, and F4/80+CD11c–CD206– DN macrophages; n = 6–9 mice in each group. Data from a representative experiment of 2 independent experiments. Data are represented as number of cells/fat pads and number of cells/fat pads/gram of fat and as a percentage of macrophages. Values are mean ±
sem.
*P < 0.05, **P < 0.01, and ***P < 0.001 by one-way ANOVA with Tukey’s post hoc test. Numbers inside boxes refer to percent of cells, and *P < 0.05 comparing HFD-fed groups of mice.
Figure 5.. Quantification of macrophages in eAT of TCR_δ_−/− mice after 10 weeks of HFD.
(A) mRNA expression of F4/80 and CD11c in eAT of TCR_δ_−/− and TCR_δ_+/+ mice after 10 weeks of ND or HFD, as determined by qPCR analysis; n = 5–6 mice in each group. (B–D) Flow cytometric analysis of SVF cells in eAT of TCR_δ_−/− and WT mice after 10 weeks of ND or HFD. (B) Total F4/80+ macrophages, represented as percentage of cells within macrophage gate based on scatter pattern, (C) TNF-α+ macrophages, and (D) F4/80+CD11c+CD206– M1, F4/80+CD11c–CD206+ M2, and F4/80+CD11c–CD206– DN macrophages; n = 4–5 mice in each group. Data from a representative experiment of 2 independent experiments. Data are represented as number of cells/fat pads and number of cells/fat pads/gram of fat. Values are mean ±
sem.
*P < 0.05, **P < 0.01, and ***P < 0.001 by one-way ANOVA with Tukey’s post hoc test.
Figure 6.. HFD-fed V_γ_4/6−/− mice have increased CD206+ M2 macrophages in eAT.
(A) Quantification of γδ T cells in eAT of V_γ_4/6−/− and WT mice after 5 weeks of ND or HFD by flow cytometry analysis (n = 4–5 mice in each group; data from a representative experiment of 3 independent experiments) and PCR analysis to determine the γ and δ TCR chains expressed in eAT of V_γ_4/6−/− mice after 5 weeks of HFD (representative gel picture of at least 3 repeat experiments). (B) mRNA expression of F4/80 in eAT of V_γ_4/6−/− and WT mice after 5 weeks of ND or HFD, as determined by qPCR; n = 4–6 mice in each group. (C–E) Flow cytometric analysis of SVF cells in eAT of V_γ_4/6−/− and WT mice after 5 weeks of ND or HFD. (C) Total F4/80+ macrophages, (D) F4/80+CD11c+CD206– M1, F4/80+CD11c–CD206+ M2, and F4/80+CD11c–CD206– DN macrophages, and (E) TNF-α+ macrophages; n = 4–5 mice in each group. Data from a representative experiment of 3 independent experiments. (F) mRNA expression of F4/80 and CD11c in eAT of V_γ_4/6−/− and WT mice after 10 weeks of ND or HFD, as determined by qPCR; n = 4–6 mice in each group. (G–I) Flow cytometric analysis of SVF cells in eAT of V_γ_4/6−/− and WT mice after 10 weeks of ND or HFD. (G) Total F4/80+ macrophages, (H) TNF-α+ macrophages, and (I) F4/80+CD11c+CD206– M1, F4/80+CD11c–CD206+ M2, and F4/80+CD11c–CD206– DN macrophages; n = 4–5 mice in each group. Data from a representative experiment of 2 independent experiments. Data are represented as number of cells/fat pads and number of cells/fat pads/gram of fat and as a percentage of macrophages. Values are mean ±
sem.
*P < 0.05, **P < 0.01, and ***P < 0.001 by one-way ANOVA with Tukey’s post hoc test. Numbers inside boxes refer to percent of cells, arrow points to value of double negative quadrant, and *P < 0.05, and **P < 0.01 comparing WT and V_γ_4/6−/− mice on the same diet.
Figure 7.. Obese TCR_δ_−/− mice but not V_γ_4/6−/− mice are more insulin sensitive than WT mice.
(A) Fasting insulin levels in plasma of nonlittermates TCR_δ_−/− and WT mice on 5 weeks of ND or HFD after a 6 h fast; n = 5–6 mice in each group. (B) Fasting blood glucose levels and (C) blood glucose levels during ITT (0.75 U insulin/kg body weight) of TCR_δ_−/− and TCR_δ_+/+ mice on 10 weeks of ND or HFD after a 6 h fast; n = 8–11 mice in each group. (D) Fasting plasma insulin levels of V_γ_4/6−/− and WT mice on 5 weeks of ND or HFD after a 6 h fast; n = 4 mice in each group. (E) Fasting blood glucose levels and (F) blood glucose levels during ITT (0.75 U insulin/kg body weight) of V_γ_4/6−/− and WT mice on 10 weeks of ND or HFD after a 6 h fast; n = 4 mice in each group. Values are mean ±
sem
, (A and D) *P < 0.05, and **P < 0.01 by one-way ANOVA with Tukey's post hoc test. (C and F) *P < 0.05 by two-way ANOVA with Bonferroni’s post hoc test.
Figure 8.. Obese TCR_δ_−/− mice have reduced inflammation in skeletal muscle and liver after long-term HFD.
(A) mRNA expression of TNF-α, CCL2, and F4/80 in soleus muscle of TCR_δ_−/− and TCR_δ_+/+ mice after 10 weeks of ND or HFD, as determined by qPCR analysis; n = 5–6 mice in each group. *P < 0.05 by one-way ANOVA with Tukey’s post hoc test. (B) mRNA expression of CCL2, F4/80, and IL-6 in liver of TCR_δ_−/− and WT mice after 24 weeks on HFD; n = 5–6 mice in each group. *P < 0.05, and **P < 0.01 by Student’s _t_-test. (C) Flow cytometry analysis of CD3+GL3+ γδ T cells in liver of male C57BL/6J mice after 5 weeks of ND (white bars) or HFD (black bars). Data are represented as total number of γδ T cells in liver/mouse; n = 7–8 mice in each group. *P < 0.05 by Student’s _t_-test. Values are mean ±
sem
.
Similar articles
- Attenuated adipose tissue and skeletal muscle inflammation in obese mice with combined CD4+ and CD8+ T cell deficiency.
Khan IM, Dai Perrard XY, Perrard JL, Mansoori A, Wayne Smith C, Wu H, Ballantyne CM. Khan IM, et al. Atherosclerosis. 2014 Apr;233(2):419-428. doi: 10.1016/j.atherosclerosis.2014.01.011. Epub 2014 Jan 21. Atherosclerosis. 2014. PMID: 24530773 Free PMC article. - Intermuscular and perimuscular fat expansion in obesity correlates with skeletal muscle T cell and macrophage infiltration and insulin resistance.
Khan IM, Perrard XY, Brunner G, Lui H, Sparks LM, Smith SR, Wang X, Shi ZZ, Lewis DE, Wu H, Ballantyne CM. Khan IM, et al. Int J Obes (Lond). 2015 Nov;39(11):1607-18. doi: 10.1038/ijo.2015.104. Epub 2015 Jun 4. Int J Obes (Lond). 2015. PMID: 26041698 Free PMC article. - Evidence for the opposing roles of different gamma delta T cell subsets in macrophage homeostasis.
Tramonti D, Andrew EM, Rhodes K, Newton DJ, Carding SR. Tramonti D, et al. Eur J Immunol. 2006 Jul;36(7):1729-38. doi: 10.1002/eji.200635959. Eur J Immunol. 2006. PMID: 16783854 - Fats, inflammation and insulin resistance: insights to the role of macrophage and T-cell accumulation in adipose tissue.
Harford KA, Reynolds CM, McGillicuddy FC, Roche HM. Harford KA, et al. Proc Nutr Soc. 2011 Nov;70(4):408-17. doi: 10.1017/S0029665111000565. Epub 2011 Aug 12. Proc Nutr Soc. 2011. PMID: 21835098 Review. - An update on immune dysregulation in obesity-related insulin resistance.
Daryabor G, Kabelitz D, Kalantar K. Daryabor G, et al. Scand J Immunol. 2019 Apr;89(4):e12747. doi: 10.1111/sji.12747. Epub 2019 Jan 29. Scand J Immunol. 2019. PMID: 30593678 Review.
Cited by
- The obesity-breast cancer link: a multidisciplinary perspective.
Devericks EN, Carson MS, McCullough LE, Coleman MF, Hursting SD. Devericks EN, et al. Cancer Metastasis Rev. 2022 Sep;41(3):607-625. doi: 10.1007/s10555-022-10043-5. Epub 2022 Jun 25. Cancer Metastasis Rev. 2022. PMID: 35752704 Free PMC article. Review. - γδ T Cells Modulate Myeloid Cell Recruitment but Not Pain During Peripheral Inflammation.
Petrović J, Silva JR, Bannerman CA, Segal JP, Marshall AS, Haird CM, Gilron I, Ghasemlou N. Petrović J, et al. Front Immunol. 2019 Mar 18;10:473. doi: 10.3389/fimmu.2019.00473. eCollection 2019. Front Immunol. 2019. PMID: 30936874 Free PMC article. - Innate immunity and early liver inflammation.
Yang Zhou J. Yang Zhou J. Front Immunol. 2023 May 2;14:1175147. doi: 10.3389/fimmu.2023.1175147. eCollection 2023. Front Immunol. 2023. PMID: 37205101 Free PMC article. Review. - Innate T Cells Govern Adipose Tissue Biology.
LaMarche NM, Kohlgruber AC, Brenner MB. LaMarche NM, et al. J Immunol. 2018 Oct 1;201(7):1827-1834. doi: 10.4049/jimmunol.1800556. J Immunol. 2018. PMID: 30224362 Free PMC article. Review. - Ketogenesis activates metabolically protective γδ T cells in visceral adipose tissue.
Goldberg EL, Shchukina I, Asher JL, Sidorov S, Artyomov MN, Dixit VD. Goldberg EL, et al. Nat Metab. 2020 Jan;2(1):50-61. doi: 10.1038/s42255-019-0160-6. Epub 2020 Jan 20. Nat Metab. 2020. PMID: 32694683 Free PMC article.
References
- Hotamisligil G. S. (2006) Inflammation and metabolic disorders. Nature 444, 860–867. - PubMed
- Greenberg A. S., Obin M. S. (2006) Obesity and the role of adipose tissue in inflammation and metabolism. Am. J. Clin. Nutr. 83, 461S–465S. - PubMed
Publication types
MeSH terms
Substances
LinkOut - more resources
Full Text Sources
Other Literature Sources
Medical
Molecular Biology Databases
Research Materials
Miscellaneous
