Loss of functional MYO1C/myosin 1c, a motor protein involved in lipid raft trafficking, disrupts autophagosome-lysosome fusion - PubMed (original) (raw)
Loss of functional MYO1C/myosin 1c, a motor protein involved in lipid raft trafficking, disrupts autophagosome-lysosome fusion
Hemma Brandstaetter et al. Autophagy. 2014.
Abstract
MYO1C, a single-headed class I myosin, associates with cholesterol-enriched lipid rafts and facilitates their recycling from intracellular compartments to the cell surface. Absence of functional MYO1C disturbs the cellular distribution of lipid rafts, causes the accumulation of cholesterol-enriched membranes in the perinuclear recycling compartment, and leads to enlargement of endolysosomal membranes. Several feeder pathways, including classical endocytosis but also the autophagy pathway, maintain the health of the cell by selective degradation of cargo through fusion with the lysosome. Here we show that loss of functional MYO1C leads to an increase in total cellular cholesterol and its disrupted subcellular distribution. We observe an accumulation of autophagic structures caused by a block in fusion with the lysosome and a defect in autophagic cargo degradation. Interestingly, the loss of MYO1C has no effect on degradation of endocytic cargo such as EGFR, illustrating that although the endolysosomal compartment is enlarged in size, it is functional, contains active hydrolases, and the correct pH. Our results highlight the importance of correct lipid composition in autophagosomes and lysosomes to enable them to fuse. Ablating MYO1C function causes abnormal cholesterol distribution, which has a major selective impact on the autophagy pathway.
Keywords: BafA1, bafilomycin A1; EGF, epidermal growth factor; EGFR, epidermal growth factor receptor; EM, electron microscopy; GFP, green fluorescent protein; KD, knockdown; LAMP1, lysosomal-associated membrane protein 1; LC3, microtubule-associated protein 1 light chain 3; MVB, multivesicular body; MYO1C, myosin IC; PB, phosphate buffer; PCIP, pentachloropseudilin; PtdIns(4, 5)P2, phosphatidylinositol 4, 5-bisphosphate; RFP, red fluorescent protein; RPE, retinal pigment epithelium; autophagy; cholesterol; electron microscopy; lipid raft; lysosome, MYO1C.
Figures
Figure 1
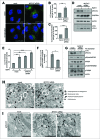
(See previous page). MYO1C depletion by siRNA causes accumulation of LC3-positive autophagosomes. (A) HeLa cells mock transfected or transfected with siRNA specific to MYO1C were either cultured under normal growth conditions or amino acid starved for 2 h, and were labeled with antibodies to endogenous LC3 for immunofluorescence microscopy. Bars = 10 μm. (B, C) LC3-positive puncta were quantified by high-throughput microscopy. Automated imaging and analysis software was used to calculate the puncta area (B) and fluorescence (C) per cell. A significant increase in the LC3-puncta area and fluorescence was observed in MYO1C siRNA-treated cells as compared to control cells. A total number of >50 ,000 cells from 3 independent experiments were analyzed. (D) For immunoblot analysis, control and MYO1C-depleted HeLa cells were either left untreated or treated with 100 nM bafilomycin A1 (BafA1) for 2 h. A representative blot is shown. (E) Quantification of protein gel blots from 3 independent knockdown experiments revealed an increase in LC3-II intensity upon MYO1C knockdown. (F) To determine the effect of MYO1C depletion on autophagosome biogenesis, the fold increase in normalized LC3-II intensity from bafilomycin A1-treated to untreated samples was calculated. Graphs represent the means ± s.e.m. (G) Control and MYO1C siRNA-depleted HeLa cells were amino acid starved for 2 h prior to processing for western blot analysis of MTOR signaling. (H) HeLa cells were cultured for 2 h in starvation medium and analyzed by conventional electron microscopy. Arrowheads highlight the presence of different autophagic and endocytic organelles. Bar = 500 nm. (I) Mock-treated and MYO1C-knockdown cells were labeled for immuno-electron microscopy using anti-LC3 antibodies. Bar = 500 nm.
Figure 2
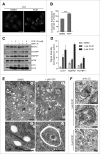
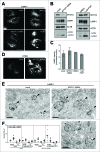
(See previous page). Inhibition of MYO1C function by the small molecule inhibitor PCIP causes accumulation of LC3-positive autophagosomes. (A) HeLa cells were incubated with 2 μM of the MYO1 inhibitor PCIP or equivalent amounts of DMSO for 16 h and processed for confocal microscopy using antibodies against endogenous LC3. (B) LC3-positive vesicles in control and PClP-treated cells were quantified by high-throughput microscopy. Automated imaging and analysis software revealed a significant increase in the LC3 puncta fluorescence per cell upon PClP treatment. A total number of >41 ,000 cells from 3 independent experiments, each performed in duplicate, were analyzed. (C) Western blot analysis of HeLa cell lysates treated with PCIP for 16 h in the absence or presence of 100 nM bafilomycin A1. (D) Quantification of LC3-II, SQSTM1, and TAX1BP1 protein expression from protein gel blots of PCIP-treated HeLa cells revealed a dose-dependent increase in LC3-II, SQSTM1, and TAX1BP1 levels. Results represent the mean (+/− s.d.) from >3 independent experiments. (E) Conventional electron microscopy of HeLa cells treated with 1 μM PCIP for 16 h. Panels (b) and (d) represent enlarged boxed regions in (a) and (b). Double arrows indicate autophagosomes and phagophores. Scale bar = 500 nm. (F) HeLa cells treated with PCIP for 16 h were labeled for immuno-electron microscopy using anti-LC3 antibodies. Scale bar = 500 nm.
Figure 3
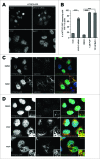
(See previous page). Protein aggregate clearance by selective autophagy requires MYO1C. (A) HeLa cells stably expressing HTTQ72-GFP were transfected with siRNA targeting MYO1C or treated with 1 μM PCIP, alongside appropriate controls, and labeled for immunofluorescence using antibodies to GFP. Bar = 10 μm. (B) HTTQ72-GFP aggregates were quantified in mock-, MYO1C siRNA-, DMSO-, 1 μM PCIP-, and 100 nM bafilomycin A1-treated cells. The results are represented as the percentage of HTTQ72-GFP-expressing cells with more than 15 GFP-positive spots per cell. MYO1C knockdown and PCIP treatment lead to a significant increase in the number of cells containing HTTQ72-GFP aggregates. Graphs represent the means ± s.e.m from 3 independent experiments. A total number of >3900 cells was analyzed. (C) HeLa cells stably expressing HTTQ72-GFP were treated with 100 nM bafilomycin A1 for 16 h prior to processing for immunofluorescence microscopy. Scale bar = 20 μm. (D) HeLa cells stably expressing HTTQ72-GFP were treated with 1 μM PCIP for 16 h prior to processing for immunofluorescence microscopy using antibodies to the indicated proteins. Nuclei in blue were labeled with Hoechst. Scale bar = 20 μm.
Figure 4.
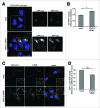
MYO1C depletion leads to defects in autophagosome-lysosome fusion. (A) HeLa cells stably expressing the RFP-GFP-LC3 reporter were either mock- or MYO1C siRNA-transfected and analyzed by confocal immunofluorescence. Single channel images of boxed regions are indicated to the right of merged color image. Cell nuclei are shown in blue. Bars = 10 μm. (B) The GFP/RFP signal overlap from confocal images of control and MYO1C knockdown cells expressing RFP-GFP-LC3 is represented as the Pearson's coefficient. A total number of >1000 cells from 3 independent experiments were analyzed. (C) Control and MYO1C siRNA-treated RPE cells stably expressing GFP–LC3 were stained with antibodies against GFP and CTSD for confocal microscopy. The inserts are enlarged representations of the boxed regions. Bars = 10 μm. (D) Quantification of GFP-LC3/CTSD signal overlap from confocal images of control and MYO1C knockdown RPE cells expressing GFP-LC3 is represented as the Pearson's coefficient. The decreased signal correlation in siRNA-treated cells confirms a role for MYO1C in autophagosome/lysosome fusion. Graph represents the means ± s.e.m.
Figure 5.
Effect of MYO1C knockdown on lysosome morphology. HeLa cells were either mock treated or transfected with MYO1C siRNA or incubated for 16 h with the MYO1 inhibitor PClP or equivalent amounts of DMSO as control before processing for confocal microscopy (A, D) or western blot analysis (B) using antibodies against the lysosomal marker proteins LAMP1 or the lysosomal protease CTSD. Bar = 10 μm. (C) Quantification of LAMP1 protein levels from protein gel blots following MYO1C siRNA depletion or PCIP treatment. Results represent the mean (+/− s.d.) from >3 independent experiments. (E) Mock-treated or MYO1C siRNA KD cells in complete medium were labeled for immuno-electron microscopy using anti-LAMP1 antibodies. Black arrowheads indicate LAMP1-positive amphisomes and the white arrowhead indicates a LAMP1-negative amphisome. Bar = 500 nm. (F) Graph showing the quantification of the number of LAMP1-positive or -negative lysosomes (Ly) or amphisomes (Am)/endolysosomes (EL) from at least 56 randomly selected areas, from each cell, for each condition in control or MYO1C KD cells growing in complete medium or under starvation conditions. Each data point indicates one cell.
Figure 6
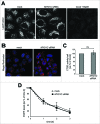
(See previous page). Analysis of lysosome function in MYO1C-depleted cells. (A) Mock, MYO1C-depleted cells, and bafilomycin A1-treated cells were incubated with the LysoTracker Red probe and imaged using live cell microscopy to monitor lysosomal pH. Swollen lysosomes in MYO1C knockdown cell appear to be acidic. (B) To determine lysosomal enzyme activity in live cells control and MYO1C-depleted HeLa cells were incubated with Magic Red. Confocal microscopy was used to image cathepsin–associated hydrolysis of Magic Red into its red fluorescent form. (C) Calculation of cathepsin activity using Volocity Imaging software revealed no significant difference between cathepsin activity in control and MYO1C-knockdown cells. Values are means ± s.e.m from 3 independent experiments (>1900 cells). ns, not significant. (D) To measure EGFR degradation in control and MYO1C siRNA-treated HeLa cells, cells were serum-starved overnight, and incubated with 100 μg/ml cycloheximide for 2 h before stimulating with 100 ng/ml EGF for 0, 1, 2 and 3 h. EGFR levels were quantified from immunoblots and normalized to a loading control. No significant difference in the rate of EGFR degradation was observed in control and knockdown cells. Values are means ± s.e.m from 3 independent knockdown experiments.
Figure 7
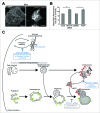
(See previous page). MYO1C-depleted cells contain more total cellular cholesterol, trapped in intracellular storage compartments. (A) Confocal z-projection microscopy images of cellular cholesterol, imaged with filipin, from mock and MYO1C siRNA-depleted HeLa cells. Scale bar = 20 μm (B) Total cholesterol levels in mock and MYO1C-knockdown cells and DMSO- and PClP-treated cells were quantified by high-throughput microscopy. Automated imaging and analysis software was used to calculate the total filipin fluorescence per cell. Loss of MYO1C caused a significant increase in cholesterol as compared to control cells. In total >149 ,000 cells from 3 independent experiments, each performed in triplicate, were analyzed. Graphs represent the means ± s.e.m. (C) Model of the autophagy and endocytic pathway highlighting defects (shown in blue) observed in MYO1C-depleted cells. Loss of functional MYO1C causes a defect in lipid raft recycling from the perinuclear recycling compartment back to the cell surface. This leads to intracellular accumulation of cholesterol-enriched membranes. In the classical endocytic pathway, incoming cargo first moves through early endosomes, which then acquire an increasing number of intralumenal vesicles and mature into late endosomes (LE)/multivesicular bodies (MVB). The fusion of a LE/MVB with a lysosome generates a transient hybrid organelle, the endolysosome, in which content degradation can take place. In MYO1C-depleted cells, we observe the accumulation of enlarged LAMP1- and CTSD-positive endolysosomes. In the autophagy pathway, cytosolic material is sequestered by expansion and closure of a phagophore, forming double-membrane vesicles called autophagosomes. These autophagosomes mature by fusion with early and late endosomes to form an intermediate organelle called the amphisome, which fuses with lysosomes to enable content degradation. Ablating MYO1C activity leads to an accumulation in the number of autophagic structures suggesting a block in fusion of autophagic organelles with lysosomes.
Similar articles
- Myosins, Actin and Autophagy.
Kruppa AJ, Kendrick-Jones J, Buss F. Kruppa AJ, et al. Traffic. 2016 Aug;17(8):878-90. doi: 10.1111/tra.12410. Epub 2016 May 31. Traffic. 2016. PMID: 27146966 Free PMC article. Review. - Myo1c regulates lipid raft recycling to control cell spreading, migration and Salmonella invasion.
Brandstaetter H, Kendrick-Jones J, Buss F. Brandstaetter H, et al. J Cell Sci. 2012 Apr 15;125(Pt 8):1991-2003. doi: 10.1242/jcs.097212. Epub 2012 Feb 10. J Cell Sci. 2012. PMID: 22328521 Free PMC article. - Downregulation of MYO1C mediated by cepharanthine inhibits autophagosome-lysosome fusion through blockade of the F-actin network.
Zhang Y, Jiang X, Deng Q, Gao Z, Tang X, Fu R, Hu J, Li Y, Li L, Gao N. Zhang Y, et al. J Exp Clin Cancer Res. 2019 Nov 7;38(1):457. doi: 10.1186/s13046-019-1449-8. J Exp Clin Cancer Res. 2019. PMID: 31699152 Free PMC article. - Vacuolin-1 potently and reversibly inhibits autophagosome-lysosome fusion by activating RAB5A.
Lu Y, Dong S, Hao B, Li C, Zhu K, Guo W, Wang Q, Cheung KH, Wong CW, Wu WT, Markus H, Yue J. Lu Y, et al. Autophagy. 2014;10(11):1895-905. doi: 10.4161/auto.32200. Epub 2014 Oct 30. Autophagy. 2014. PMID: 25483964 Free PMC article. - Autophagy and multivesicular bodies: two closely related partners.
Fader CM, Colombo MI. Fader CM, et al. Cell Death Differ. 2009 Jan;16(1):70-8. doi: 10.1038/cdd.2008.168. Epub 2008 Nov 14. Cell Death Differ. 2009. PMID: 19008921 Review.
Cited by
- Autophagosome-lysosome fusion is facilitated by plectin-stabilized actin and keratin 8 during macroautophagic process.
Son S, Baek A, Lee JH, Kim DE. Son S, et al. Cell Mol Life Sci. 2022 Jan 26;79(2):95. doi: 10.1007/s00018-022-04144-1. Cell Mol Life Sci. 2022. PMID: 35080691 Free PMC article. - Inhibiting Autophagy in Renal Cell Cancer and the Associated Tumor Endothelium.
Russell KL, Gorgulho CM, Allen A, Vakaki M, Wang Y, Facciabene A, Lee D, Roy P, Buchser WJ, Appleman LJ, Maranchie J, Storkus WJ, Lotze MT. Russell KL, et al. Cancer J. 2019 May/Jun;25(3):165-177. doi: 10.1097/PPO.0000000000000374. Cancer J. 2019. PMID: 31135523 Free PMC article. Review. - Targeting myosin 1c inhibits murine hepatic fibrogenesis.
Arif E, Wang C, Swiderska-Syn MK, Solanki AK, Rahman B, Manka PP, Coombes JD, Canbay A, Papa S, Nihalani D, Aspichueta P, Lipschutz JH, Syn WK. Arif E, et al. Am J Physiol Gastrointest Liver Physiol. 2021 Jun 1;320(6):G1044-G1053. doi: 10.1152/ajpgi.00105.2021. Epub 2021 Apr 28. Am J Physiol Gastrointest Liver Physiol. 2021. PMID: 33908271 Free PMC article. - Protein-Protein Interactions Suggest Novel Activities of Human Cytomegalovirus Tegument Protein pUL103.
Ortiz DA, Glassbrook JE, Pellett PE. Ortiz DA, et al. J Virol. 2016 Aug 12;90(17):7798-810. doi: 10.1128/JVI.00097-16. Print 2016 Sep 1. J Virol. 2016. PMID: 27334581 Free PMC article. - Myosins, Actin and Autophagy.
Kruppa AJ, Kendrick-Jones J, Buss F. Kruppa AJ, et al. Traffic. 2016 Aug;17(8):878-90. doi: 10.1111/tra.12410. Epub 2016 May 31. Traffic. 2016. PMID: 27146966 Free PMC article. Review.
References
- Weidberg H, Shvets E, Elazar Z. Biogenesis and cargo selectivity of autophagosomes. Annu Rev Biochem 2011; 80:125-56; PMID:21548784; http://dx.doi.org/10.1146/annurev-biochem-052709-094552 - DOI - PubMed
- Mizushima N, Komatsu M. Autophagy: renovation of cells and tissues. Cell 2011; 147:728-41; PMID:22078875; http://dx.doi.org/10.1016/j.cell.2011.10.026 - DOI - PubMed
- Mizushima N, Yoshimori T, Levine B. Methods in mammalian autophagy research. Cell 2010; 140:313-26; PMID:20144757; http://dx.doi.org/10.1016/j.cell.2010.01.028 - DOI - PMC - PubMed
- Koga H, Kaushik S, Cuervo AM. Altered lipid content inhibits autophagic vesicular fusion. FASEB J 2010; 24:3052-65; PMID:20375270; http://dx.doi.org/10.1096/fj.09-144519 - DOI - PMC - PubMed
- Fraldi A, Annunziata F, Lombardi A, Kaiser HJ, Medina DL, Spampanato C, Fedele AO, Polishchuk R, Sorrentino NC, Simons K, et al. . Lysosomal fusion and SNARE function are impaired by cholesterol accumulation in lysosomal storage disorders. EMBO J 2010; 29:3607-20; PMID:20871593; http://dx.doi.org/10.1038/emboj.2010.237 - DOI - PMC - PubMed
Publication types
MeSH terms
Substances
LinkOut - more resources
Full Text Sources
Other Literature Sources
Research Materials
Miscellaneous
