A distinct subtype of dopaminergic interneuron displays inverted structural plasticity at the axon initial segment - PubMed (original) (raw)
A distinct subtype of dopaminergic interneuron displays inverted structural plasticity at the axon initial segment
Annisa N Chand et al. J Neurosci. 2015.
Abstract
The axon initial segment (AIS) is a specialized structure near the start of the axon that is a site of neuronal plasticity. Changes in activity levels in vitro and in vivo can produce structural AIS changes in excitatory cells that have been linked to alterations in excitability, but these effects have never been described in inhibitory interneurons. In the mammalian olfactory bulb (OB), dopaminergic interneurons are particularly plastic, undergoing constitutive turnover throughout life and regulating tyrosine hydroxylase expression in an activity-dependent manner. Here we used dissociated cultures of rat and mouse OB to show that a subset of bulbar dopaminergic neurons possess an AIS and that these AIS-positive cells are morphologically and functionally distinct from their AIS-negative counterparts. Under baseline conditions, OB dopaminergic AISs were short and located distally along the axon but, in response to chronic 24 h depolarization, lengthened and relocated proximally toward the soma. These activity-dependent changes were in the opposite direction to both those we saw in non-GABAergic OB neurons and those reported previously for excitatory cell types. Inverted AIS plasticity in OB dopaminergic cells was bidirectional, involved all major components of the structure, was dependent on the activity of L-type CaV1 calcium channels but not on the activity of the calcium-activated phosphatase calcineurin, and was opposed by the actions of cyclin-dependent kinase 5. Such distinct forms of AIS plasticity in inhibitory interneurons and excitatory projection neurons may allow considerable flexibility when neuronal networks must adapt to perturbations in their ongoing activity.
Keywords: axon initial segment; dopamine; interneuron; olfactory bulb; plasticity.
Copyright © 2015 Chand et al.
Figures
Figure 1.
Subtypes of dopaminergic cells in dissociated rat OB culture can be defined based on the presence or absence of an AIS. A, Example images of dopaminergic neurons in OB cultures stained for TH, GABA, and ankyrin-G (AnkG). AIS− cells (top) lack AnkG staining; AIS+ cells (bottom) have a clear AnkG-defined axonal region. Lines show axon start; arrowheads show AIS start and end positions; asterisks show AISs of non-dopaminergic neighboring neurons. Scale bars, 20 μm. B, Histogram of soma area. C, Scatter plot of AIS start position and length for OB dopaminergic neurons in control conditions. Each dot represents one cell; Spearman's correlation, *p < 0.05.
Figure 2.
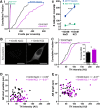
Functional differences between AIS− and AIS+ OB dopaminergic neurons. A, Example maximum intensity projection images of wild-type (WT) mouse OB dopaminergic neurons costained for TH and ankyrin-G (AnkG). AIS− cells (left) lack AnkG staining; AIS+ cells (right) have a clear AnkG-defined axonal region. In these and all subsequent images, lines show axon start; arrowheads show AIS start and end positions. Scale bars, 20 μm. B, Example maximum intensity projection image of a tdT-expressing neuron from a TH–Cre × Rosa–Tdt mouse OB culture, colabeled for TH. C, Example maximum intensity projection images of TH–tdT neurons costained for AnkG. AIS− cells (left) lack AnkG staining; AIS+ cells (right) have a clear AnkG-defined axonal region. Asterisk shows the AIS of a tdT− neighboring cell. D, Example current-clamp traces from monophasic (AIS−; top) or biphasic (AIS+; bottom) TH–tdT neurons. i, Action potentials fired to threshold 10 ms somatic current injection. ii, Phase plane plots of the spikes shown in i. Arrow points to the AIS-dependent first action potential phase. iii, Action potentials fired at maximum frequency to 500 ms somatic current injection. E, Histogram of soma area. F–I, Cumulative distributions and mean ± SEM plots (insets) for voltage threshold (_V_thresh; F), onset rapidness (OR; G), maximum frequency (Max. freq.; H), and interstimulus interval CV (ISI CV; I) in monophasic (M) and biphasic (B) TH–tdT neurons. t test (F, H) or Mann–Whitney test (G, I), *p < 0.05, ***p < 0.001.
Figure 3.
Inverted structural AIS plasticity in OB dopaminergic neurons. A, Example maximum intensity projection images of rat TH+ neurons costained for ankyrin-G (AnkG) after 24 h treatment in control (10 m
m
NaCl) or depolarizing (10 m
m
KCl) conditions. Lines show axon start; arrowheads show AIS start and end positions. Scale bars, 20 μm. B, AIS plot shows the mean ± SEM AIS start and end positions for each group. Mann–Whitney test, ***p < 0.001. C, Cumulative distributions and mean ± SEM plots (insets) for AIS start position, end position, and length for each group. Mann–Whitney test, ***p < 0.001.
Figure 4.
Activity-dependent TH expression does not account for AIS plasticity in OB dopaminergic neurons. A, Cumulative distributions (i) and mean ± SEM plots (ii) of TH+ cell number. Mann–Whitney test, **p < 0.01; Welch's corrected t test, ***p < 0.0001. B, Example maximum intensity projection images of AIS+ TH-expressing neurons in control (10 m
m
NaCl) and depolarizing (10 m
m
KCl) conditions. Scale bars, 10 μm. C, Cumulative distributions and mean ± SEM plot (inset) for TH intensity in each group. Mann–Whitney test, *p < 0.05. D, E, Scatter plots of TH intensity versus AIS start position (D) or length (E). Each dot represents one cell. Spearman's correlation; ns, nonsignificant.
Figure 5.
Standard AIS plasticity in non-GABAergic OB neurons. A, Example maximum intensity projection images show ankyrin-G (AnkG)-positive AISs in rat GABA− OB neurons in 24 h control and depolarized conditions. Asterisks highlight non-GABAergic cell bodies. Lines show axon start; arrowheads show AIS start and end positions. Scale bars, 20 μm. B, AIS plots show the mean ± SEM AIS start and end positions for each group. Mann–Whitney test, ***p < 0.001. C, Cumulative distributions and mean ± SEM plots (insets) for AIS start position, end position, and length for each group. Mann–Whitney test, ***p < 0.001.
Figure 6.
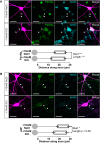
Inverted AIS plasticity also occurs in the sodium channel and neurofascin distributions of OB dopaminergic neurons. A, Example maximum intensity projection images (top) of TH+ rat OB neurons costained for all NaV1 subunits (PanNaV) and ankyrin-G (AnkG) in 24 h control and depolarized conditions. Note the high background in AnkG staining attributable to pepsin treatment for PanNaV antigen retrieval (see Materials and Methods). In these and all subsequent images, lines show axon start; arrowheads show AIS start and end positions. Scale bars, 20 μm. AIS plots (bottom) show the mean ± SEM AIS start and end positions for each group. Mann–Whitney test, ***p < 0.001. B, Example maximum intensity projection images (top) of TH+ rat OB neurons costained for an extracellular epitope of neurofascin (eNF) and AnkG in 24 h control and depolarized conditions. AIS plots (bottom) show the mean ± SEM AIS start and end positions for each group. Mann–Whitney test, *p < 0.05.
Figure 7.
Bidirectional AIS plasticity in OB dopaminergic neurons. A, Example maximum intensity projection images (left) and AIS plots (right) of rat OB neurons depolarized for 1 d and then either returned to control conditions (recovery) or subjected to continued high potassium treatment for an additional 1 or 5 d. Note the high background in AnkG staining attributable to pepsin treatment for concurrent PanNaV label (see Materials and Methods, Results). In these and subsequent images, lines show axon start; arrowheads show AIS start and end positions. Scale bars, 20 μm. Dunn's post hoc test following Kruskal-Wallis one-way ANOVA, ***p < 0.001 versus 10 m
m
NaCl 24 h; ##p < 0.01 and ###p < 0.001 versus 10 m
m
KCl 24 h; ns, nonsignificant versus both 10 m
m
NaCl 24 h and 10 m
m
KCl 24 h. B, Example maximum intensity projection images (left) and AIS plots (right) of control (no drug) or 24 h TTX-treated rat OB neurons. Mann–Whitney test, **p < 0.01; ns, nonsignificant.
Figure 8.
Inverted AIS plasticity in OB dopaminergic neurons from wild-type and TH–tdT mice. A, Example maximum intensity projection images (left) of wild-type (WT) mouse OB neurons colabeled for TH and ankyrin-G (AnkG) after 24 h control or depolarizing treatment. In this and all subsequent images, lines show axon start; arrowheads show AIS start and end positions. Scale bars, 20 μm. AIS plots (right) show the mean ± SEM AIS start and end positions for each group. Mann–Whitney test, ***p < 0.001. B, Example maximum intensity projection images (left) and AIS plots (right) of TH–Tdt+ neurons after 24 h control or depolarization treatment. Mann–Whitney test, ***p < 0.001; ns, nonsignificant.
Figure 9.
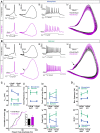
Action potential properties of AIS+ and AIS− OB dopaminergic cells after 24 h control or depolarization treatment. A, B, Example current-clamp traces from monophasic (A) or biphasic (B) TH–tdT neurons after 24 h 10 m
m
NaCl or KCl treatment. i, Action potentials fired to threshold 10 ms somatic current injection. ii, Phase plane plots of the spikes shown in i. iii, Action potentials fired at maximum frequency to 500 ms somatic current injection. iv, Overlaid mean ± SEM phase plane plots from each treatment group. Arrows point to the AIS-dependent first action potential phase in biphasic neurons. C, Comparisons of single spike properties. i–v, Plots of the mean ± SEM for all groups. i, Voltage threshold (_V_thresh); ii, onset rapidness; iv, peak rate-of-rise; v, peak voltage (V). iii, Cumulative fraction plot and mean ± SEM plot (inset) for first phase peak amplitude in biphasic neurons. D, Comparisons of multiple spiking properties. Plots of mean ± SEM for all groups. i, Maximum firing frequency; ii, CV in interspike interval (ISI).
Figure 10.
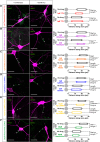
Signaling pathways for AIS plasticity in rat OB dopaminergic neurons. Example maximum intensity projection images (left) show colabel for TH and ankyrin-G (AnkG) in 24 h control and depolarized conditions in the presence of various pharmacological agents: A, TTX for voltage-gated sodium channels; B, nifedipine for L-type CaV1 calcium channels; C, FK-506 for calcineurin; D, tatCN21 for CaMKII; E, Rp-cAMPs for PKA; F, roscovitine for cdk5. Lines show axon start; arrowheads show AIS start and end positions. Scale bars, 20 μm. AIS plots (right) show the mean ± SEM AIS start and end positions for each group in a 2 × 2 treatment × drug design. Post hoc pairwise comparisons between control and drug conditions in both treatment groups are reported when there was a significant treatment × drug interaction in a two-way ANOVA on ranks (A, B, F); Mann–Whitney test with Bonferroni's correction, **p < 0.01, ***p < 0.001; ns, nonsignificant. Otherwise, two-way ANOVA effects of treatment and drug across all groups are reported (C, D, E); *p < 0.05; **p < 0.01; ***p < 0.001; ns, nonsignificant.
Similar articles
- Brief Sensory Deprivation Triggers Cell Type-Specific Structural and Functional Plasticity in Olfactory Bulb Neurons.
Galliano E, Hahn C, Browne LP, R Villamayor P, Tufo C, Crespo A, Grubb MS. Galliano E, et al. J Neurosci. 2021 Mar 10;41(10):2135-2151. doi: 10.1523/JNEUROSCI.1606-20.2020. Epub 2021 Jan 22. J Neurosci. 2021. PMID: 33483429 Free PMC article. - Calcineurin signaling mediates activity-dependent relocation of the axon initial segment.
Evans MD, Sammons RP, Lebron S, Dumitrescu AS, Watkins TB, Uebele VN, Renger JJ, Grubb MS. Evans MD, et al. J Neurosci. 2013 Apr 17;33(16):6950-63. doi: 10.1523/JNEUROSCI.0277-13.2013. J Neurosci. 2013. PMID: 23595753 Free PMC article. - Embryonic and postnatal neurogenesis produce functionally distinct subclasses of dopaminergic neuron.
Galliano E, Franzoni E, Breton M, Chand AN, Byrne DJ, Murthy VN, Grubb MS. Galliano E, et al. Elife. 2018 Apr 20;7:e32373. doi: 10.7554/eLife.32373. Elife. 2018. PMID: 29676260 Free PMC article. - Neuronal organization of the main olfactory bulb revisited.
Kosaka T, Kosaka K. Kosaka T, et al. Anat Sci Int. 2016 Mar;91(2):115-27. doi: 10.1007/s12565-015-0309-7. Epub 2015 Oct 29. Anat Sci Int. 2016. PMID: 26514846 Review. - Adult Born Olfactory Bulb Dopaminergic Interneurons: Molecular Determinants and Experience-Dependent Plasticity.
Bonzano S, Bovetti S, Gendusa C, Peretto P, De Marchis S. Bonzano S, et al. Front Neurosci. 2016 May 6;10:189. doi: 10.3389/fnins.2016.00189. eCollection 2016. Front Neurosci. 2016. PMID: 27199651 Free PMC article. Review.
Cited by
- Illuminating and Sniffing Out the Neuromodulatory Roles of Dopamine in the Retina and Olfactory Bulb.
Korshunov KS, Blakemore LJ, Trombley PQ. Korshunov KS, et al. Front Cell Neurosci. 2020 Aug 31;14:275. doi: 10.3389/fncel.2020.00275. eCollection 2020. Front Cell Neurosci. 2020. PMID: 33110404 Free PMC article. Review. - Synaptic determinants of cholinergic interneurons hyperactivity during parkinsonism.
Padilla-Orozco M, Duhne M, Fuentes-Serrano A, Ortega A, Galarraga E, Bargas J, Lara-González E. Padilla-Orozco M, et al. Front Synaptic Neurosci. 2022 Sep 6;14:945816. doi: 10.3389/fnsyn.2022.945816. eCollection 2022. Front Synaptic Neurosci. 2022. PMID: 36147730 Free PMC article. - Homeostatic Plasticity of Subcellular Neuronal Structures: From Inputs to Outputs.
Wefelmeyer W, Puhl CJ, Burrone J. Wefelmeyer W, et al. Trends Neurosci. 2016 Oct;39(10):656-667. doi: 10.1016/j.tins.2016.08.004. Epub 2016 Sep 13. Trends Neurosci. 2016. PMID: 27637565 Free PMC article. Review. - Tracking axon initial segment plasticity using high-density microelectrode arrays: A computational study.
Kumar SS, Gänswein T, Buccino AP, Xue X, Bartram J, Emmenegger V, Hierlemann A. Kumar SS, et al. Front Neuroinform. 2022 Oct 3;16:957255. doi: 10.3389/fninf.2022.957255. Front Neuroinform. 2022. PMID: 36221258 Free PMC article. - Type 2 Diabetes Leads to Axon Initial Segment Shortening in db/db Mice.
Yermakov LM, Drouet DE, Griggs RB, Elased KM, Susuki K. Yermakov LM, et al. Front Cell Neurosci. 2018 Jun 8;12:146. doi: 10.3389/fncel.2018.00146. eCollection 2018. Front Cell Neurosci. 2018. PMID: 29937715 Free PMC article.
References
- Akritas MG. The rank transform method in some two-factor designs. J Am Stat Assoc. 1990;85:73–78. doi: 10.1080/01621459.1990.10475308. - DOI
Publication types
MeSH terms
Substances
LinkOut - more resources
Full Text Sources
Miscellaneous


