The relationship of autophagy defects to cartilage damage during joint aging in a mouse model - PubMed (original) (raw)
The relationship of autophagy defects to cartilage damage during joint aging in a mouse model
Beatriz Caramés et al. Arthritis Rheumatol. 2015 Jun.
Abstract
Objective: Aging is a main risk factor for osteo arthritis (OA), the most prevalent musculoskeletal disorder. Defects in autophagy, an essential cellular homeostasis mechanism, have recently been observed in OA articular cartilage. The objectives of this study were to establish the constitutive level of autophagy activation in normal cartilage and to monitor the temporal relationship between changes in autophagy and aging-related degradation of cartilage in a mouse model.
Methods: In GFP-LC3-transgenic mice, green fluorescent protein (GFP)-light chain 3 (LC3) is ubiquitously expressed, and the accumulation of GFP puncta, representing autophagosomes, was quantified by confocal microscopy as a measure of autophagy activation. Expression of the autophagy proteins autophagy-related protein 5 (ATG-5) and microtubule-associated protein 1 light chain 3 (LC3) was analyzed by immunohistochemistry. Cartilage cellularity, apoptotic cell death, and cartilage structural damage and changes in synovium and bone were examined by histology and immunohistochemistry.
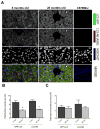
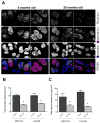
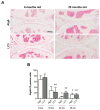
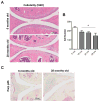
Results: Basal autophagy activation was detected in liver and knee articular cartilage from young (6-month-old) mice, with higher levels in cartilage than in liver in the same animals. In 28-month-old mice, there was a statistically significant reduction in the total number of autophagic vesicles per cell (P < 0.01) and in the total area of vesicles per cell (P < 0.01) in the articular cartilage as compared to that from young 6-month-old mice. With increasing age, the expression of ATG-5 and LC3 decreased, and this was followed by a reduction in cartilage cellularity and an increase in the apoptosis marker poly(ADP-ribose) polymerase p85. Cartilage structural damage progressed in an age-dependent manner subsequent to the autophagy changes.
Conclusion: Autophagy is constitutively activated in normal cartilage. This is compromised with aging and precedes cartilage cell death and structural damage.
© 2015, American College of Rheumatology.
Conflict of interest statement
The authors have no conflicts of interest.
Competing interests None.
Figures
Figure 1. Identification and quantification of autophagosomes in liver from young and old mice
Vibratome-cut sections (70 μm) of mouse liver were prepared from GFP-LC3 transgenic mice, including young mice to assess constitutive autophagy activity and old mice to assess aging-related changes. Wild-type C57Bl/J mice were also included to determine the background level of green fluorescence. GFP-LC3 liver sections were stained anti-LC3 and with Hoechst 33342 to label nuclei and then analyzed by confocal microscopy. A, Representative images of GFP-LC3, LC3 and merged signal showing changes with aging. Original magnification: 63x. B, C, Quantitative analysis of vesicles (autophagosomes) in hepatocytes, including the total number of vesicles per cell and the total area of vesicles per cell. Values are the mean ± SEM of 5 mice per group.* P < 0.01 versus 6 month old mice.
Figure 2. Autophagosomes in knee cartilage
Vibratome-cut sagittal sections (70 μm) of mouse knee joints were stained with Hoechst 33342 to label nuclei or with anti-LC3 and then analyzed by confocal microscopy. A, Representative images of GFP-LC3 signal in response to aging. Images are from the mid zone of articular cartilage. Two representative images (separated by dotted lines) from young and old mice are shown. Original magnification: 63X. B, C, Quantitative analysis of vesicles (autophagosomes) in chondrocytes from the cartilage mid zone, including the total number of vesicles per cell and the total area of vesicles per cell. Values are the mean ± SEM of 5 mice per group. * = P < 0.001 versus 6 month mice.
Figure 3. Reconstruction of the entire tibial plateau and changes in the distribution of the GFP-LC3 signal in response to age
Vibratome-cut sagittal sections of knee joints from GFP-LC3 transgenic mice were prepared as described in Figure 1 and stained with Hoechst 33342 to or with anti-LC3. Representative images of GFP-LC3, LC3 and merged signal in response to age from cartilage knee joints are shown. Serial and multipanel optical image sections were spatially reassembled using Imaris software to generate a 3-dimensional representation of the tissue. Original magnification: 63X.
Figure 4. Aging-associated changes in expression of autophagy proteins
Knee joints sections from GFP-LC3 mice (n= 6) for each age (6, 18, 24 and 28 mo.) were analyzed by immunohistochemistry for Atg5 and LC3. Magnification 10x. Scale bar 100 μm. A, Representative images of knee joints stained with Atg5 and LC3 from 6 and 28 months old mice. B, Quantitative analysis of Atg5 and LC3-positive cells. Total cell number in three fields and Atg5 and LC3-positive cells were counted and the percentage of positive cells was calculated. Results show a significant decrease in Atg5 and LC3. Values are mean ± SEM. * = P < 0.01; ** = P < 0.01 versus 6 months old mouse knee joints.
Figure 5. Changes in cartilage cellularity and cell death in response to aging
A, Knee joint sections from GFP-LC3 mice (n= 6) for each age (6, 18, 24 and 28 months) were analyzed by Hematoxylin Eosin (H&E) staining and immunohistochemistry for Parp p85. Magnification 10x. Scale bar 100 μm. B, Quantitative analysis of cell numbers showed a significant decrease in cellularity in an age-dependent manner. Values are the mean ± SEM. * = P < 0.05 versus 6 months old mice.
Figure 6. Aging-associated histopathological changes in joint tissues
Knee joints from GFP-LC3 mice at ages 6 months (n=11), 12 months (n= 8), 18 months (n= 5), 24 months (n=12), 28 months (n=26), 32 months (n=9) and 36 months (n=10) were analyzed. A, Representative images of knee joints stained with Safranin O. Magnification 10x. Scale bar 100 μm. B, Scoring of cartilage changes. Values are the mean ± SEM. * = P < 0.05 versus young mice (6 months). C, Scoring of synovial inflammation. Values are the mean ± SEM. * = P < 0.05 versus young mice (6 months). D, Scoring of bone changes. Values are the mean ± SEM. * = P < 0.05 versus young mice (6 months).
Similar articles
- Compromised autophagy precedes meniscus degeneration and cartilage damage in mice.
Meckes JK, Caramés B, Olmer M, Kiosses WB, Grogan SP, Lotz MK, D'Lima DD. Meckes JK, et al. Osteoarthritis Cartilage. 2017 Nov;25(11):1880-1889. doi: 10.1016/j.joca.2017.07.023. Epub 2017 Aug 8. Osteoarthritis Cartilage. 2017. PMID: 28801209 Free PMC article. - Autophagy is a protective mechanism in normal cartilage, and its aging-related loss is linked with cell death and osteoarthritis.
Caramés B, Taniguchi N, Otsuki S, Blanco FJ, Lotz M. Caramés B, et al. Arthritis Rheum. 2010 Mar;62(3):791-801. doi: 10.1002/art.27305. Arthritis Rheum. 2010. PMID: 20187128 Free PMC article. - Regulated in Development and DNA Damage Response 1 Deficiency Impairs Autophagy and Mitochondrial Biogenesis in Articular Cartilage and Increases the Severity of Experimental Osteoarthritis.
Alvarez-Garcia O, Matsuzaki T, Olmer M, Plate L, Kelly JW, Lotz MK. Alvarez-Garcia O, et al. Arthritis Rheumatol. 2017 Jul;69(7):1418-1428. doi: 10.1002/art.40104. Epub 2017 Jun 2. Arthritis Rheumatol. 2017. PMID: 28334504 Free PMC article. - Autophagy and cartilage homeostasis mechanisms in joint health, aging and OA.
Lotz MK, Caramés B. Lotz MK, et al. Nat Rev Rheumatol. 2011 Aug 2;7(10):579-87. doi: 10.1038/nrrheum.2011.109. Nat Rev Rheumatol. 2011. PMID: 21808292 Free PMC article. Review. - Autophagy in osteoarthritis.
Li YS, Zhang FJ, Zeng C, Luo W, Xiao WF, Gao SG, Lei GH. Li YS, et al. Joint Bone Spine. 2016 Mar;83(2):143-8. doi: 10.1016/j.jbspin.2015.06.009. Epub 2015 Oct 6. Joint Bone Spine. 2016. PMID: 26453105 Review.
Cited by
- Chondrocyte Ferritinophagy as a Molecular Mechanism of Arthritis-A Narrative Review.
Liu Y, Song C, Gao S, Zhou D, Lv J, Zhou Y, Wang L, Shi H, Liu F, Xiong Z, Hou Y, Liu Z. Liu Y, et al. Cell Biochem Biophys. 2024 Sep 22. doi: 10.1007/s12013-024-01534-z. Online ahead of print. Cell Biochem Biophys. 2024. PMID: 39306824 Review. - EphrinB2-mediated chondrocyte autophagy induces post-traumatic arthritis via rupture of cartilage homeostasis.
Bao Z, Wang P, Li Y, Ding H, Wen J, Zou K, Wang X, Yu Y, Li X, Liu Y, Jin H, Wu L, Ying J. Bao Z, et al. J Cell Mol Med. 2024 Sep;28(18):e70095. doi: 10.1111/jcmm.70095. J Cell Mol Med. 2024. PMID: 39289794 Free PMC article. - Mechanisms of chondrocyte cell death in osteoarthritis: implications for disease progression and treatment.
Guan M, Yu Q, Zhou G, Wang Y, Yu J, Yang W, Li Z. Guan M, et al. J Orthop Surg Res. 2024 Sep 9;19(1):550. doi: 10.1186/s13018-024-05055-6. J Orthop Surg Res. 2024. PMID: 39252111 Free PMC article. Review. - Enhancing adipose tissue functionality in obesity: senotherapeutics, autophagy and cellular senescence as a target.
Arias C, Álvarez-Indo J, Cifuentes M, Morselli E, Kerr B, Burgos PV. Arias C, et al. Biol Res. 2024 Aug 8;57(1):51. doi: 10.1186/s40659-024-00531-z. Biol Res. 2024. PMID: 39118171 Free PMC article. Review. - Mitochondrial Role on Cellular Apoptosis, Autophagy, and Senescence during Osteoarthritis Pathogenesis.
Dalmao-Fernández A, Hermida-Gómez T, Nogueira-Recalde U, Rego-Pérez I, Blanco-Garcia FJ, Fernández-Moreno M. Dalmao-Fernández A, et al. Cells. 2024 Jun 4;13(11):976. doi: 10.3390/cells13110976. Cells. 2024. PMID: 38891108 Free PMC article.
References
Publication types
MeSH terms
Substances
LinkOut - more resources
Full Text Sources
Other Literature Sources
Medical
Molecular Biology Databases
Research Materials


