The nucleolar protein nucleophosmin is essential for autophagy induced by inhibiting Pol I transcription - PubMed (original) (raw)
The nucleolar protein nucleophosmin is essential for autophagy induced by inhibiting Pol I transcription
Naohiro Katagiri et al. Sci Rep. 2015.
Abstract
Various cellular stresses activate autophagy, which is involved in lysosomal degradation of cytoplasmic materials for maintaining nutrient homeostasis and eliminating harmful components. Here, we show that RNA polymerase I (Pol I) transcription inhibition induces nucleolar disruption and autophagy. Treatment with autophagy inhibitors or siRNA specific for autophagy-related (ATG) proteins inhibited autophagy but not nucleolar disruption induced by Pol I transcription inhibition, which suggested that nucleolar disruption was upstream of autophagy. Furthermore, treatment with siRNA specific for nucleolar protein nucleophosmin (NPM) inhibited this type of autophagy. This showed that NPM was involved in autophagy when the nucleolus was disrupted by Pol I inhibition. In contrast, NPM was not required for canonical autophagy induced by nutrient starvation, as it was not accompanied by nucleolar disruption. Thus, our results revealed that, in addition to canonical autophagy, there may be NPM-dependent autophagy associated with nucleolar disruption.
Figures
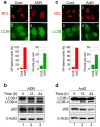
Figure 1. RNA Pol I transcription inhibitors induced nucleolar disruption and autophagy.
(a, c) Pol I transcription inhibitors induced nucleolar disruption and the formation of EGFP-LC3B punctate structures. MCF-7/EGFP-LC3B cells were treated with 0.2 μM adriamycin (ADR) (a) or 5 nM actinomycin-D (ActD) (c) for 24 h. The cells were fixed and examined by fluorescence microscopy. The cells were stained with anti-GFP (for LC3B; green) and anti-nucleolin (NCL; red) antibodies to detect LC3B and NCL. The lower left graph shows the percentages of cells with NCL staining in the nucleoplasm (NP). The lower right graph shows the number of EGFP-LC3B puncta per cell. Results are expressed as mean ± standard deviation of triplicate experiments. (b, d) The Pol I transcription inhibitors induced conversion of LC3B-I to LC3B-II and reduced the p62 protein level. MCF-7/EGFP-LC3B cells were treated with 0.2 μM ADR (b) or 5 nM ActD (d) for the indicated times. Cell lysates were prepared and analysed by immunoblotting using anti-GFP (for LC3B-I and LC3B-II), anti-p62 and anti-β-actin antibodies. Complete scans of the blots are presented in Supplementary Figures S11 and S12.
Figure 2. Knockdown of RNA Pol I transcription factors induced nucleolar disruption and autophagy.
(a, c) TIF-IA or POLR1A knockdown induced nucleolar disruption and the formation of EGFP-LC3B punctate structures. MCF-7/EGFP-LC3B cells were treated with siRNAs specific for luciferase (siCont), TIF-IA (siTIF-IA#1) or POLR1A (siPOLR1A#1) for 60 h. Immunofluorescent staining and the statistical analysis were performed in the same manner as shown in Figure 1 (a, c). Results are expressed as mean ± standard deviation of triplicate experiments. (b, d) TIF-IA or POLR1A knockdown induced conversion of LC3B-I to LC3B-II and reduced the p62 protein level. MCF-7/EGFP-LC3B cells were treated with siRNAs specific for luciferase (siCont), TIF-IA (siTIF-IA#1 and #2) or POLR1A (siPOLR1A#1 and #2) for the indicated times. Cell lysates were analysed by immunoblotting in the same manner as shown in Figure 1 (b, d). Complete scans of the blots are presented in Supplementary Figures S13 and S14.
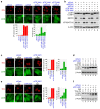
Figure 3. TIF-IA knockdown-dependent autophagy is repressed by autophagy factor knockdown or by autophagy inhibitors.
(a) Knocking down BECN1 and autophagy protein 5 (ATG5) repressed formation of the EGFP-LC3B punctate structures dependent on TIF-IA knockdown. MCF-7/EGFP-LC3B cells were treated with combinations of the indicated siRNAs for 60 h. Immunofluorescent staining and the statistical analysis were performed in the same manner as shown in Figure 1. (b) Knocking down BECN1 and ATG5 repressed conversion of LC3B-I to LC3B-II. MCF-7/EGFP-LC3B cells were treated with the indicated siRNAs for 60 h. Cell lysates were prepared and analysed by immunoblot. (c) 3-Methyladenine (3-MA) repressed formation of the EGFP-LC3B punctate structures dependent on TIF-IA knockdown. MCF-7/EGFP-LC3B cells were treated with siCont or siTIF-IA#1 for 36 h before treatment without or with 3 mM 3-MA for 12 h. Immunofluorescent staining and the statistical analysis were performed in the same manner as shown in Figure 1. (d) 3-MA repressed the LC3B-I to LC3B-II conversion dependent on TIF-IA knockdown. MCF-7/EGFP-LC3B cells were treated with the indicated siRNAs for 36 h before treatment without or with 3 mM 3-MA for the indicated times. Cell lysates were prepared and analysed by immunoblot. (e) Bafilomycin A1 enhanced formation of the EGFP-LC3B punctate structures dependent on TIF-IA knockdown. MCF-7/EGFP-LC3B cells were treated with siCont or siTIF-IA#1 for 48 h before treatment without or with 100 nM bafilomycin A1 for 2 h. Immunofluorescent staining and the statistical analysis were performed in the same manner as shown in Figure 1. (f) Bafilomycin A1 enhanced accumulation of the LC3B-II protein dependent on TIF-IA knockdown. MCF-7/EGFP-LC3B cells were treated with the indicated siRNAs for 48 h before treatment without or with 100 nM bafilomycin A1 for the indicated times. Cell lysates were prepared and analysed by immunoblot. Results are expressed mean ± standard deviation of triplicate experiments. Complete scans of the blots are presented in Supplementary Figures S15–S17.
Figure 4. TIF-IA knockdown induces autophagy in the absence of active p53.
(a) TIF-IA knockdown induced nucleolar disruption and formation of the LC3B punctate structures in the absence of p53. MCF-7/EGFP-LC3B cells were treated with combinations of indicated siRNAs for 60 h. Immunofluorescent staining and the statistical analysis were performed as shown in Figure 1. (b) TIF-IA knockdown induced conversion of LC3B-I to LC3B-II and reduced the p62 protein level in the absence of p53. MCF-7/EGFP-LC3B cells were treated with siRNAs specific for luciferase (siCont), p53 (sip53#1 and #2) or TIF-IA (siTIF-IA#1) for the indicated times. Cell lysates were analysed by immunoblot. (c) TIF-IA knockdown induced nucleolar disruption and formation of the LC3 punctate structures in HeLa cells. HeLa cells were treated with siCont (panels 1 and 3) or siTIF-IA#1 (panels 2 and 4) for 60 h. The cells were fixed and stained with anti-LC3, which recognises endogenous LC3 proteins (green; panels 1 and 2) and anti-nucleolin (red; panels 3 and 4) antibodies. The statistical analysis was performed in the same manner as shown in Figure 1. Results are expressed as mean ± standard deviation of triplicate experiments. (d) TIF-IA knockdown induced conversion of LC3-I to LC3-II and reduced the p62 protein level in HeLa cells. HeLa cells were treated with siCont or siTIF-IA#1 (siTIF-IA) for 48, 60 and 72 h. Cell lysates were analysed by immunoblot using the indicated antibodies. Complete scans of the blots are presented in Supplementary Figures S18 and S19.
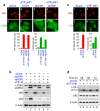
Figure 5. NPM knockdown represses RNA Pol I transcription factor knockdown-dependent autophagy.
(a) NPM knockdown repressed formation of the EGFP-LC3B punctate structures dependent on TIF-IA knockdown. MCF-7/EGFP-LC3B cells were treated with siCont (panels 1 and 5), siNPM#1 (panels 2 and 6), siTIF-IA#1 and siCont (panels 3 and 7) or siTIF-IA#1 and siNPM#1 (panels 4 and 8) for 60 h. Immunofluorescent staining and the statistical analysis were performed in the same manner as shown in Figure 1. Results are expressed as mean ± standard deviation of triplicate experiments. (b) Electron micrographs indicate that NPM knockdown repressed autophagy dependent on TIF-IA knockdown. MCF-7 cells were treated with siCont (panel 1), siTIF-IA#1 and siCont (panel 2) or siTIF-IA#1 and siNPM#1 (panel 3) for 60 h, followed by observations under a transmission electron microscope. Autophagic vacuoles (autophagosomes and autolysosomes) are indicated by the arrowheads. Bar, 1 μm. Lower number denotes the percentage of the area of autophagic vacuoles to the cytoplasmic area. (c) NPM knockdown repressed conversion of LC3B-I to LC3B-II dependent on TIF-IA knockdown. MCF-7/EGFP-LC3B cells were treated with siCont (lane 1), siTIF-IA#1 and siCont (lanes 2 and 3), siNPM#1 (lane 4), siTIF-IA#1 and siNPM#1 (lanes 5 and 6), siNPM#2 (lane 7) or siTIF-IA#1 and siNPM#2 (lanes 8 and 9) for the indicated times. Cell lysates were analysed by immunoblot. Complete scans of the blots are presented in Supplementary Figure S20.
Figure 6. NPM knockdown has little effect on starvation-induced autophagy.
(a) NPM knockdown had little effect on formation of the EGFP-LC3B punctate structures induced by starvation. MCF-7/EGFP-LC3B cells were treated with siCont (panels 1–4 and 9–12) or siNPM#1 (panels 5–8) for 60 h. After the siRNA treatment, the cells were cultured in standard medium (Cont.; panels 1, 3, 5, 7, 9, 11, 13 and 15) either without (panels 1, 5, 9 and 13) or with bafilomycin A1 (Baf; panels 3, 7, 11 and 15) or in starvation medium (HBSS; panels 2, 4, 6, 8, 10, 12, 14 and 16) either without (panels 2, 6, 10 and 14) or with bafilomycin A1 (Baf; panels 4, 8, 12 and 16) for 2 h. The cells were fixed and examined by fluorescence microscopy. Immunofluorescent staining and the statistical analysis were performed in the same manner as shown in Figure 1. Results are expressed as mean ± standard deviation of triplicate experiments. (b) NPM knockdown did not affect conversion of LC3B-I to LC3B-II induced by starvation. MCF-7/EGFP-LC3B cells were treated with siCont (lanes 1–4), siNPM#1 (lanes 5–8) or siNPM#2 (lanes 9–12) for 60 h. After siRNA treatment, cells were cultured in standard medium (Cont.; lanes 1, 3, 5, 7, 9 and 11) either without (lanes 1, 5 and 9) or with bafilomycin A1 (Baf; lanes 3, 7 and 11) or in starvation medium (HBSS; panels 2, 4, 6, 8, 10 and 12) either without (lanes 2, 6 and 10) or with bafilomycin A1 (lanes 4, 8 and 12) for 2 h. Cell lysates were analysed by immunoblot. Complete scans of the blots are presented in Supplementary Figure S21. (c) Proposed model for nucleolar disruption-dependent autophagy.
Similar articles
- Nucleophosmin is essential for c-Myc nucleolar localization and c-Myc-mediated rDNA transcription.
Li Z, Hann SR. Li Z, et al. Oncogene. 2013 Apr 11;32(15):1988-94. doi: 10.1038/onc.2012.227. Epub 2012 Jun 4. Oncogene. 2013. PMID: 22665062 Free PMC article. - Nucleophosmin interacts with HEXIM1 and regulates RNA polymerase II transcription.
Gurumurthy M, Tan CH, Ng R, Zeiger L, Lau J, Lee J, Dey A, Philp R, Li Q, Lim TM, Price DH, Lane DP, Chao SH. Gurumurthy M, et al. J Mol Biol. 2008 Apr 25;378(2):302-17. doi: 10.1016/j.jmb.2008.02.055. Epub 2008 Mar 4. J Mol Biol. 2008. PMID: 18371977 - The nucleolar transcriptome regulates Piwi shuttling between the nucleolus and the nucleoplasm.
Mikhaleva EA, Leinsoo TA, Ishizu H, Gvozdev VA, Klenov MS. Mikhaleva EA, et al. Chromosome Res. 2019 Mar;27(1-2):141-152. doi: 10.1007/s10577-018-9595-y. Epub 2018 Dec 12. Chromosome Res. 2019. PMID: 30539407 - The nucleolus as a fundamental regulator of the p53 response and a new target for cancer therapy.
Woods SJ, Hannan KM, Pearson RB, Hannan RD. Woods SJ, et al. Biochim Biophys Acta. 2015 Jul;1849(7):821-9. doi: 10.1016/j.bbagrm.2014.10.007. Epub 2014 Nov 11. Biochim Biophys Acta. 2015. PMID: 25464032 Review. - Cell and molecular biology of nucleolar assembly and disassembly.
Dimario PJ. Dimario PJ. Int Rev Cytol. 2004;239:99-178. doi: 10.1016/S0074-7696(04)39003-0. Int Rev Cytol. 2004. PMID: 15464853 Review.
Cited by
- PICT-1 triggers a pro-death autophagy through inhibiting rRNA transcription and AKT/mTOR/p70S6K signaling pathway.
Chen H, Duo Y, Hu B, Wang Z, Zhang F, Tsai H, Zhang J, Zhou L, Wang L, Wang X, Huang L. Chen H, et al. Oncotarget. 2016 Nov 29;7(48):78747-78763. doi: 10.18632/oncotarget.12288. Oncotarget. 2016. PMID: 27729611 Free PMC article. - Nucleolar Stress Functions Upstream to Stimulate Expression of Autophagy Regulators.
Dannheisig DP, Schimansky A, Donow C, Pfister AS. Dannheisig DP, et al. Cancers (Basel). 2021 Dec 10;13(24):6220. doi: 10.3390/cancers13246220. Cancers (Basel). 2021. PMID: 34944838 Free PMC article. - NOP53 Suppresses Autophagy through _ZKSCAN3_-Dependent and -Independent Pathways.
Cho YE, Kim YJ, Lee S, Park JH. Cho YE, et al. Int J Mol Sci. 2021 Aug 27;22(17):9318. doi: 10.3390/ijms22179318. Int J Mol Sci. 2021. PMID: 34502226 Free PMC article. - Regulatory role of rpL3 in cell response to nucleolar stress induced by Act D in tumor cells lacking functional p53.
Russo A, Pagliara V, Albano F, Esposito D, Sagar V, Loreni F, Irace C, Santamaria R, Russo G. Russo A, et al. Cell Cycle. 2016;15(1):41-51. doi: 10.1080/15384101.2015.1120926. Cell Cycle. 2016. PMID: 26636733 Free PMC article. - Nucleolus and Nucleolar Stress: From Cell Fate Decision to Disease Development.
Hua L, Yan D, Wan C, Hu B. Hua L, et al. Cells. 2022 Sep 27;11(19):3017. doi: 10.3390/cells11193017. Cells. 2022. PMID: 36230979 Free PMC article. Review.
References
- Mizushima N. & Komatsu M. Autophagy: renovation of cells and tissues. Cell 147, 728–741 (2011). - PubMed
- Mehrpour M., Esclatine A., Beau I. & Codogno P. Overview of macroautophagy regulation in mammalian cells. Cell Res. 20, 748–762 (2010). - PubMed
Publication types
MeSH terms
Substances
LinkOut - more resources
Full Text Sources
Other Literature Sources
Research Materials
Miscellaneous


