Biallelic mutations in SNX14 cause a syndromic form of cerebellar atrophy and lysosome-autophagosome dysfunction - PubMed (original) (raw)
doi: 10.1038/ng.3256. Epub 2015 Apr 6.
Vincent Cantagrel 2, Maha S Zaki 3, Lihadh Al-Gazali 4, Xin Wang 5, Rasim Ozgur Rosti 5, Esra Dikoglu 5, Antoinette Bernabe Gelot 6, Basak Rosti 5, Keith K Vaux 5, Eric M Scott 5, Jennifer L Silhavy 5, Jana Schroth 5, Brett Copeland 5, Ashleigh E Schaffer 5, Philip L S M Gordts 7, Jeffrey D Esko 7, Matthew D Buschman 8, Seth J Field 8, Gennaro Napolitano 9, Ghada M Abdel-Salam 3, R Koksal Ozgul 10, Mahmut Samil Sagıroglu 11, Matloob Azam 12, Samira Ismail 3, Mona Aglan 3, Laila Selim 13, Iman G Mahmoud 13, Sawsan Abdel-Hadi 13, Amera El Badawy 13, Abdelrahim A Sadek 14, Faezeh Mojahedi 15, Hulya Kayserili 16, Amira Masri 17, Laila Bastaki 18, Samia Temtamy 3, Ulrich Müller 19, Isabelle Desguerre 20, Jean-Laurent Casanova 21, Ali Dursun 22, Murat Gunel 23, Stacey B Gabriel 24, Pascale de Lonlay 25, Joseph G Gleeson 26
Affiliations
- PMID: 25848753
- PMCID: PMC4414867
- DOI: 10.1038/ng.3256
Biallelic mutations in SNX14 cause a syndromic form of cerebellar atrophy and lysosome-autophagosome dysfunction
Naiara Akizu et al. Nat Genet. 2015 May.
Abstract
Pediatric-onset ataxias often present clinically as developmental delay and intellectual disability, with prominent cerebellar atrophy as a key neuroradiographic finding. Here we describe a new clinically distinguishable recessive syndrome in 12 families with cerebellar atrophy together with ataxia, coarsened facial features and intellectual disability, due to truncating mutations in the sorting nexin gene SNX14, encoding a ubiquitously expressed modular PX domain-containing sorting factor. We found SNX14 localized to lysosomes and associated with phosphatidylinositol (3,5)-bisphosphate, a key component of late endosomes/lysosomes. Patient-derived cells showed engorged lysosomes and a slower autophagosome clearance rate upon autophagy induction by starvation. Zebrafish morphants for snx14 showed dramatic loss of cerebellar parenchyma, accumulation of autophagosomes and activation of apoptosis. Our results characterize a unique ataxia syndrome due to biallelic SNX14 mutations leading to lysosome-autophagosome dysfunction.
Figures
Figure 1. SNX14 mutations cause a syndromic form of severe cerebellar atrophy and coarsened facial features
(a) Summary of exome results from 81 families with cerebellar atrophy. SNX14 accounted for 9.88% of the total families, with other genes making individual contributions. (b) Midline sagittal (top) or axial (middle) MRI and facies of affected individuals from representative families. Prominent atrophy of cerebellum evidenced by reduced volume and apparent folia (arrows and circles). Facies show prominent forehead, epicanthal folds, long philtrum and full lips. Consent to publish images of the subject was obtained. (c) SNX14 exons as ticks and location of mutations indicated. Scale bar 50 kb. (d) Truncating mutations relative to predicted protein domains. TM: Transmembrane, PXA: Phox homology associated, RGS: Regulator of G protein signaling, PX: Phox homology, PXC: Sorting Nexin, C-terminal. (e) ABD-II-2 (p.Arg378*) hematoxylin-eosin stained cerebellum compared with control showing reduction in internal granule cell layer (arrow, top), near complete depletion of Purkinje cells (arrow, middle), and dystrophic degenerating remnant Purkinje cell (arrow, bottom). Scale bar 100 µm.
Figure 2. SNX14 localizes to late endosome/lysosome compartments
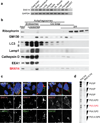
(a) RT-PCR expression pattern of human SNX14 showing ubiquitous expression in representative fetal and adult human tissues. GAPDH: loading control. (b) Cell fractionation from human neural progenitor cells (NPCs). SNX14 was enriched in lysosomal-endosomal compartments (red). (c) LAMP2, EEA1 and GM130 (green) in dsRED tagged SNX14 expressing NPCs. SNX14 overlapped in localization with LAMP2 lysosomal marker (arrows). Scale bar 10 µm. (d) Lipid binding assay with SNX14 PX domain on phosphoinositides-spotted membrane, showed preferential binding to PI(3,5)P2 (red), compared with p40phox PX domain control.
Figure 3. Patient-derived SNX14 mutant neural progenitor cells display enlarged lysosomes
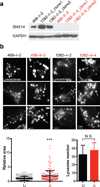
(a) Immunoblot of IPSC-derived neural progenitor cells (NPCs) from families 468 (p.Arg378*) and 1382 (p.Lys395Arg_fs_*22), with affected (A, red) and unaffected (U, black) labeled. Affecteds showed undetectable SNX14 protein. GAPDH: loading control. (b) Lysotracker Green DND-26 staining with engorged lysosomes in affecteds NPCs (arrows). Scale bar 5 um. Dot plot shows relative area for individual LysoTracker positive lysosomes (n = 223 and 194 lysosomes from 2 families unaffected and affected NPCs respectively, N = 2). Graph bars represent average number of LysoTracker-positive lysosomes per cell (n = 17 and 18 from 2 families unaffected and affected NPCs respectively, N = 2). Error bars, S.D. *** p < 0.0005, N.S. not significant (two tiled t-test).
Figure 4. Patient-derived SNX14 mutant neural progenitor cells display abnormal starvation-induced autophagic response
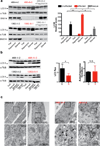
(a) Immunoblot analysis of LC3 II in affected (red), unaffected and affected transduced with SNX14 (grey) NPCs upon induction of autophagy by starvation with 1 hr 30 min EBSS (Eagle’s Balanced Salt Solution) or rapamycin (1 µM for 2 hr). Graph bars represent average LC3II/αTubulin levels relative to feeding condition. Error bars S.D. (N = 3 clones) * p < 0.05, ** p < 0.005, N.S. not significant (two tiled t-test). Affected cells display an accumulation of LC3 II levels upon autophagic induction, partially rescued by exogenous SNX14 expression. (b) LC3 immunoblot (left) for quantification of autophagic flux measured by LC3 II ratio in lane 3 vs. lane 2 for unaffected and lane 7 vs. lane 6 for affected (red) (middle), and quantification of autophagosome formation (left) assessed as the increase in LC3-II levels at two time points (lane 4 vs. lane 3 for control, and lane 8 vs. lane 7 for affected) after inhibition of lysosomal proteolysis with Leupeptin 200 µM and NH4Cl 20 mM (PI 30 min/PI 1 hr). Graph represent mean ± S.D. (N = 3 clones) * p < 0.05, N.S. not significant (two tailed t-test) (c) Transmission electron microscopic analysis of 2 hr EBSS treated unaffected (black) and affected (red) NPCs showing autophagic structures in affecteds (arrowheads). Data represents results from one NPC clones from each affected or unaffected.
Figure 5. Morphant snx14 zebrafish show apoptosis, excessive autophagic vesicles, and loss of neural tissue including cerebellar primordium
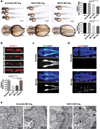
(a) Comparison of scrambled (6ng) and snx14 (3ng and 6ng) morphant zebrafish 48 hours postfertilization (hpf). Calipers: measured distance. Scale bar 250 µm. Graphs: Reduced optic tectum and right eye width in morphants. Mean ± SEM (n = 15 embryos for NI, 16 for Scramble, 31 for MO 3ng and 18 for MO 6ng, N = 2). *p < 0.05; **p < 0.005 (two tiled t-test). (b) Scramble or snx14 morphants for Zebrin II (Purkinje cell marker), rescued with human SNX14 (50 pg). Scale bar 50 µm. Graph: Zebrin II compartment area relative to scramble MO injected embryos. Mean ±SEM (n = 10 embryos for Scramble, 6 for MO 3ng, 9 for MO 6ng and 9 for rescue) *p < 0.05; **p < 0.005 (two tiled t-test). (c) Maximum confocal projection from 36 hpf Tg(ptf1a:eGFP) (green) zebrafish with scramble or snx14 MO showing reduced Purkinje cell progenitors. (d) Maximum confocal projection with increased caspase 3 (red) positive cells in 36 hpf snx14 morphants. Blue: DAPI. Scale bar 50 µm. (e) Transmission electron microscopy showing autophagic structures in 48 hpf snx14 and scrambled morphant neurons residing between the optic lobes. Box: Highlighted areas. Arrowheads: autophagic structures.
Similar articles
- Autosomal recessive spinocerebellar ataxia 20: Report of a new patient and review of literature.
Shukla A, Upadhyai P, Shah J, Neethukrishna K, Bielas S, Girisha KM. Shukla A, et al. Eur J Med Genet. 2017 Feb;60(2):118-123. doi: 10.1016/j.ejmg.2016.11.006. Epub 2016 Nov 29. Eur J Med Genet. 2017. PMID: 27913285 Free PMC article. - SNX14 mutations affect endoplasmic reticulum-associated neutral lipid metabolism in autosomal recessive spinocerebellar ataxia 20.
Bryant D, Liu Y, Datta S, Hariri H, Seda M, Anderson G, Peskett E, Demetriou C, Sousa S, Jenkins D, Clayton P, Bitner-Glindzicz M, Moore GE, Henne WM, Stanier P. Bryant D, et al. Hum Mol Genet. 2018 Jun 1;27(11):1927-1940. doi: 10.1093/hmg/ddy101. Hum Mol Genet. 2018. PMID: 29635513 Free PMC article. - Autosomal recessive spinocerebellar ataxia-20 due to a novel SNX14 variant in an Indian girl.
Sait H, Moirangthem A, Agrawal V, Phadke SR. Sait H, et al. Am J Med Genet A. 2022 Jun;188(6):1909-1914. doi: 10.1002/ajmg.a.62701. Epub 2022 Feb 23. Am J Med Genet A. 2022. PMID: 35195341 - Congenital disorders of autophagy: an emerging novel class of inborn errors of neuro-metabolism.
Ebrahimi-Fakhari D, Saffari A, Wahlster L, Lu J, Byrne S, Hoffmann GF, Jungbluth H, Sahin M. Ebrahimi-Fakhari D, et al. Brain. 2016 Feb;139(Pt 2):317-37. doi: 10.1093/brain/awv371. Epub 2015 Dec 29. Brain. 2016. PMID: 26715604 Free PMC article. Review. - X-linked ataxias.
Zanni G, Bertini E. Zanni G, et al. Handb Clin Neurol. 2018;155:175-189. doi: 10.1016/B978-0-444-64189-2.00011-1. Handb Clin Neurol. 2018. PMID: 29891057 Review.
Cited by
- The spectrum of neurodevelopmental, neuromuscular and neurodegenerative disorders due to defective autophagy.
Deneubourg C, Ramm M, Smith LJ, Baron O, Singh K, Byrne SC, Duchen MR, Gautel M, Eskelinen EL, Fanto M, Jungbluth H. Deneubourg C, et al. Autophagy. 2022 Mar;18(3):496-517. doi: 10.1080/15548627.2021.1943177. Epub 2021 Aug 19. Autophagy. 2022. PMID: 34130600 Free PMC article. - Paradigm for disease deconvolution in rare neurodegenerative disorders in Indian population: insights from studies in cerebellar ataxias.
Kumari R, Kumar D, Brahmachari SK, Srivastava AK, Faruq M, Mukerji M. Kumari R, et al. J Genet. 2018 Jul;97(3):589-609. J Genet. 2018. PMID: 30027898 - Mdm1/Snx13 is a novel ER-endolysosomal interorganelle tethering protein.
Henne WM, Zhu L, Balogi Z, Stefan C, Pleiss JA, Emr SD. Henne WM, et al. J Cell Biol. 2015 Aug 17;210(4):541-51. doi: 10.1083/jcb.201503088. J Cell Biol. 2015. PMID: 26283797 Free PMC article. - Zebrafish Models of Autosomal Recessive Ataxias.
Quelle-Regaldie A, Sobrido-Cameán D, Barreiro-Iglesias A, Sobrido MJ, Sánchez L. Quelle-Regaldie A, et al. Cells. 2021 Apr 8;10(4):836. doi: 10.3390/cells10040836. Cells. 2021. PMID: 33917666 Free PMC article. Review. - Compound heterozygous mutation of the SNX14 gene causes autosomal recessive spinocerebellar ataxia 20.
Shao Y, Yang S, Li J, Cheng L, Kang J, Liu J, Ma J, Duan J, Zhang Y. Shao Y, et al. Front Genet. 2024 Apr 9;15:1379366. doi: 10.3389/fgene.2024.1379366. eCollection 2024. Front Genet. 2024. PMID: 38655056 Free PMC article.
References
- Coutinho P, et al. Hereditary ataxia and spastic paraplegia in Portugal: a population-based prevalence study. JAMA Neurol. 2013;70:746–755. - PubMed
- Taylor JP, Hardy J, Fischbeck KH. Toxic proteins in neurodegenerative disease. Science. 2002;296:1991–1995. - PubMed
METHODS-ONLY REFERENCES
- Clements PR. Determination of sialylated and neutral oligosaccharides in urine by mass spectrometry. Curr Protoc Hum Genet. 2012 Chapter 17, Unit17 10. - PubMed
- Okita K, et al. A more efficient method to generate integration-free human iPS cells. Nat Methods. 2011;8:409–412. - PubMed
Publication types
MeSH terms
Substances
Grants and funding
- U54 HG003067/HG/NHGRI NIH HHS/United States
- K99 NS089859/NS/NINDS NIH HHS/United States
- R01NS048453/NS/NINDS NIH HHS/United States
- K99NS089859-01/NS/NINDS NIH HHS/United States
- U54HG003067/HG/NHGRI NIH HHS/United States
- R01 NS048453/NS/NINDS NIH HHS/United States
- U54HG006504/HG/NHGRI NIH HHS/United States
- U54 HG006504/HG/NHGRI NIH HHS/United States
- R01 NS052455/NS/NINDS NIH HHS/United States
- P01 HD070494/HD/NICHD NIH HHS/United States
- Howard Hughes Medical Institute/United States
- P01HD070494/HD/NICHD NIH HHS/United States
LinkOut - more resources
Full Text Sources
Other Literature Sources
Medical
Molecular Biology Databases


