The proteomic landscape of triple-negative breast cancer - PubMed (original) (raw)
The proteomic landscape of triple-negative breast cancer
Robert T Lawrence et al. Cell Rep. 2015.
Erratum in
- Cell Rep. 2015 May 12;11(6):990
Abstract
Triple-negative breast cancer is a heterogeneous disease characterized by poor clinical outcomes and a shortage of targeted treatment options. To discover molecular features of triple-negative breast cancer, we performed quantitative proteomics analysis of twenty human-derived breast cell lines and four primary breast tumors to a depth of more than 12,000 distinct proteins. We used this data to identify breast cancer subtypes at the protein level and demonstrate the precise quantification of biomarkers, signaling proteins, and biological pathways by mass spectrometry. We integrated proteomics data with exome sequence resources to identify genomic aberrations that affect protein expression. We performed a high-throughput drug screen to identify protein markers of drug sensitivity and understand the mechanisms of drug resistance. The genome and proteome provide complementary information that, when combined, yield a powerful engine for therapeutic discovery. This resource is available to the cancer research community to catalyze further analysis and investigation.
Copyright © 2015 The Authors. Published by Elsevier Inc. All rights reserved.
Conflict of interest statement
Authors declare no financial conflicts of interests.
Figures
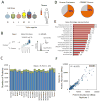
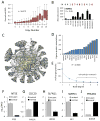
Figure 1. Mass spectrometry-based profiling of triple-negative breast cancer
(A) Overview of samples analyzed. N: normal epithelial, +: ER/PR/ERBB2+, L: luminal-like, M: mesenchymal-like, B: basal-like, ?: not matched. TNBC cell line classifications according to (Lehmann et al., 2011) (B) Workflow of proteomics sample preparation and data collection. (C) Average number of proteins identified in each replicate (blue bars), total number of proteins for each cell line (green bars). Error bars represent S.D. (D) Percent of identified proteins relative to the Uniprot/Swiss-Prot database (left) and the COSMIC census (right). (E) Number and percent representation of indicated gene ontology categories. (F) Representative scatter plot for cell line SKBR3 replicate protein measurements showing quantitative reproducibility of iBAQ protein abundance.
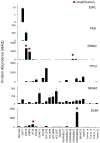
Figure 2. Quantification of clinical breast cancer biomarkers
ESR1: estrogen receptor, PGR: progesterone receptor, ERBB2: human epidermal growth factor receptor-2, TP53: tumor protein p53, MKI67: Ki-67 antigen, EGFR: human epidermal growth factor receptor. Sample labels are shown in the bottom panel. Absolute protein abundance was calculated using intensity-based absolute quantification (iBAQ). Error bars represent S.D. Red dots indicate gene copy number amplification (>7 copies).
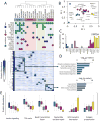
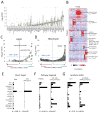
Figure 3. The triple-negative breast cancer proteome
(A) Hierarchical clustering of protein expression profiles computed using centered Pearson’s correlation identified four proteome subtypes as indicated. Protein expression values were normalized to a scale from 0 to 1 prior to clustering. Frequent genetic aberrations are overlaid onto the proteome clustering results. Green circles represent exonic mutations. Red and blue circles represent copy number gain (>7 copies) or loss (0 copies), respectively. Colored background shading corresponds to cluster membership. At the time of writing, exome sequence and copy number data were not available for MCF10A, SW527. (B) Scatter plot of principal component 1 and 2. Principal component analysis was performed using protein expression profiles. Each point represents a sample. Colors represent hierarchical cluster membership from (A). (C) Biological pathways enriched from the indicated proteins clusters. Inverted log10 p-values are shown. (D) Representative example of a protein upregulated in cluster 4 and tumors. STAT5A: signal transducer and activator of transcription 5A. Error bars represent S.D. (E) Distribution of protein abundances within each cluster (colors) for indicated biological processes. For all panels, cluster membership is indicated by the same colors used in (A), with tumor samples indicated in yellow.
Figure 4. Expression of cancer signaling proteins
(A–G) Distribution of absolute abundance for each protein in the signaling network. Chart titles indicate subnetwork membership. Each data point represents a sample, color coded according to cluster membership from Figure 4A. (H) Top 25 most differentially expressed proteins (highest standard deviation between different samples) from the COSMIC gene census or (I) the protein kinase superfamily.
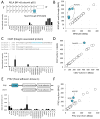
Figure 5. Differential expression of protein isoforms
(A) Schematic of RELA (NF-κB subunit p65) mRNA sequence variants and intensity-based quantification of the isoform-specific peptide FSSVQLR in each sample. Peptide intensity was divided by the total proteome intensity for normalization. The location of an exon read-through event is indicated. (B) Scatterplot of the full length NF-κB protein versus the read-through variant highlighting off-diagonal samples. (C) Four alternative splice variants encode the cytoplasmic tail of integrin associated protein CD47. The sequence of these variants is shown along with the quantification of the peptide specific to isoform 1, AVEEPLNAFK. (D) Scatterplot of CD47 isoform 1 versus isoform 3 highlighting off-diagonal samples. (E) Schematic of N-terminally truncated form of focal adhesion kinase PTK2 and quantification of N-terminal/C-terminal intensity in each sample. (F) Scatterplot of PTK2 long form versus short form highlighting off-diagonal samples.
Figure 6. Proteogenomic associations
(A) Boxplot showing relationship of protein abundance versus gene copy number. Protein abundances were row-normalized to a scale of 0 to 1 to account for differences in absolute expression. (B) NDRG1 (N-myc downstream regulated gene 1), a representative protein that was not correlated with copy number. CN: copy number. CN>6 highlighted in red. R represents Pearson’s correlation. Error bars represent S.D. between replicate measurements. (C) Network of gene-protein associations. Each edge represents an association (p < 0.001) between a mutated census gene (gray nodes) and protein expression (yellow nodes). Only genes from the COSMIC census mutated in at least 3 cell lines were analyzed. Node size represents the number of connections. The network was plotted in Cytoscape using ‘edge-weighted spring embedded’ layout so that genes with common associations cluster together. (D) Number of outgoing associations for each mutated gene in network. (E) Number of incoming associations for each target protein in network (node degree distribution). Cell cycle proteins were enriched among proteins with 3 or more associated genes (p = 5.66 × 10⁻⁴). (F–J) Representative gene-protein associations (p < 0.001) for common genetic lesions in breast cancer. Protein is indicated in chart title, and mutated gene shown in italics below plot. Error bars represent S.E.M.
Figure 7. Protein expression and drug sensitivity
(A) Distribution of drug sensitivity (−log10IC50) values across 16 TNBC cell lines for each drug in order of increasing median sensitivity. Drugs with sub-micromolar IC50 in at least one cell line are shown. Grey dots represent outlier values (>1.5× interquartile range). (B) Hierarchical clustering of drug-protein associations. Pairwise Pearson’s correlation was calculated systematically between drug sensitivity (inverted IC50) and protein abundance (iBAQ) values and clustered in both dimensions. Enriched gene ontology terms are shown for several clusters with Benjamini-Hochberg adjusted p-value. (C) Association of drug sensitivity with EGFR expression. The EGFR inhibitor lapatinib was significantly associated in both drug screen datasets (CRx: P = 6.2×10⁻⁴, our data: P = 2.4×10⁻⁹, FDR < 0.05). (D) Association of protein expression with bleomycin sensitivity. The protein DDX60 was significantly associated bleomycin sensitivity (P = 1.1×10⁻¹⁵, FDR < 0.05). (E–G) Pairwise comparison of protein expression and drug sensitivity for three examples. Direct target: expression of the target protein indicates sensitivity to the drug. Pathway target: expression of a protein in the pathway of the drug target, but not the target itself, indicates sensitivity. Synthetic lethal: expression of a protein in an independent pathway from the drug target indicates sensitivity. Left panel: protein abundance (iBAQ) across cell lines. Right panel: drug sensitivity (inverse IC50, M−1) across the same cell lines. RXRB: retinoid X receptor beta, RPS6KB2: ribosomal protein S6 kinase-2, AKT1: RAC-alpha serine/threonine-protein kinase. ATRA: RXR agonist all-trans retinoic acid, MK-2206: pan-isoform AKT inhibitor, AG-014699: poly-ADP ribose polymerase 1/2 inhibitor. Pearson’s correlation and p-value is indicated below the plots. CRx: Data from (Yang et al., 2013). Panel A includes only data generated in this study. For panels B–G, data from the CRx was included. Missing IC50 values were not imputed.
Similar articles
- Quantitative proteomic landscape of metaplastic breast carcinoma pathological subtypes and their relationship to triple-negative tumors.
Djomehri SI, Gonzalez ME, da Veiga Leprevost F, Tekula SR, Chang HY, White MJ, Cimino-Mathews A, Burman B, Basrur V, Argani P, Nesvizhskii AI, Kleer CG. Djomehri SI, et al. Nat Commun. 2020 Apr 7;11(1):1723. doi: 10.1038/s41467-020-15283-z. Nat Commun. 2020. PMID: 32265444 Free PMC article. - Shotgun proteomics of archival triple-negative breast cancer samples.
Gámez-Pozo A, Ferrer NI, Ciruelos E, López-Vacas R, Martínez FG, Espinosa E, Vara JÁ. Gámez-Pozo A, et al. Proteomics Clin Appl. 2013 Apr;7(3-4):283-91. doi: 10.1002/prca.201200048. Epub 2013 Mar 6. Proteomics Clin Appl. 2013. PMID: 23436753 - Identification of Personalized Chemoresistance Genes in Subtypes of Basal-Like Breast Cancer Based on Functional Differences Using Pathway Analysis.
Wu T, Wang X, Li J, Song X, Wang Y, Wang Y, Zhang L, Li Z, Tian J. Wu T, et al. PLoS One. 2015 Jun 30;10(6):e0131183. doi: 10.1371/journal.pone.0131183. eCollection 2015. PLoS One. 2015. PMID: 26126114 Free PMC article. - Heterogeneity of triple negative breast cancer: Current advances in subtyping and treatment implications.
Asleh K, Riaz N, Nielsen TO. Asleh K, et al. J Exp Clin Cancer Res. 2022 Sep 1;41(1):265. doi: 10.1186/s13046-022-02476-1. J Exp Clin Cancer Res. 2022. PMID: 36050786 Free PMC article. Review. - Changing Treatment Paradigms in Metastatic Breast Cancer: Lessons Learned.
Santa-Maria CA, Gradishar WJ. Santa-Maria CA, et al. JAMA Oncol. 2015 Jul;1(4):528-34; quiz 549. doi: 10.1001/jamaoncol.2015.1198. JAMA Oncol. 2015. PMID: 26181262 Review.
Cited by
- Conservation of protein abundance patterns reveals the regulatory architecture of the EGFR-MAPK pathway.
Shi T, Niepel M, McDermott JE, Gao Y, Nicora CD, Chrisler WB, Markillie LM, Petyuk VA, Smith RD, Rodland KD, Sorger PK, Qian WJ, Wiley HS. Shi T, et al. Sci Signal. 2016 Jul 12;9(436):rs6. doi: 10.1126/scisignal.aaf0891. Sci Signal. 2016. PMID: 27405981 Free PMC article. - Proteomics, Post-translational Modifications, and Integrative Analyses Reveal Molecular Heterogeneity within Medulloblastoma Subgroups.
Archer TC, Ehrenberger T, Mundt F, Gold MP, Krug K, Mah CK, Mahoney EL, Daniel CJ, LeNail A, Ramamoorthy D, Mertins P, Mani DR, Zhang H, Gillette MA, Clauser K, Noble M, Tang LC, Pierre-François J, Silterra J, Jensen J, Tamayo P, Korshunov A, Pfister SM, Kool M, Northcott PA, Sears RC, Lipton JO, Carr SA, Mesirov JP, Pomeroy SL, Fraenkel E. Archer TC, et al. Cancer Cell. 2018 Sep 10;34(3):396-410.e8. doi: 10.1016/j.ccell.2018.08.004. Cancer Cell. 2018. PMID: 30205044 Free PMC article. - Multi-omics Characterization of Interaction-mediated Control of Human Protein Abundance levels.
Sousa A, Gonçalves E, Mirauta B, Ochoa D, Stegle O, Beltrao P. Sousa A, et al. Mol Cell Proteomics. 2019 Aug 9;18(8 suppl 1):S114-S125. doi: 10.1074/mcp.RA118.001280. Epub 2019 Jun 25. Mol Cell Proteomics. 2019. PMID: 31239291 Free PMC article. - Colorectal Cancer Cell Line Proteomes Are Representative of Primary Tumors and Predict Drug Sensitivity.
Wang J, Mouradov D, Wang X, Jorissen RN, Chambers MC, Zimmerman LJ, Vasaikar S, Love CG, Li S, Lowes K, Leuchowius KJ, Jousset H, Weinstock J, Yau C, Mariadason J, Shi Z, Ban Y, Chen X, Coffey RJC, Slebos RJC, Burgess AW, Liebler DC, Zhang B, Sieber OM. Wang J, et al. Gastroenterology. 2017 Oct;153(4):1082-1095. doi: 10.1053/j.gastro.2017.06.008. Epub 2017 Jun 16. Gastroenterology. 2017. PMID: 28625833 Free PMC article. - The IL1β-IL1R signaling is involved in the stimulatory effects triggered by hypoxia in breast cancer cells and cancer-associated fibroblasts (CAFs).
Lappano R, Talia M, Cirillo F, Rigiracciolo DC, Scordamaglia D, Guzzi R, Miglietta AM, De Francesco EM, Belfiore A, Sims AH, Maggiolini M. Lappano R, et al. J Exp Clin Cancer Res. 2020 Aug 10;39(1):153. doi: 10.1186/s13046-020-01667-y. J Exp Clin Cancer Res. 2020. PMID: 32778144 Free PMC article.
References
- Arteaga CL, Baselga J. Impact of Genomics on Personalized Cancer Medicine. Clin Cancer Res. 2012;18:612–618. - PubMed
- Brown EJ, Frazier WA. Integrin-associated protein (CD47) and its ligands. Trends Cell Biol. 2001;11:130–135. - PubMed
Publication types
MeSH terms
Substances
Grants and funding
- K99 CA140789/CA/NCI NIH HHS/United States
- R00 CA140789/CA/NCI NIH HHS/United States
- T32 HG000035/HG/NHGRI NIH HHS/United States
- T32 HG00035/HG/NHGRI NIH HHS/United States
- R00CA140789/CA/NCI NIH HHS/United States
LinkOut - more resources
Full Text Sources
Other Literature Sources
Research Materials
