Degradation of lipid droplet-associated proteins by chaperone-mediated autophagy facilitates lipolysis - PubMed (original) (raw)
Degradation of lipid droplet-associated proteins by chaperone-mediated autophagy facilitates lipolysis
Susmita Kaushik et al. Nat Cell Biol. 2015 Jun.
Abstract
Chaperone-mediated autophagy (CMA) selectively degrades a subset of cytosolic proteins in lysosomes. A potent physiological activator of CMA is nutrient deprivation, a condition in which intracellular triglyceride stores or lipid droplets (LDs) also undergo hydrolysis (lipolysis) to generate free fatty acids for energetic purposes. Here we report that the LD-associated proteins perilipin 2 (PLIN2) and perilipin 3 (PLIN3) are CMA substrates and their degradation through CMA precedes lipolysis. In vivo studies revealed that CMA degradation of PLIN2 and PLIN3 was enhanced during starvation, concurrent with elevated levels of cytosolic adipose triglyceride lipase (ATGL) and macroautophagy proteins on LDs. CMA blockage both in cultured cells and mouse liver or expression of CMA-resistant PLINs leads to reduced association of ATGL and macrolipophagy-related proteins with LDs and the subsequent decrease in lipid oxidation and accumulation of LDs. We propose a role for CMA in LD biology and in the maintenance of lipid homeostasis.
Conflict of interest statement
Competing Financial Interest
The authors declare that they have no competing interests.
Figures
Figure 1
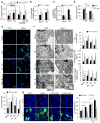
LAMP-2A-deficient cells accumulate LD. (a) Total triglycerides (TG) in control mouse fibroblasts (CTR) and in cells stably knocked down for LAMP-2A (L2A(−)) (inset) untreated or treated with OL, incubated with serum-supplemented regular media (OL>S+) or low glucose media (OL>S+ Low Glc) after OL treatment. n=4 (LowGlc), 6 (OL>S+) and 7 (all other conditions) independent experiments. (b) TG synthesis in cells as in (a). n=4 independent experiments. (c) Beta-oxidation rates in cells as in (a). n=6 independent experiments. (d) Oxygen consumption rates (OCR) in CTR and L2A(−) cells with the indicated treatments. Eto: etomoxir. n=5 time points from 8 independent experiments. (e) BODIPY493/503 staining in CTR and L2A(−) cells untreated or treated with OL, or incubated with serum-supplemented medium (OL>S+) or serum-deprived medium (OL>S−) after OL treatment. Graph: average LD number/cell (LD size shown in Supplementary Figure 1d). n=6 independent experiments with 40 cells per condition in each experiment. (f) Electron microscopy of cells treated as in (e). Graphs: area occupied by LD or average LD number/cell and LD size. n=3 independent experiments with 5 micrographs per condition. (g) DPH staining in CTR and L2A(−) cells transfected with hL2A, untreated or treated with OL. Asterisks: transfected cells. Graph: average LD number/cell calculated from orthoviews. n=5 independent experiments with 40 cells per condition in each experiment. Values are mean ± SEM. Differences are significant for *P<0.05, **P<0.01, ***P<0.001 using Student’s _t-_test. Source data is available in Supplementary Table 1.
Figure 2
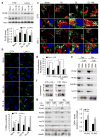
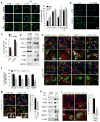
PLIN2 and PLIN3 are CMA substrates. (a) Immunoblot for indicated proteins of total cell lysates from CTR and L2A(−) cells untreated or treated with OL or incubated with serum-supplemented medium (OL>S+) or serum-deprived medium (OL>S−) after OL treatment. Graph: PLIN2 levels relative to untreated CTR cells. n=7 independent experiments. (b) Immunostaining for PLIN2 in CTR and L2A(−) cells treated as in (a). Graph: average puncta/cell. n=5 independent experiments with 40 cells per condition in each experiment. (c) Coimmunostaining for PLIN2 and LAMP1 in CTR and L2A(−) cells treated or not with OL followed by treatment with lysosomal inhibitors, ammonium chloride and leupeptin (NL). Top: Colocalized pixels in white. Bottom: Merged image of the boxed area at higher magnification. (d) Graph: percentage colocalization of PLIN2 with LAMP1 from (c). n=5 independent experiments with 40 cells per condition in each experiment. (e) Immunoblot for indicated proteins of homogenates (HOM), lysosomes with high (CMA+) and low (CMA−) activity isolated from fed or starved (Stv) rat livers. Representative blots from 5 independent experiments. (f) Immunoblot for indicated proteins of isolated lysosome-enriched fractions from OL-treated control and L2A(−) cells. (g) Immunoblot for indicated proteins of HOM, CMA+ and CMA− lysosomes isolated from fed or starved (Stv) livers of rat untreated or treated with leupeptin (Leup). Graph: PLIN2 and PLIN3 levels in leupeptin-treated CMA+ lysosomes relative to untreated. Representative blots from 3 independent experiments (other two shown in Supplementary Figure 2h). Values are mean ± SEM. Differences are significant for *P<0.05, **P<0.01, ***P<0.001 using Student’s _t-_test. Uncropped images of blots are shown in Supplementary Figure 8. Source data is available in Supplementary Table 1.
Figure 3
PLIN2 and PLIN3 interact with CMA chaperone hsc70. (a) Immunoblot for indicated proteins of homogenates (HOM) and lipid droplets (LD) isolated from fed (F) or starved (S) rat livers. GAPDH is shown as a negative control for lack of cytosolic contamination in the LD fractions. Representative blots from 5 independent experiments. (b, c) Coimmunostaining for hsc70 and PLIN2 in CTR and L2A(−) cells treated or not with OL. Colocalized pixels are in white. Boxed areas are shown at higher magnification. Graph: percentage colocalization of PLIN2 with hsc70. n=5 independent experiments with 40 cells per condition in each experiment. (d) Immunoblot for indicated proteins of HOM and LD isolated from starved wild-type (+) or L2A knockout (−) mice livers. Representative blots from 3 independent experiments. (e, f) Coimmunoprecipitation (IP) of PLIN2 (e) and PLIN3 (f) in CTR (+) and L2A(−) (−) cells treated or not with OL. Extended blots are shown in Supplementary Figure 3f. Representative blots of from 5 (e) and 3 (f) independent experiments. (g) IP of PLIN2 (top) and PLIN3 (bottom) in LD-enriched fractions from mice as in (d). The experiment was repeated twice. Values are mean ± SEM. Differences are significant for ***P<0.001 using Student’s _t-_test. Uncropped images of blots are shown in Supplementary Figure 8. Source data is available in Supplementary Table 1.
Figure 4
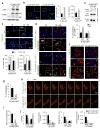
Posttranslational modifications of PLINs and their degradation by CMA. (a) Immunostaining for PLIN2 (left) or BODIPY493/503 staining (right) in CTR and L2A(−) cells incubated in serum-supplemented media after OL challenge (OL>S+) treated or not with atypical retinoic acid derivative (aRAd) shown to activate CMA. Graphs: PLIN2 puncta or LD/cell. n=5 (PLIN2) and 6 (LD/cell) independent experiments with 40 cells per condition in each experiment. (b) Immunostaining for PLIN2 in CTR and L2A(−) cells transfected with hL2A and treated with OL. Asterisks: transfected cells. Graph: average PLIN2 puncta/cell calculated from orthoviews. n=5 independent experiments with 40 cells per condition in each experiment. (c) Bidimensional electrophoresis and immunoblot for PLIN2 in total cell lysates from CTR and L2A(−) cells untreated, treated with OL, or maintained in OL>S+ media. Bottom inset shows samples treated with lambda phosphatase (λPPase). Arrows: estimated isoelectric points. Representative blots of n=3 (OL>S+) and 6 (None and OL) independent experiments. (d) PLIN2 immunoblots of total cell lysates from CTR and L2A(−) cells subjected to indicated treatments run with Phos-tag to resolve phosphorylated proteins. Immunoblots from two independent experiments are shown. Arrows: orange (unphosphorylated PLIN2), blue (phosphorylated PLIN2). Values are mean ± SEM. Differences are significant for ***P<0.001 using Student’s _t-_test. Uncropped images of blots are shown in Supplementary Figure 8. Source data is available in Supplementary Table 1.
Figure 5
Cells expressing CMA-mutant PLIN2 accumulate LD. (a) Immunoblot for indicated proteins of total cell lysates from untransfected cells (−) or cells transfected with wild-type (WT) or CMA-mutant (MT) PLIN2-GFP. o: overexpressed protein; e: endogenous protein. Representative blots of n=3 independent experiments. (b) Cells expressing WT or MT PLIN2-GFP. Inset: Higher magnification of the boxed area. Graphs: average LD number or LD size. n=5 (LD number) and 3 (LD size) independent experiments with 40 cells per condition in each experiment. (c) Cells expressing WT or MT PLIN2-GFP treated with OL with or without lysosomal inhibitors ammonium chloride and leupeptin (NL). Inset: Higher magnification of the boxed area. Graphs: average LD number or LD size. n=5 (LD number) and 3 (LD size) independent experiments with 40 cells per condition in each experiment. (d) Immunostaining for LAMP1 in cells treated as in (c). Top: Merged images. Bottom: Colocalized pixels in white. Insets: higher magnification. Graph: percentage colocalization of PLIN2-GFP with LAMP1. n=5 independent experiments with 40 cells per condition in each experiment. (e) Binding of WT and MT PLIN2-GFP from cellular extracts to GST-hsc70 immobilized on agarose beads. Representative blots of n=3 independent experiments. (f, g) Immunostaining for hsc70 in OL-treated cells expressing WT or MT PLIN2-GFP. Colocalized pixels are in white. Insets: higher magnification. 3D-reconstruction shown in Supplementary Figure 4a. Graph: percentage colocalization of PLIN2-GFP with hsc70. n=5 independent experiments with 40 cells per condition in each experiment. (h–j) Live-cell imaging of cells cotransfected with WT or MT PLIN2-GFP and LAMP1-RFP and treated with OL. Sequential frames at 60s intervals are shown. Arrows: LD. Graphs: LD (i) kiss-run events/cell and (j) count/cell, tracking velocity, displacement and displacement rate. Small and large LD clusters defined as <1μm3 and >1μm3, respectively. 5i: n=24 cells from 3 independent experiments. 5j: n=103 (WT) and 85 (MT) LD clusters from 6 (WT) and 8 (MT) movies with >8 cells/movie from 2 independent experiments. Values are mean ± SEM. Differences are significant for *P<0.05, **P<0.01, ***P<0.001 using Student’s _t-_test. Uncropped images of blots are shown in Supplementary Figure 8. Source data is available in Supplementary Table 1.
Figure 6
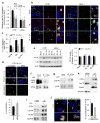
Failure to remove PLINs by CMA blocks lipolysis. (a) Beta-oxidation rates in CTR and L2A(−) cells treated with OL followed by lipase inhibitor diethylumbelliferyl phosphate (Deup) and/or lysosomal inhibitors ammonium chloride and leupeptin (NL). n=3 independent experiments. (b, c) Costaining for DPH and ATGL in CTR and L2A(−) cells untreated or treated with OL or incubated with serum-supplemented medium (OL>S+) after OL treatment. Colocalized pixels are in white. Right: Higher magnification of boxed area. Graph: percentage colocalization of DPH with ATGL. n=6 independent experiments with 40 cells per condition in each experiment. (d) Costaining for BODIPY493/503 and ATGL in CTR cells incubated in OL>S+ treated or not with atypical retinoic acid derivative (aRAd). Middle: Higher magnification area. Bottom: Colocalized pixels. Graph: percentage colocalization of BODIPY with ATGL. n=5 independent experiments with 40 cells per condition in each experiment. (e) Immunoblot for indicated proteins in total cell lysates from CTR and L2A(−) cells untreated or treated with OL or incubated with serum-supplemented medium (OL>S+) or serum-deprived medium (OL>S−) after OL treatment. Graph: ATGL levels relative to untreated CTR cells. n=3 independent experiments. (f, g) Coimmunoprecipitation (IP) of ATGL in OL>S+ (f) or OL-treated (g) CTR (+) and L2A(−) cells. Cells in (f) are expressing G0S2-GFP. 1/10 input shown. Representative blots from n=3 (f) and 5 (g) independent experiments. (h, i) Immunoblot for indicated proteins of homogenates (HOM) and lipid droplets (LD) isolated from fed (F) or starved (S) rat livers (h), or starved wild-type (+) or L2A knockout (−) mice livers (i). Representative blots of n=4 (i; 3 additional blots shown in Supplementary Figure 5c) and 7(h) independent experiments. (j) Immunostaining for ATGL in OL-treated cells expressing WT or MT PLIN2-GFP. Inset: Higher magnification of the boxed area. Graph: percentage colocalization of ATGL with PLIN2-GFP. n=5 independent experiments with 40 cells per condition in each experiment. Values are mean ± SEM. Differences are significant for *P<0.05, **P<0.01, ***P<0.001 using Student’s _t-_test. Uncropped images of blots are shown in Supplementary Figure 8. Source data is available in Supplementary Table 1.
Figure 7
Failure to remove PLINs by CMA blocks macrolipophagy. (a) BODIPY493/503 staining in CTR and L2A(−) cells untreated or treated with OL, or treated with 3-methyladenine (3MA) or lysosomal inhibitors ammonium chloride and leupeptin (NL). Full fields shown in Supplementary Figure 5c. Graph: average LD number/cell. n=9 fields with 1350 cells per condition from 3 independent experiments. (b, c) Cells stained as in (a) treated or not with rapamycin (Rapa). Insets: higher magnification. Graph: Average LD number/cell. n=9 fields with 1350 cells per condition from 3 independent experiments. (d) Immunoblot for indicated proteins in homogenates (HOM) and lipid droplets (LD) isolated from livers for fed (F) and starved (S) rats. Representative blots of n=5 independent experiments. (e, f) Costaining for indicated ATG proteins and BODIPY493/503 in CTR and L2A(−) cells treated with OL. Insets: Higher magnification of the boxed areas with colocalized pixels in white. Graph: percentage colocalization with BODIPY. n=6 independent experiments with 40 cells per condition in each experiment. (g) Costaining for Rab7 in the same cells as in (e). Graph: percentage colocalization with BODIPY. n=4 independent experiments with 40 cells per condition in each experiment. (h) Immunoblot for indicated proteins of HOM and LD isolated from starved wild-type (+) or L2A knockout (−) mice livers. (i) Immunostaining for LC3 in cells expressing WT or MT PLIN2-GFP treated with OL. Inset: Higher magnification of the boxed area with colocalized pixels in white. 3D-reconstruction shown in Supplementary Figure 7c. Graph: percentage colocalization of LC3 with PLIN2-GFP. n=4 independent experiments with 40 cells per condition in each experiment. Values are mean ± SEM. Differences are significant for **P<0.01, ***P<0.001 using Student’s _t-_test. Uncropped images of blots are shown in Supplementary Figure 8. Source data is available in Supplementary Table 1.
Figure 8
Scheme of the interplay of CMA with cytosolic and lysosomal lipolysis through PLIN2 and PLIN3 degradation. Left: Removal and degradation by CMA of lipid droplets (LD) associated proteins PLIN2 and PLIN3 facilitates access of the lipid core to the cytosolic lipase ATGL. Similarly, elimination of PLINs also allows for proteins involved in autophagosome formation (ATG) to anchor on the LD and initiate the sequestration of regions of LD in autophagosomes (APH) for delivery to lysosomes for degradation (macrolipophagy). Right: When CMA activity is compromised, the inability to remove PLINs from the surface of the LD prevents access of ATGL and ATGs to the lipid core and inhibits lipolysis by both pathways (cytosolic lipases and macrolipophagy).
Comment in
- Breaking the Barrier--Chaperone-Mediated Autophagy of Perilipins Regulates the Lipolytic Degradation of Fat.
Schweiger M, Zechner R. Schweiger M, et al. Cell Metab. 2015 Jul 7;22(1):60-1. doi: 10.1016/j.cmet.2015.06.017. Cell Metab. 2015. PMID: 26154053
Similar articles
- AMPK-dependent phosphorylation of lipid droplet protein PLIN2 triggers its degradation by CMA.
Kaushik S, Cuervo AM. Kaushik S, et al. Autophagy. 2016;12(2):432-8. doi: 10.1080/15548627.2015.1124226. Autophagy. 2016. PMID: 26902588 Free PMC article. - Hormone-sensitive lipase preferentially redistributes to lipid droplets associated with perilipin-5 in human skeletal muscle during moderate-intensity exercise.
Whytock KL, Shepherd SO, Wagenmakers AJM, Strauss JA. Whytock KL, et al. J Physiol. 2018 Jun;596(11):2077-2090. doi: 10.1113/JP275502. Epub 2018 Apr 11. J Physiol. 2018. PMID: 29527681 Free PMC article. - Decoration of myocellular lipid droplets with perilipins as a marker for in vivo lipid droplet dynamics: A super-resolution microscopy study in trained athletes and insulin resistant individuals.
Gemmink A, Daemen S, Brouwers B, Hoeks J, Schaart G, Knoops K, Schrauwen P, Hesselink MKC. Gemmink A, et al. Biochim Biophys Acta Mol Cell Biol Lipids. 2021 Feb;1866(2):158852. doi: 10.1016/j.bbalip.2020.158852. Epub 2020 Nov 4. Biochim Biophys Acta Mol Cell Biol Lipids. 2021. PMID: 33160079 - The ménage à trois of autophagy, lipid droplets and liver disease.
Filali-Mouncef Y, Hunter C, Roccio F, Zagkou S, Dupont N, Primard C, Proikas-Cezanne T, Reggiori F. Filali-Mouncef Y, et al. Autophagy. 2022 Jan;18(1):50-72. doi: 10.1080/15548627.2021.1895658. Epub 2021 Apr 2. Autophagy. 2022. PMID: 33794741 Free PMC article. Review. - Role of lipid droplet proteins in liver steatosis.
Okumura T. Okumura T. J Physiol Biochem. 2011 Dec;67(4):629-36. doi: 10.1007/s13105-011-0110-6. Epub 2011 Aug 17. J Physiol Biochem. 2011. PMID: 21847662 Review.
Cited by
- Lipid Droplets: A Cellular Organelle Vital for Thermogenesis.
Chen L, Jin Y, Wu J, Ren Z. Chen L, et al. Int J Biol Sci. 2022 Oct 24;18(16):6176-6188. doi: 10.7150/ijbs.77051. eCollection 2022. Int J Biol Sci. 2022. PMID: 36439883 Free PMC article. Review. - SAR1B GTPase is necessary to protect intestinal cells from disorders of lipid homeostasis, oxidative stress, and inflammation.
Sané A, Ahmarani L, Delvin E, Auclair N, Spahis S, Levy E. Sané A, et al. J Lipid Res. 2019 Oct;60(10):1755-1764. doi: 10.1194/jlr.RA119000119. Epub 2019 Aug 13. J Lipid Res. 2019. PMID: 31409740 Free PMC article. - Therapeutic regulation of autophagy in hepatic metabolism.
Byrnes K, Blessinger S, Bailey NT, Scaife R, Liu G, Khambu B. Byrnes K, et al. Acta Pharm Sin B. 2022 Jan;12(1):33-49. doi: 10.1016/j.apsb.2021.07.021. Epub 2021 Jul 28. Acta Pharm Sin B. 2022. PMID: 35127371 Free PMC article. Review. - A C9orf72-CARM1 axis regulates lipid metabolism under glucose starvation-induced nutrient stress.
Liu Y, Wang T, Ji YJ, Johnson K, Liu H, Johnson K, Bailey S, Suk Y, Lu YN, Liu M, Wang J. Liu Y, et al. Genes Dev. 2018 Nov 1;32(21-22):1380-1397. doi: 10.1101/gad.315564.118. Epub 2018 Oct 26. Genes Dev. 2018. PMID: 30366907 Free PMC article. - Biogenesis and Breakdown of Lipid Droplets in Pathological Conditions.
Fader Kaiser CM, Romano PS, Vanrell MC, Pocognoni CA, Jacob J, Caruso B, Delgui LR. Fader Kaiser CM, et al. Front Cell Dev Biol. 2022 Feb 7;9:826248. doi: 10.3389/fcell.2021.826248. eCollection 2021. Front Cell Dev Biol. 2022. PMID: 35198567 Free PMC article. Review.
References
- Mizushima N, Komatsu M. Autophagy: renovation of cells and tissues. Cell. 2011;147:728–741. - PubMed
- Dice JF. Peptide sequences that target cytosolic proteins for lysosomal proteolysis. Trends Biochem Sci. 1990;15:305–309. - PubMed
- Chiang HL, Terlecky SR, Plant CP, Dice JF. A role for a 70-kilodalton heat shock protein in lysosomal degradation of intracellular proteins. Science. 1989;246:382–385. - PubMed
Publication types
MeSH terms
Substances
Grants and funding
- R01 AG021904/AG/NIA NIH HHS/United States
- P30 DK041296/DK/NIDDK NIH HHS/United States
- AG031782/AG/NIA NIH HHS/United States
- R37 AG021904/AG/NIA NIH HHS/United States
- AG038072/AG/NIA NIH HHS/United States
- P30 DK020541/DK/NIDDK NIH HHS/United States
- P30 AG038072/AG/NIA NIH HHS/United States
- P60 DK020541/DK/NIDDK NIH HHS/United States
- R01 DK098408/DK/NIDDK NIH HHS/United States
- P30 CA013330/CA/NCI NIH HHS/United States
- DK098408/DK/NIDDK NIH HHS/United States
- P01 AG031782/AG/NIA NIH HHS/United States
- AG021904/AG/NIA NIH HHS/United States
LinkOut - more resources
Full Text Sources
Other Literature Sources
Molecular Biology Databases
Research Materials
Miscellaneous
