Calcium release through P2X4 activates calmodulin to promote endolysosomal membrane fusion - PubMed (original) (raw)
Calcium release through P2X4 activates calmodulin to promote endolysosomal membrane fusion
Qi Cao et al. J Cell Biol. 2015.
Abstract
Intra-endolysosomal Ca(2+) release is required for endolysosomal membrane fusion with intracellular organelles. However, the molecular mechanisms for intra-endolysosomal Ca(2+) release and the downstream Ca(2+) targets involved in the fusion remain elusive. Previously, we demonstrated that endolysosomal P2X4 forms channels activated by luminal adenosine triphosphate in a pH-dependent manner. In this paper, we show that overexpression of P2X4, as well as increasing endolysosomal P2X4 activity by alkalinization of endolysosome lumen, promoted vacuole enlargement in cells and endolysosome fusion in a cell-free assay. These effects were prevented by inhibiting P2X4, expressing a dominant-negative P2X4 mutant, and disrupting the P2X4 gene. We further show that P2X4 and calmodulin (CaM) form a complex at endolysosomal membrane where P2X4 activation recruits CaM to promote fusion and vacuolation in a Ca(2+)-dependent fashion. Moreover, P2X4 activation-triggered fusion and vacuolation were suppressed by inhibiting CaM. Our data thus suggest a new molecular mechanism for endolysosomal membrane fusion involving P2X4-mediated endolysosomal Ca(2+) release and subsequent CaM activation.
© 2015 Cao et al.
Figures
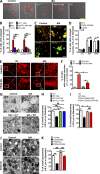
Figure 1.
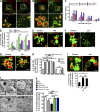
Alkalinization induced LEL vacuolation in a P2X4-dependent manner. (A–D) Cos1 cells were transiently transfected with Lamp1-GFP, rP2X4-GFP, or its dominant-negative mutant rP2X4-C353W-GFP. LELs were labeled with Texas red 10-kD dextran. (A) Expression of rP2X4-GFP increased LEL vacuole sizes as compared with Lamp1-GFP. (B) 10 mM MA (1 h) treatment caused vacuole enlargement in cells that expressed rP2X4-GFP or Lamp1-GFP. (C) Histogram for vacuole size distributions under the conditions indicated. Data were pooled from 24 cells for each condition. Note, MA and Baf-A1 treatment increased the number of larger diameter vacuoles, which was further enhanced by P2X4 expression. (D) Summary of percentage of vacuolated cells (with at least three vacuoles of >2 µm in diameter) from three independent experiments run in triplicates and >250 cells counted for each experiment. Coexpression of rP2X4-C353W diminished MA-induced vacuolation in cells expressing rP2X4-GFP. NT, not treated. (E) Cos1 cells expressing rP2X4-H286A-GFP showed enlarged vacuoles, which was not affected by MA. (F) Copper inhibited MA-induced vacuolation in Cos1 cells expressing rP2X4-GFP. Cells were pretreated with 20 µM CuSO4 for 5 h at 37°C and then incubated with 10 mM MA for 1 h. (G) Incubation with Cu2+ (100 µM CuSO4 overnight) reduced vacuole size in Cos1 cells expressing P2X4-H286A-GFP. (H) Summary of percentage of vacuolated cells expressing rP2X4-GFP or rP2X4-H286A-GFP illustrating the effects of MA and Baf-1 and the inhibition by Cu2+. Note, Cu2+ was coapplied with MA for the P2X4 group. Analyses were performed as described in D. (I) MA-induced vacuolation in cells expressing P2X4-H140A-GFP was unaffected by Cu2+ treatment. Quantification of vacuolated cells is shown on the right. Analyses were performed as described in D. (J) TEM images of Cos1 cells that expressed P2X4-GFP showing MA-induced vacuolation and its inhibition by Cu2+ and W7. (K) Quantification of the percentage of lysosomes with diameters <0.5 µm per TEM field. 10 randomly selected fields were counted each time, and each sample was counted at least three times from two randomly chosen TEM sample grids. Bars: (fluorescence images) 5 µm; (TEM images) 0.5 µm. Values are means ± SEM; *, P < 0.05; **, P < 0.01.
Figure 2.
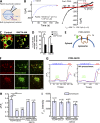
P2X4-mediated LEL Ca2+ release was involved in alkalinization-induced vacuolation. (A) Illustration of whole-lysosome recording configuration. Enlarged LELs were manually isolated from cells pretreated with 1 µM vacuolin-1 (>2 h). The pipette (luminal) solution contained 105 mM of isotonic Ca2+. The bath (cytoplasmic) solution was a K+-based internal solution. The inward current indicates cations flowing out of the LEL (arrow). (B) Ca2+ currents (inward) recorded from whole-lysosome patches using a pipette solution that contained Ca2+ as the sole cation, and 0.1 mM ATP with pH set to 7.4 to activate P2X4 from the vacuole expressing P2X4-GFP. (left) Time course of current at −140 mV with 0 representing the time of whole-lysosome patch formation; (right) current–voltage (I-V) relationship at the time points indicated. The mean maximal current amplitudes at −140 mV for four vacuoles are indicated at the bottom. (C) Preincubation with 10 µM BAPTA-AM (30 min at 37°C) suppressed the effect of MA on vacuolation in Cos1 cells expressing rP2X4-GFP. (D) Summary of vacuolated cells showing that BAPTA-AM pretreatment significantly blocked vacuolation induced by MA or Baf-A1. Values are means ± SEM; *, P < 0.05. (E) P2X4-GECO fusion strategy. GECO was fused to the C terminus of P2X4. (F) Colocalization of P2X4-GECO (top) or P2X4-C353W-GECO (bottom) with Lamp1-mCherry in Cos1 cells. (G) 10 mM MA (1 h) pretreatment of HEK293T cells that expressed P2X4-GECO significantly reduced 200 µM GPN-induced increase in GECO signal, indicating a loss of lysosomal Ca2+ content by MA. Representative GECO responses to GPN in three P2X4-GECO–expressing cells are shown for control (left) and MA treatment (right) groups. Iono, ionomycin. (H) Summary of peak GPN-induced increases in GECO fluorescence in cells that expressed P2X4-GECO or P2X4-C353W-GECO. Cells were pretreated or not treated with MA or NH4Cl (both at 10 mM for 1 h) as indicated. The treatment solution was replaced with normal solution before GPN application. Numbers of cells tested are indicated in parentheses. Note, MA did not deplete lysosomal Ca2+ in cells that expressed P2X4-C353W-GECO. Values are means ± SEM; *, P < 0.05, **, P < 0.01. (I) Comparable expression levels of P2X4-GECO and P2X4-C353W-GECO. Expression level of GECO was estimated by the maximal fluorescence signal induced by 1 µM ionomycin. Values are means ± SEM. Bars, 5 µm. F, fluorescence.
Figure 3.
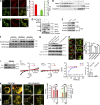
P2X4 activation recruited CaM to LEL membranes. (A) Immunocytochemistry of WT Cos1 cells stained with anti-CaM (or a control IgG) and anti-Lamp1. Most Lamp1-positive puncta contained CaM. Summary data collected from 40 cells are shown on the right; three independent experiments; means ± SEM. Bar, 10 µm. (B) Western blots showing the presence of CaM in Lamp1-containing LEL fractions (fractions 1–6). Note the presence of CaM (fractions 11 and 12) also in mitochondrial fractions as indicated by the presence of complex II. (C) Immunocytochemistry of WT Cos1 cells stained with anti-P2X4 and anti-CaM. CaM-positive puncta largely colocalized with P2X4-labeled organelles. Bar, 5 µm. (D) Co-IP of P2X4 and CaM. Cos1 cells were transiently transfected with CaM-myc-his, P2X4-HA, and TRPML1-myc (ML1-myc) alone or in combinations as indicated. After 24 h, LEL (fractions 1–6 as in B) were collected and lysed by adding 0.5% Triton X-100. Samples were immunoprecipitated with protein A/G–anti-myc and blotted with anti-HA and vice versa. The anti-myc Western (immunoblot [IB]-myc) in immunoprecipitation (IP)-myc samples and anti-HA Western (immunoblot-HA) in immunoprecipitation-HA samples showed similar levels of protein inputs in the immunoprecipitation assays. Anti-Lamp1 Western (immunoblot-Lamp1) was also used as a control for the amount of LELs subjected to immunoprecipitation. (E) Co-IP of endogenous CaM and P2X4 in Cos1 cell LEL fractions. IgG was used as a negative control. The lower blots show comparable inputs of P2X4 and Lamp1 in the LEL preparations. (F) Co-IP of P2X4 and CaM in isolated Cos1 cell LEL preparations with the immunoprecipitation buffer containing 0, 100 nM, or 10 µM free Ca2+ (buffered by EGTA). Samples from 10 mM MA (2 h)- and 200 nM Baf-A1 (2 h)–treated cells showed increased association between P2X4 and CaM. The presence of Ca2+ in the co-IP solution also enhanced the P2X4-CaM association. NT, not treated. (G) P2X4 activity enhanced association between P2X4 and CaM. P2X4-C353W-GFP had weak or no association with CaM even with MA treatment, whereas P2X4-H286A-GFP displayed strong association with CaM without MA treatment. Note, the dead but not dominant-negative P2X4-S341W-GFP associated with CaM probably because of the functionality of endogenous P2X4. (H) Colocalization of CaM with vacuoles that contained P2X4-GFP, P2X4-H286A-GFP, and P2X4-S341W-GFP but not those that had P2X4-C353W-GFP. Cells treated with MA are indicated. Summary data for colocalization coefficients (Rr) of GFP and CaM are shown on the right. (n = 52 cells, three independent experiments; means ± SEM; *, P < 0.05; **, P < 0.01 by analysis of variance.) These data suggest that activation of P2X4 recruits CaM to P2X4-containing LEL vacuoles. Bars: (left) 10 µm; (right) 2 µm. (I) Western blot showing expression of endogenous P2X4 in control (vector transfected) C2C12 cells and cells with the gene for P2X4 knocked out (KO) using the CRISPR-Cas9 system. Two guide DNA constructs (1 and 2) with independent targets on the P2X4 gene were used to exclude potential off-targeting effects. The faint P2X4 bands detected in P2X4 knockout cell lysates probably represent a small amount of residual proteins from either transfected or nontransfected cells. (J) 1 mM ATP evoked currents in whole-lysosome patches for WT and P2X4 knockout C2C12 cells. Pipette solution had pH 7.4. I-V curves for indicated time points after whole-lysosome formation, and time courses for currents at −140 mV are shown. The dotted line indicates 0 pA. Peak current amplitudes at −140 mV are summarized on the right. (K) P2X4 deficiency resulted in decreased colocalization of CaM with Lamp1 in C2C12 cells. Immunocytochemistry images are shown on the left. Cells were either treated with MA or not treated. Summary data for Rr between CaM and Lamp1 are show on the right. (_n_ > 28 cells for each condition, three independent experiments; means ± SEM; *, P < 0.05; **, P < 0.01 by analysis of variance.) Bars: (whole-cell images) 5 µm; (magnifications) 3 µm.
Figure 4.
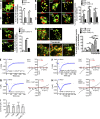
CaM was involved in P2X4-mediated vacuolation. (A) A CaM inhibitor, 10 µM W7 (1 h) significantly suppressed MA-induced vacuolation in Cos1 cells expressing rP2X4-GFP. Summary of vacuolated cells is shown on the right. Vacuolation was induced by either MA or Baf A1 as indicated. (B) Vacuolation of rP2X4-GFP expressing Cos1 cells was enhanced by coexpression of WT CaM but suppressed by that of CaM(1–4), a dominant-negative CaM mutant. Bar graph at right shows percentage of vacuolated cells under conditions indicated. (C) Coexpression of CaM(1–4) dramatically reduced vacuolation in Cos1 cells that expressed rP2X4-H286A-GFP. The bar graph on the right shows the percentage of vacuolated cells in untransfected (WT) and rP2X4-H286A-GFP–transfected Cos1 cells without or with CaM(1–4). (D) Vacuolation in Cos1 cells that expressed Lamp1-GFP without or with WT CaM or CaM(1–4). 0.4 µM thapsigargin (90 min) was applied as indicated. Thapsigargin increase vacuolation, which was enhanced by CaM but suppressed by CaM(1–4). Summary of vacuolated cells under the indicated conditions is shown on the right. Bars, 5 µm. (E–I) CaM did not alter P2X4 currents in whole-lysosome patches. Enlarged vacuoles were obtained from cells that expressed P2X4-GFP (E and F), P2X4-GFP + CaM (G), and P2X4-GFP + CaM(1–4) (H) and recorded using a pipette solution that contained 0.1 mM ATP with pH set at 7.4, without (E, G, and H) or with 10 µM Ca2+ and 5 µM CaM (F). Left graphs show current development at −140 mV after the formation of whole-lysosome configuration; right graphs show I-V curves of currents at the indicated time points. (I) Summary of peak currents at −140 mV. All cells expressed P2X4-GFP. CaM: addition of purified CaM in the bath; rCaM and rCaM(1–4): cotransfection of rat CaM constructs. Values are means ± SEM; *, P < 0.05; **, P < 0.01.
Figure 5.
Activation of endogenous P2X4 induced vacuolation in a Ca2+/CaM-dependent manner. (A) MA-induced vacuole enlargement in Cos1 cells loaded with Texas red 10-kD dextran was inhibited by pretreatment with 20 µM CuSO4, 10 µM BAPTA-AM, or 3 µM W7. Bar, 10 µm. (B) Percentage of vacuolated cells in WT or Lamp1-GFP–expressing Cos1 cells under indicated conditions. NT, not treated. (C) Expression of P2X4-C353W-GFP suppressed MA-induced vacuolation in Cos1 cells. Lamp1-GFP–expressing cells were used as controls. Bar, 5 µm. (D) Percentage of vacuolated cells induced by MA or Baf-A1 in WT Cos1 cells and cells that expressed P2X4-C353W-GFP or Lamp1-GFP. (E and F) P2X4 knockout in C2C12 cells suppressed MA-induced vacuolation. WT and P2X4 knockout C2C12 cells were treated with 10 mM MA for 3 h, and cells were fixed and stained for Lamp1. Shown are representative images (E) and statistics for cells that contained vacuoles with diameters >1 µm (F). Bars: (whole-cell images) 10 µm; (magnifications) 3 µm. (G–J) Representative TEM images (left) and statistics of LELs with diameters <0.5 µm (right) for WT Cos1 cells (G) untransfected (WT) and P2X4-C353W-GFP–transfected Cos1 cells (I) and control (vector transfected) and P2X4 knockout (KO) C2C12 cells (J) untreated or treated with MA. Note the large vacuoles and scarcity of smaller LELs in MA-treated cells. Cu2+ and W7 (all conditions are the same as in A) prevented MA induced reduction of smaller LELs (G). Expression of P2X4-C353W-GFP (I) and P2X4 knockout (J and K) also suppressed the MA effect. For quantification, LELs in 10 randomly selected fields were counted each time, and each sample was counted at least three times from four randomly chosen TEM sample grids. Bars, 0.5 µm. Quantification data in A–K. Values are means ± SEM; *, P < 0.05; **, P < 0.01.
Figure 6.
Activation of P2X4 induced LEL membrane fusion in vivo in a Ca2+/CaM-dependent manner. (A) Live cell time-lapse images showing the fusion of two Texas red dextran-loaded vacuoles (arrows) in cells expressing rP2X4-GFP after MA treatment. (B) Quantification of fusion events per cell within 45 min under indicated conditions monitored by live imaging in Cos1 cells expressing rP2X4-GFP. (C) Live cell imaging showing the fusion of two LELs (arrows) in Cos1 cells expressing Lamp1-GFP. (D) Quantification of fusion events per cell under indicated conditions monitored by live imaging in Cos1 cells expressing Lamp1-GFP. Number of cells recorded was indicated on top of each bar. Experiments were repeated three times independently. Note, the number of fusion events was increased by MA, which was inhibited by Cu2+, BAPTA-AM, W7, or expression of P2X4-C353W. (B and D) Values are means ± SEM; *, P < 0.05; **, P < 0.01. Bars, 5 µm. NT, not treated.
Figure 7.
Activation of P2X4–CaM pathway induced LEL fusion in a cell-free system. (A) LELs isolated from Cos1 cells expressing P2X4-GFP and P2X4-DsRed individually were mixed to view the fusion in vitro. MA dramatically increased LEL fusion, which was inhibited by the addition of 20 µM Cu2+, 10 µM BAPTA, and 3 µM W7 in the incubation solution. (B) Similar to A but LELs were isolated from Cos1 cells expressing Lamp1-GFP and Lamp1-mCherry individually. (C) Fluorescence-labeled LEL as shown in A and B were analyzed for Pearson’s colocalization coefficient (Rr). A larger Rr indicates more colocalization/fusion. LEL expressing P2X4 showed significantly more fusion than those from cells that expressed the Lamp1-GFP/Lamp1-mCherry, which were further increased by MA. Cu2+, BAPTA, and W7 inhibited MA-induced LEL fusion. (D) Baf-A1 increased P2X4-mediated fusion, which was also suppressed by Cu2+, BAPTA, and W7. (E) LEL from Cos1 cells that expressed dominant-negative P2X4-C353W showed reduced colocalization, suggesting that inhibition of endogenous P2X4 decreased LEL fusion. (F) In C2C12 cells, P2X4 knockout reduced MA- and Baf-A1–induced fusion between LEL that contained Lamp1-GFP and that contained Lamp1-mCherry in the in vitro assay, supporting the critical role of P2X4 in LEL fusion. Values are means ± SEM from three independent experiments for C–F; *, P < 0.05; **, P < 0.01. Bars: (A and C) 10 µm; (E and F) 15 µm. KO, knockout; NT, not treated.
Similar articles
- P2X4 Receptors Mediate Ca2+ Release from Lysosomes in Response to Stimulation of P2X7 and H1 Histamine Receptors.
Tan SL, Barri M, Atakpa-Adaji P, Taylor CW, St John Smith E, Murrell-Lagnado RD. Tan SL, et al. Int J Mol Sci. 2021 Sep 28;22(19):10492. doi: 10.3390/ijms221910492. Int J Mol Sci. 2021. PMID: 34638832 Free PMC article. - P2X4 forms functional ATP-activated cation channels on lysosomal membranes regulated by luminal pH.
Huang P, Zou Y, Zhong XZ, Cao Q, Zhao K, Zhu MX, Murrell-Lagnado R, Dong XP. Huang P, et al. J Biol Chem. 2014 Jun 20;289(25):17658-67. doi: 10.1074/jbc.M114.552158. Epub 2014 May 9. J Biol Chem. 2014. PMID: 24817123 Free PMC article. - The lysosomal Ca2+ release channel TRPML1 regulates lysosome size by activating calmodulin.
Cao Q, Yang Y, Zhong XZ, Dong XP. Cao Q, et al. J Biol Chem. 2017 May 19;292(20):8424-8435. doi: 10.1074/jbc.M116.772160. Epub 2017 Mar 30. J Biol Chem. 2017. PMID: 28360104 Free PMC article. - P2X4 and lysosome fusion.
Murrell-Lagnado RD, Frick M. Murrell-Lagnado RD, et al. Curr Opin Pharmacol. 2019 Aug;47:126-132. doi: 10.1016/j.coph.2019.03.002. Epub 2019 Apr 28. Curr Opin Pharmacol. 2019. PMID: 31039505 Review. - P2X4: A fast and sensitive purinergic receptor.
Suurväli J, Boudinot P, Kanellopoulos J, Rüütel Boudinot S. Suurväli J, et al. Biomed J. 2017 Oct;40(5):245-256. doi: 10.1016/j.bj.2017.06.010. Epub 2017 Nov 10. Biomed J. 2017. PMID: 29179879 Free PMC article. Review.
Cited by
- The evolution of organellar calcium mapping technologies.
Zajac M, Modi S, Krishnan Y. Zajac M, et al. Cell Calcium. 2022 Dec;108:102658. doi: 10.1016/j.ceca.2022.102658. Epub 2022 Oct 11. Cell Calcium. 2022. PMID: 36274564 Free PMC article. Review. - The multifaceted role of cell cycle regulators in the coordination of growth and metabolism.
Huber K, Mestres-Arenas A, Fajas L, Leal-Esteban LC. Huber K, et al. FEBS J. 2021 Jun;288(12):3813-3833. doi: 10.1111/febs.15586. Epub 2020 Oct 25. FEBS J. 2021. PMID: 33030287 Free PMC article. Review. - Readily Releasable Stores of Calcium in Neuronal Endolysosomes: Physiological and Pathophysiological Relevance.
Lakpa KL, Halcrow PW, Chen X, Geiger JD. Lakpa KL, et al. Adv Exp Med Biol. 2020;1131:681-697. doi: 10.1007/978-3-030-12457-1_27. Adv Exp Med Biol. 2020. PMID: 31646530 Free PMC article. Review. - P2x4 receptor promotes mammary cancer progression by sustaining autophagy and associated mesenchymal transition.
Chadet S, Allard J, Brisson L, Lopez-Charcas O, Lemoine R, Heraud A, Lerondel S, Guibon R, Fromont G, Le Pape A, Angoulvant D, Jiang LH, Murrell-Lagnado R, Roger S. Chadet S, et al. Oncogene. 2022 May;41(21):2920-2931. doi: 10.1038/s41388-022-02297-8. Epub 2022 Apr 11. Oncogene. 2022. PMID: 35411034 - P2X4 Receptors Mediate Ca2+ Release from Lysosomes in Response to Stimulation of P2X7 and H1 Histamine Receptors.
Tan SL, Barri M, Atakpa-Adaji P, Taylor CW, St John Smith E, Murrell-Lagnado RD. Tan SL, et al. Int J Mol Sci. 2021 Sep 28;22(19):10492. doi: 10.3390/ijms221910492. Int J Mol Sci. 2021. PMID: 34638832 Free PMC article.
References
- Bakker A.C., Webster P., Jacob W.A., and Andrews N.W.. 1997. Homotypic fusion between aggregated lysosomes triggered by elevated [Ca2+]i in fibroblasts. J. Cell Sci. 110:2227–2238. - PubMed
Publication types
MeSH terms
Substances
Grants and funding
- R01 GM081658/GM/NIGMS NIH HHS/United States
- R01 GM092759/GM/NIGMS NIH HHS/United States
- 201109MSH-261462-208625/Canadian Institutes of Health Research/Canada
- MOP-119349/Canadian Institutes of Health Research/Canada
LinkOut - more resources
Full Text Sources
Other Literature Sources
Molecular Biology Databases
Miscellaneous
