mTOR activates the VPS34-UVRAG complex to regulate autolysosomal tubulation and cell survival - PubMed (original) (raw)
mTOR activates the VPS34-UVRAG complex to regulate autolysosomal tubulation and cell survival
Michael J Munson et al. EMBO J. 2015.
Abstract
Lysosomes are essential organelles that function to degrade and recycle unwanted, damaged and toxic biological components. Lysosomes also act as signalling platforms in activating the nutrient-sensing kinase mTOR. mTOR regulates cellular growth, but it also helps to maintain lysosome identity by initiating lysosomal tubulation through a process termed autophagosome-lysosome reformation (ALR). Here we identify a lysosomal pool of phosphatidylinositol 3-phosphate that, when depleted by specific inhibition of the class III phosphoinositide 3-kinase VPS34, results in prolonged lysosomal tubulation. This tubulation requires mTOR activity, and we identified two direct mTOR phosphorylation sites on UVRAG (S550 and S571) that activate VPS34. Loss of these phosphorylation sites reduced VPS34 lipid kinase activity and resulted in an increase in number and length of lysosomal tubules. In cells in which phosphorylation at these UVRAG sites is disrupted, the result of impaired lysosomal tubulation alongside ALR activation is massive cell death. Our data imply that ALR is critical for cell survival under nutrient stress and that VPS34 is an essential regulatory element in this process.
Keywords: UVRAG; VPS34; lysosome; mTOR; tubule.
© 2015 The Authors. Published under the terms of the CC BY 4.0 license.
Figures
Figure 1
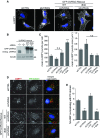
PI(3)P is present at the lysosome
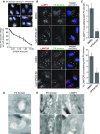
- U2OS cells were treated with indicated concentrations of VPS34-IN1 for 1 h, fixed and stained with a recombinant PX domain Alexa Fluor-594 conjugate. Graph represents mean PX domain staining following titration of VPS34-IN1 in U2OS cells for 1 h ± SEM for n = 3 independent experiments. Scale bar, 10 μm.
- U2OS cells were treated for 1 h as indicated and stained for LAMP1 or LAMTOR and PI(3)P utilising the PX domain conjugate; arrowheads indicate co-localising punctate structures. Scale bar, 10 μm.
- Quantitation of LAMP1 or LAMTOR and PX domain co-localisation from (B), mean ± SEM for n = 3 independent experiments. Significance was determined by Student’s _t_-test, *P < 0.05.
- Transition electron micrograph sections of U2OS cells grown in complete medium and labelled with recombinant GST-PX domain and anti-GST gold conjugate. Scale bar, 500 nm.
- Electron micrograph sections of U2OS cells as in (D) labelled for PX domain or LAMP1. Scale bar, 500 nm.
Figure 2
Inhibition of VPS34 alters autolysosomal morphology
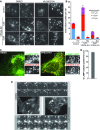
- Images from live U2OS cells stably expressing LAMP1-mCherry that were treated as indicated for 1 h. White squares denote magnified regions shown to the right. Scale bar, 10 μm.
- Quantitation from (A) of mean tubules per cell and tubule length as indicated ± SEM for n = 3 independent experiments.
- Live cell images of U2OS cells expressing LAMP1-GFP and mCherry-LC3 grown in complete medium and treated with DMSO or 1 μM VPS34-IN1 for 1 h. Arrow heads in boxed regions highlight tubular co-localisation of LAMP1-GFP and mCherry-LC3.
- Quantitation of co-localisation of LAMP1 tubules with LC3 from (C). Mean ± SEM for n =3 independent experiments.
- Still images from live cell microscopy shown in Supplementary Movie S1A and B. For control (DMSO), magnified frames are shown above the cell from the area marked with an asterisk. For VPS34-IN1 treatment, frames are shown below. Arrowheads indicate initiation site of LAMP1 tubules, while arrows indicate the leading edge of tubules. Scale bar, 10 μm.
Figure 3
mTORC1 phosphorylates the UVRAG–VPS34 lipid kinase complex
- HeLa, U2OS and MEFs were treated in complete medium (control), 1 μM KU0063794 (KU) or EBSS for 1 h (MEFs) or 2 h (HeLa, U2OS) prior to lysis and immunoblot.
- Cell lysate from MEFs grown in complete medium was treated in the presence or absence of lambda phosphatase with or without phosphatase inhibitors for 30 min at 30°C.
- RICTOR +/+ and −/− MEFs were grown in complete medium (control), 1 μM KU or EBSS for 1 h prior to lysis.
- Endogenous RAPTOR (RPTOR) or IgG control was immunoprecipitated from HEK293 cells and utilised for an in vitro kinase assay (Materials and Methods) with substrates GST-p70S6K D236A, GST-UVRAG, GST-ATG14L or FLAG-BECLIN1 in the presence or absence of KU.
- Quantitation of relative phosphorylation of GST-p70S6K and GST-UVRAG in the presence or absence of KU from (D). Data represents mean ± SEM for n = 3 independent experiments. Significance was determined by Student’s _t_-test, ***P < 0.001.
Source data are available online for this figure.
Figure 4
mTOR phosphorylates UVRAG at serine 550 and serine 571
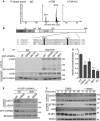
- Extracted ion chromatogram of peptide K543–K559 (S550) and K564–R595 (S571) following in vitro kinase assay of GST-UVRAG with IgG control or endogenous mTOR in the presence or absence of 1 μM KU0063794 (KU).
- Domain structure of UVRAG containing an N-terminal proline-rich region (PRR), C2 domain and a coiled-coil domain (CCD). Sequence alignment of human UVRAG 540–582 indicates S550 and S571 (highlighted) which are conserved between species within the C-terminal domain.
- In vitro kinase assay of endogenous mTORC1 by RAPTOR immunoprecipitation from HEK293 cells with GST-UVRAG wild-type (WT), S550A, S571A or S550A+S571A double (dblA) mutants.
- Quantitation of (C), bars represent mean 32P incorporation ± SEM of n =4 independent experiments. Statistical analysis was carried out by one-way ANOVA and Dunnett’s multiple comparison test to the WT control, *P < 0.05 and ***P < 0.001.
- U2OS cells stably expressing WT or dblA GFP-UVRAG were incubated in complete medium (ctrl) or EBSS for 2 h prior to immunoprecipitation with anti-GFP sepharose and immunoblotting with phospho-specific antibodies.
- Wild-type MEFS were washed twice and incubated in EBSS for 1 h prior to refeed with complete medium for 45 min and lysed at time points indicated.
Source data are available online for this figure.
Figure 5
UVRAG phosphorylation enhances VPS34 lipid kinase activity
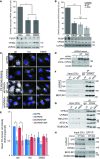
- A U2OS cells were incubated in complete medium (ctrl), 1 μM KU0063794 (KU) or EBSS for 2 h. Endogenous UVRAG was immunoprecipitated and associated VPS34 kinase activity determined by in vitro kinase assay (see Material and Methods). Graph represents mean VPS34 activity (following normalisation to VPS34 protein level) ± SEM for n = 3 independent experiments; significance was determined by one-way ANOVA and Dunnett’s multiple comparison test to the control, *P < 0.05.
- B U2OS cells stably expressing wild-type (WT) or S550A+S571A (dblA) FLAG-UVRAG were incubated in complete medium (ctrl) or EBSS for 2 h prior to IP with FLAG agarose and in vitro kinase assay of associated VPS34 activity. Graph represents mean VPS34 activity ± SEM for n = 4 independent experiments; significance was determined by two-way ANOVA and Bonferroni post-tests, ***P < 0.001.
- C Control MEFs or those stably expressing WT or dblA GFP-UVRAG were transfected with 100 nM UVRAG siRNA 40 h prior to treatment. Cells were treated as ctrl, KU or EBSS for 1 h prior to fixation and staining for PI(3)P with PX domain conjugate. Scale bar, 10 μm.
- D Example blot of UVRAG siRNA knockdown and rescue as in (C).
- E Quantitation of (C) where bars represent mean PX domain staining ± SEM for n = 4 independent experiments, significance was determined by two-way ANOVA and Bonferroni post-tests, *P < 0.05.
- F, G IP of endogenous (F) UVRAG or (G) VPS34 from U2OS cells following ctrl, KU or EBSS treatment for 2 h.
- H HeLa cells stably expressing WT or dblA GFP-UVRAG were incubated in complete medium prior to IP with GFP sepharose beads.
Source data are available online for this figure.
Figure 6
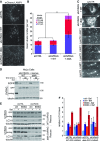
UVRAG phosphorylation alters lysosomal morphology
- U2OS cells or those stably expressing wild-type (WT) or S550A+S571A (dblA) GFP-UVRAG were transfected with 100 nM control or UVRAG siRNA 40 h prior to treatment. Cells were grown in complete medium prior to fixation and staining for LAMP1. Scale bar, 10 μm.
- Western blot of endogenous UVRAG depletion and rescue with GFP-UVRAG as described in (A).
- Quantitation of LAMP1 punctate structures and size from (A), mean ± SEM for n = 3 independent experiments, significance was determined by one-way ANOVA and Dunnett’s multiple comparison test to the siCTRL, ***P < 0.001 and n.s = not significant.
- U2OS cells or those stably expressing wild-type (WT) or S550A+S571A (dblA) GFP-UVRAG were transfected with 100 nM control or UVRAG siRNA 40 h prior to treatment. Cells were grown in complete medium prior to fixation and staining for LAMP1 and PX domain. Scale bar, 10 μm. Arrowheads indicate co-localising punctate structures.
- Quantitation of LAMP1 co-localisation with PX domain as in (D) ± SEM from n =3 independent experiments. Significance was determined by one-way ANOVA and Dunnett’s multiple comparison test to the siCTRL, **P < 0.01.
Source data are available online for this figure.
Figure 7
UVRAG phosphorylation regulates lysosomal tubulation
- U2OS cells stably expressing LAMP1-mCherry and wild-type (WT) or S550A+S571A (dblA) GFP-UVRAG were transfected with 100 nM control or UVRAG siRNA ∼40 h prior to live cell imaging in complete medium. Representative image are shown from Supplementary Movie S2A–C. Scale bar, 10 μm.
- Quantitation from (A) of mean tubules per cell and tubule length as indicated ± SEM for n = 3 independent experiments, significance was determined by one-way ANOVA and Dunnett’s multiple comparison test to the siCTRL, **P < 0.01.
- U2OS cells stably expressing LAMP1-mCherry and WT or dblA GFP-UVRAG were transfected with 100 nM UVRAG siRNA 40 h prior to live cell imaging in complete medium and treatment with 50 nM lysotracker-648 (LysoTR). Magnified images of tubules from dblA-expressing cells are shown below. Scale bar, 5 μm.
- HeLa cells or those stably expressing WT or dblA GFP-UVRAG were transfected with 100 nM control or UVRAG siRNA ∼40 h prior to treatment. Cells were serum-starved for 2 h before the addition of complete medium and 50 ng/ml EGF before lysis at 0 or 30 min in the presence or absence of 1 μM KU0063794 (KU).
- MEFs stably expressing WT or dblA GFP-UVRAG were transfected with 100 nM control or UVRAG siRNA ∼40 h prior to treatment. Cells were incubated in complete medium (ctrl) or EBSS for 1 h in the presence or absence of 50 nM bafilomycin A1 (Baf).
- Quantitation of normalised LC3-II from (E), mean ± SEM for n = 3 independent experiments.
Source data are available online for this figure.
Figure 8
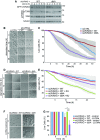
Loss of UVRAG phosphorylation impairs survival under conditions of ALR U2OS cells stably expressing wild-type (WT) or S550A+S571A (dblA) GFP-UVRAG were transfected with 100 nM UVRAG siRNA 40 h prior to treatment.
- Cells were serum-starved in DMEM without glutamine for up to 10 h and lysed at time points indicated.
- Cells were grown in glutamine-free DMEM and monitored by bright-field microscopy with images captured every 10 min up to 42 h. Scale bar, 10 μm.
- Quantitation of (B) represents mean % live cells relative to time ± SEM for n = 3 independent experiments.
- Cells were grown in serum and glutamine-free DMEM for 12 h prior to the addition of DMSO or 1 μM KU and monitored by bright-field microscopy. Scale bar, 10 μm.
- Quantitation of (D) represents mean % live cells relative to time ± SEM for n =3 independent experiments.
- Cells were grown in complete medium in the presence or absence of 1 mM LLOMe and monitored by bright-field microscopy. Scale bar, 10 μm.
- Quantitation of (F) represents mean % live cells relative to time ± SEM for n =3 independent experiments. Significance was determined by two-way ANOVA and Bonferroni post-test, *P < 0.05 and ***P < 0.001.
Source data are available online for this figure.
Figure 9
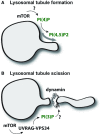
Model of PI(3)P-mediated lysosomal regulation
- Autophagic lysosomal regulation (ALR) and tubulation is driven by the conversion of PI(4)P to PI(4,5)P2 but is fundamentally dependent upon mTOR activity for initiation via unknown mechanisms.
- mTOR acts at a secondary step via phosphorylation of UVRAG to increase formation of lysosomal PI(3)P that appears to be critical for tubule scission, a process regulated by the GTPase dynamin.
Comment in
- Scissors for autolysosome tubules.
Chen Y, Yu L. Chen Y, et al. EMBO J. 2015 Sep 2;34(17):2217-8. doi: 10.15252/embj.201592519. Epub 2015 Jul 28. EMBO J. 2015. PMID: 26224596 Free PMC article.
Similar articles
- MTOR, PIK3C3, and autophagy: Signaling the beginning from the end.
Munson MJ, Ganley IG. Munson MJ, et al. Autophagy. 2015;11(12):2375-6. doi: 10.1080/15548627.2015.1106668. Autophagy. 2015. PMID: 26565689 Free PMC article. Review. - Beclin 1 is required for neuron viability and regulates endosome pathways via the UVRAG-VPS34 complex.
McKnight NC, Zhong Y, Wold MS, Gong S, Phillips GR, Dou Z, Zhao Y, Heintz N, Zong WX, Yue Z. McKnight NC, et al. PLoS Genet. 2014 Oct 2;10(10):e1004626. doi: 10.1371/journal.pgen.1004626. eCollection 2014 Oct. PLoS Genet. 2014. PMID: 25275521 Free PMC article. - NRBF2 regulates macroautophagy as a component of Vps34 Complex I.
Cao Y, Wang Y, Abi Saab WF, Yang F, Pessin JE, Backer JM. Cao Y, et al. Biochem J. 2014 Jul 15;461(2):315-22. doi: 10.1042/BJ20140515. Biochem J. 2014. PMID: 24785657 Free PMC article. - Insulin activation of vacuolar protein sorting 34 mediates localized phosphatidylinositol 3-phosphate production at lamellipodia and activation of mTOR/S6K1.
Hirsch DS, Shen Y, Dokmanovic M, Yu J, Mohan N, Elzarrad MK, Wu WJ. Hirsch DS, et al. Cell Signal. 2014 Jun;26(6):1258-68. doi: 10.1016/j.cellsig.2014.02.009. Epub 2014 Feb 27. Cell Signal. 2014. PMID: 24582588 - Vps34 and PLD1 take center stage in nutrient signaling: their dual roles in regulating autophagy.
Yoon MS. Yoon MS. Cell Commun Signal. 2015 Nov 21;13:44. doi: 10.1186/s12964-015-0122-x. Cell Commun Signal. 2015. PMID: 26589724 Free PMC article. Review.
Cited by
- Impaired Autophagic Clearance with a Gain-of-Function Variant of the Lysosomal Cl-/H+ Exchanger ClC-7.
Bose S, de Heus C, Kennedy ME, Wang F, Jentsch TJ, Klumperman J, Stauber T. Bose S, et al. Biomolecules. 2023 Dec 15;13(12):1799. doi: 10.3390/biom13121799. Biomolecules. 2023. PMID: 38136669 Free PMC article. - Autophagic lysosome reformation in health and disease.
Nanayakkara R, Gurung R, Rodgers SJ, Eramo MJ, Ramm G, Mitchell CA, McGrath MJ. Nanayakkara R, et al. Autophagy. 2023 May;19(5):1378-1395. doi: 10.1080/15548627.2022.2128019. Epub 2022 Nov 21. Autophagy. 2023. PMID: 36409033 Free PMC article. Review. - Antidepressants act by inducing autophagy controlled by sphingomyelin-ceramide.
Gulbins A, Schumacher F, Becker KA, Wilker B, Soddemann M, Boldrin F, Müller CP, Edwards MJ, Goodman M, Caldwell CC, Kleuser B, Kornhuber J, Szabo I, Gulbins E. Gulbins A, et al. Mol Psychiatry. 2018 Dec;23(12):2324-2346. doi: 10.1038/s41380-018-0090-9. Epub 2018 Jul 23. Mol Psychiatry. 2018. PMID: 30038230 Free PMC article. - Branching Off: New Insight Into Lysosomes as Tubular Organelles.
Bohnert KA, Johnson AE. Bohnert KA, et al. Front Cell Dev Biol. 2022 May 11;10:863922. doi: 10.3389/fcell.2022.863922. eCollection 2022. Front Cell Dev Biol. 2022. PMID: 35646899 Free PMC article. Review. - Development of Research into Autophagic Lysosome Reformation.
Chen Y, Yu L. Chen Y, et al. Mol Cells. 2018 Jan 31;41(1):45-49. doi: 10.14348/molcells.2018.2265. Epub 2018 Jan 23. Mol Cells. 2018. PMID: 29370688 Free PMC article. Review.
References
- Appelqvist H, Wäster P, Kågedal K, Öllinger K. The lysosome: from waste bag to potential therapeutic target. J Mol Cell Biol. 2013;5:214–226. - PubMed
- Backer JM. The regulation and function of Class III PI3Ks: novel roles for Vps34. Biochem J. 2008;410:1–17. - PubMed
- Bago R, Malik N, Munson M, Prescott A, Davies P, Sommer E, Shpiro N, Ward R, Cross D, Ganley IG, Alessi D. Characterisation of VPS34-IN1, a selective inhibitor of Vps34 reveals that the phosphatidylinositol 3-phosphate binding SGK3 protein kinase is a downstream target of class III phosphoinositide 3-kinase. Biochem J. 2014;463:413–427. - PMC - PubMed
- Byfield MP, Murray JT, Backer JM. hVps34 is a nutrient-regulated lipid kinase required for activation of p70 S6 kinase. J Biol Chem. 2005;280:33076–33082. - PubMed
Publication types
MeSH terms
Substances
Grants and funding
- MR/K015869/1/MRC_/Medical Research Council/United Kingdom
- 097945/B/11/Z/WT_/Wellcome Trust/United Kingdom
- MC_UP_A500_1019/MRC_/Medical Research Council/United Kingdom
- WT_/Wellcome Trust/United Kingdom
- MC_UU_12016/4/MRC_/Medical Research Council/United Kingdom
- 097945/WT_/Wellcome Trust/United Kingdom
LinkOut - more resources
Full Text Sources
Other Literature Sources
Molecular Biology Databases
Miscellaneous
