Consumption of sugar sweetened beverages, artificially sweetened beverages, and fruit juice and incidence of type 2 diabetes: systematic review, meta-analysis, and estimation of population attributable fraction - PubMed (original) (raw)
Review
Consumption of sugar sweetened beverages, artificially sweetened beverages, and fruit juice and incidence of type 2 diabetes: systematic review, meta-analysis, and estimation of population attributable fraction
Fumiaki Imamura et al. BMJ. 2015.
Abstract
Objectives: To examine the prospective associations between consumption of sugar sweetened beverages, artificially sweetened beverages, and fruit juice with type 2 diabetes before and after adjustment for adiposity, and to estimate the population attributable fraction for type 2 diabetes from consumption of sugar sweetened beverages in the United States and United Kingdom.
Design: Systematic review and meta-analysis.
Data sources and eligibility: PubMed, Embase, Ovid, and Web of Knowledge for prospective studies of adults without diabetes, published until February 2014. The population attributable fraction was estimated in national surveys in the USA, 2009-10 (n = 4729 representing 189.1 million adults without diabetes) and the UK, 2008-12 (n = 1932 representing 44.7 million).
Synthesis methods: Random effects meta-analysis and survey analysis for population attributable fraction associated with consumption of sugar sweetened beverages.
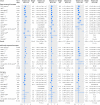
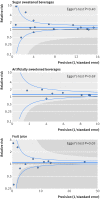
Results: Prespecified information was extracted from 17 cohorts (38,253 cases/10,126,754 person years). Higher consumption of sugar sweetened beverages was associated with a greater incidence of type 2 diabetes, by 18% per one serving/day (95% confidence interval 9% to 28%, I(2) for heterogeneity = 89%) and 13% (6% to 21%, I(2) = 79%) before and after adjustment for adiposity; for artificially sweetened beverages, 25% (18% to 33%, I(2) = 70%) and 8% (2% to 15%, I(2) = 64%); and for fruit juice, 5% (-1% to 11%, I(2) = 58%) and 7% (1% to 14%, I(2) = 51%). Potential sources of heterogeneity or bias were not evident for sugar sweetened beverages. For artificially sweetened beverages, publication bias and residual confounding were indicated. For fruit juice the finding was non-significant in studies ascertaining type 2 diabetes objectively (P for heterogeneity = 0.008). Under specified assumptions for population attributable fraction, of 20.9 million events of type 2 diabetes predicted to occur over 10 years in the USA (absolute event rate 11.0%), 1.8 million would be attributable to consumption of sugar sweetened beverages (population attributable fraction 8.7%, 95% confidence interval 3.9% to 12.9%); and of 2.6 million events in the UK (absolute event rate 5.8%), 79,000 would be attributable to consumption of sugar sweetened beverages (population attributable fraction 3.6%, 1.7% to 5.6%).
Conclusions: Habitual consumption of sugar sweetened beverages was associated with a greater incidence of type 2 diabetes, independently of adiposity. Although artificially sweetened beverages and fruit juice also showed positive associations with incidence of type 2 diabetes, the findings were likely to involve bias. None the less, both artificially sweetened beverages and fruit juice were unlikely to be healthy alternatives to sugar sweetened beverages for the prevention of type 2 diabetes. Under assumption of causality, consumption of sugar sweetened beverages over years may be related to a substantial number of cases of new onset diabetes.
© Imamura et al 2015.
Conflict of interest statement
Competing interests: All authors have completed the ICMJE uniform disclosure form at www.icmje.org/coi\_disclosure.pdf and declare: no support from any organisation for the submitted work; no financial relationships with any organisations that might have an interest in the submitted work in the previous three years; no other relationships or activities that could appear to have influenced the submitted work.
Figures
Fig 1 Prospective associations of beverage consumption with incident type 2 diabetes: random effects meta-analysis. *Unadjusted for adiposity. †Adjusted for adiposity. ‡Adjusted for adiposity and within person variation. Cohorts were ordered by weights in the most adjusted model. Estimates with 95% confidence intervals greater than 10 are not presented. Supplementary table S4 summarises the covariates adjusted for in each study
Fig 2 Funnel plot for associations of sugar sweetened beverages, artificially sweetened beverages, and fruit juice with incident type 2 diabetes. Dots represent point estimates plotted over precision measures (1/standard error). Estimates outside each panel are not presented. Horizontal lines represent summary estimates and 95% confidence intervals across precision. Shaded areas represent any of a single estimate that, if included, would make the summary estimate insignificant (P>0.05). P values by Egger’s test are presented: for fruit juice, estimates with greater precision indicated stronger positive association
Fig 3 Consumption of sugar sweetened beverages and population attributable fraction (PAF) for type 2 diabetes in the United States and the United Kingdom. Circles represent mean of consumption of sugar sweetened beverages (left axis) and each bar represents PAF (%) for type 2 diabetes due to consumption of sugar sweetened beverages (right axis). Absolute event rates over 10 years were 11.0% in the USA (20.9 million events) and 5.8% in the UK (2.6 million events) (see supplementary table 7)
Comment in
- Compelling evidence linking sugary drinks with diabetes.
Gregg EW, Albright A. Gregg EW, et al. BMJ. 2015 Jul 29;351:h4087. doi: 10.1136/bmj.h4087. BMJ. 2015. PMID: 26224343 No abstract available.
Similar articles
- Consumption of sugar sweetened beverages, artificially sweetened beverages, and fruit juice and incidence of type 2 diabetes: systematic review, meta-analysis, and estimation of population attributable fraction.
Imamura F, O'Connor L, Ye Z, Mursu J, Hayashino Y, Bhupathiraju SN, Forouhi NG. Imamura F, et al. Br J Sports Med. 2016 Apr;50(8):496-504. doi: 10.1136/bjsports-2016-h3576rep. Br J Sports Med. 2016. PMID: 27044603 Free PMC article. - Prospective associations and population impact of sweet beverage intake and type 2 diabetes, and effects of substitutions with alternative beverages.
O'Connor L, Imamura F, Lentjes MA, Khaw KT, Wareham NJ, Forouhi NG. O'Connor L, et al. Diabetologia. 2015 Jul;58(7):1474-83. doi: 10.1007/s00125-015-3572-1. Epub 2015 May 6. Diabetologia. 2015. PMID: 25944371 Free PMC article. - Sugar-sweetened and artificially sweetened beverage consumption and risk of type 2 diabetes in men.
de Koning L, Malik VS, Rimm EB, Willett WC, Hu FB. de Koning L, et al. Am J Clin Nutr. 2011 Jun;93(6):1321-7. doi: 10.3945/ajcn.110.007922. Epub 2011 Mar 23. Am J Clin Nutr. 2011. PMID: 21430119 Free PMC article. - Intake of fruit juice and incidence of type 2 diabetes: a systematic review and meta-analysis.
Xi B, Li S, Liu Z, Tian H, Yin X, Huai P, Tang W, Zhou D, Steffen LM. Xi B, et al. PLoS One. 2014 Mar 28;9(3):e93471. doi: 10.1371/journal.pone.0093471. eCollection 2014. PLoS One. 2014. PMID: 24682091 Free PMC article.
Cited by
- A call for implementation of the Law 2120 against junk food during pandemic times in Colombia.
García LM, Contreras A. García LM, et al. Biomedica. 2022 Oct 31;42(Sp. 2):14-18. doi: 10.7705/biomedica.6303. Biomedica. 2022. PMID: 36322550 Free PMC article. English, Spanish. - Health and economic burden of sugar-sweetened beverages consumption in Brazil.
Perelli L, Alcaraz A, Vianna CMM, Espinola N, Cairoli FR, Bardach A, Palacios A, Balan D, Johns P, Augustovski F, Pichón-Rivière A. Perelli L, et al. Cad Saude Publica. 2023 Dec 22;39(12):e00249422. doi: 10.1590/0102-311XEN249422. eCollection 2023. Cad Saude Publica. 2023. PMID: 38126558 Free PMC article. - Sugar-Sweetened Beverage Health Warnings and Purchases: A Randomized Controlled Trial.
Grummon AH, Taillie LS, Golden SD, Hall MG, Ranney LM, Brewer NT. Grummon AH, et al. Am J Prev Med. 2019 Nov;57(5):601-610. doi: 10.1016/j.amepre.2019.06.019. Epub 2019 Oct 2. Am J Prev Med. 2019. PMID: 31586510 Free PMC article. Clinical Trial. - Food sources of fructose-containing sugars and glycaemic control: systematic review and meta-analysis of controlled intervention studies.
Choo VL, Viguiliouk E, Blanco Mejia S, Cozma AI, Khan TA, Ha V, Wolever TMS, Leiter LA, Vuksan V, Kendall CWC, de Souza RJ, Jenkins DJA, Sievenpiper JL. Choo VL, et al. BMJ. 2018 Nov 21;363:k4644. doi: 10.1136/bmj.k4644. BMJ. 2018. PMID: 30463844 Free PMC article. - Perspective: The Role of Beverages as a Source of Nutrients and Phytonutrients.
Ferruzzi MG, Tanprasertsuk J, Kris-Etherton P, Weaver CM, Johnson EJ. Ferruzzi MG, et al. Adv Nutr. 2020 May 1;11(3):507-523. doi: 10.1093/advances/nmz115. Adv Nutr. 2020. PMID: 31755901 Free PMC article.
References
- Stanhope KL. Role of fructose-containing sugars in the epidemics of obesity and metabolic syndrome. Annu Rev Med 2012;63:329-43. - PubMed
- Greenwood DC, Threapleton DE, Evans CEL, et al. Association between sugar-sweetened and artificially sweetened soft drinks and type 2 diabetes: systematic review and dose-response meta-analysis of prospective studies. Br J Nutr 2014;112:725-34. - PubMed
Publication types
MeSH terms
Substances
LinkOut - more resources
Full Text Sources
Other Literature Sources
Medical


