Anti-leukemic effects of the V-ATPase inhibitor Archazolid A - PubMed (original) (raw)
Anti-leukemic effects of the V-ATPase inhibitor Archazolid A
Siwei Zhang et al. Oncotarget. 2015.
Abstract
Prognosis for patients suffering from T-ALL is still very poor and new strategies for T-ALL treatment are urgently needed. Our study shows potent anti-leukemic effects of the myxobacterial V-ATPase inhibitor Archazolid A. Archazolid A reduced growth and potently induced death of leukemic cell lines and human leukemic samples. By inhibiting lysosomal acidification, Archazolid A blocked activation of the Notch pathway, however, this was not the mechanism of V-ATPase inhibition relevant for cell death induction. In fact, V-ATPase inhibition by Archazolid A decreased the anti-apoptotic protein survivin. As underlying mode of action, this work is in line with recent studies from our group demonstrating that Archazolid A induced S-phase cell cycle arrest by interfering with the iron metabolism in leukemic cells. Our study provides evidence for V-ATPase inhibition as a potential new therapeutic option for T-ALL.
Keywords: Archazolid; leukemia; natural compounds.
Conflict of interest statement
CONFLICTS OF INTEREST
The authors declare no conflict of interest.
Figures
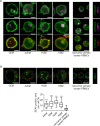
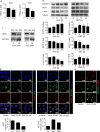
Figure 1. V-ATPase in leukemic cell lines
A. V-ATPase localization in leukemic cell lines is shown. Immunostaining of non-tumor primary human peripheral blood mononuclear cells (PBMCs) and leukemic cell lines (Jurkat, CEM, HL60, K562) for V-ATPase c-subunit (ATP6V0C, green) together with EEA1 (magenta), LAMP1 (magenta) and actin (red) is shown. Scale bar 5 μm. B. The size of the endo-lysosomal compartment in leukemic cell lines is shown. Staining of non-tumor primary human PBMCs and leukemic cell lines (Jurkat, CEM, HL60, K562) for EEA1 (green) is shown. Scale bar 5 μm. The white line labels the cell border. The red lines label the endosome area (EEA1-positive area). Endosome area per cell was calculated and is shown in the graph. One-Way ANOVA, Tukey's post test, ***p ≤ 0.001 (compared to non-tumor primary PBMCs).
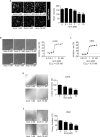
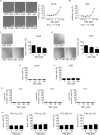
Figure 2. Archazolid A inhibits growth of leukemic cell lines
A. Archazolid A inhibits lysosome acidification. Stainings of Jurkat cells treated with Archazolid A (Arch, 0, 0.1, 0.5, 1, 5, 10 nM, 24h) with the pH-sensitive LysoTracker are shown. n = 3. Scale bar 20 μm. Quantification of LysoTracker staining is displayed (***p ≤ 0.001, One-Way ANOVA, Tukey, n = 3). B., C. Archazolid A inhibits the proliferation of leukemic cells. Inhibition rates of proliferation of Jurkat B. and CEM cells C. after treatments with Archazolid A (Arch) at indicated concentrations for 72h are shown. EC50 is indicated. n = 3. Scale bar 50 μm. D., E. Archazolid A inhibits clonogenic growth. Colony formation of Jurkat D. and CEM cells E. after treatments with Archazolid A (Arch) at indicated concentrations is shown. Scale bar 100 μm. One-Way ANOVA, Tukey's post test, *p ≤ 0.05, **p ≤ 0.01, ***p ≤ 0.001, n = 3.
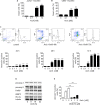
Figure 3. Archazolid A induces death of leukemic cell lines
A., B. Apoptosis rate determined by Nicoletti assay of Jurkat A. and CEM cells B. after treatments with Archazolid A (Arch) at indicated concentrations for 72h is shown. One-Way ANOVA, Tukey's post test, ***p ≤ 0.001, n = 3. C. Pictures display Annexin V staining of Jurkat cells after treatments with Archazolid A (Arch). Bar graphs show the apoptosis rate determined by Annexin V staining of Jurkat cells after treatments with Archazolid A (Arch) at indicated concentrations for 24h, 48h, and 72h. One-Way ANOVA, Tukey's post test, ***p ≤ 0.001, n = 3. D. Immunoblots of Jurkat cells treated with Archazolid A (10 nM) for the indicated times for procaspase-3 (procasp-3), procaspase-9 (procasp-9), PARP, BNIP3, and Bcl-XL are shown. The immunoblot for tubulin indicates equal loading. n = 3. E. Annexin V/PI staining of cells treated with Archazolid A at indicated concentrations for 48h and with/without the pan-caspase inhibitor QVD-OPh (QVD) at 10 μM for 48h is shown. One-Way ANOVA, Tukey's post test, ***p ≤ 0.001, n = 3.
Figure 4. Archazolid A induces cell death in human patient derived xenograft (PDX) samples
A. Viability of leukemic PDX samples with/without treatment with Archazolid A (Arch) for 72h at indicated concentrations is shown. B. PI exclusion staining of leukemic PDX samples with/without treatment with Archazolid A (Arch) for 48h at indicated concentrations is shown. Upper panels display dot plots and histograms of PDX leukemic cells from one respective patient (PDX ALL-169). Dead cells are stained by PI and are marked in red. Live cells without PI staining are displayed in green. Lower panels show apoptosis rate of PDX leukemic cells treated with Archazolid A (Arch) at indicated concentrations. C. The specific apoptosis rate determined by Annexin V/PI staining of PDX cells after treatments with Archazolid A (Arch) at indicated concentrations for 48h is shown. D. Immunoblots of PDX samples treated with Archazolid A (10 nM, 48h) for procaspase-3 (procasp-3) are shown. Ponceau staining indicates equal loading. E. Archazolid A does not induce cell death in non-tumor primary human PBMCs. Apoptosis rate determined by Annexin V/PI staining and of non-tumor primary human PBMCs (FACS analysis with gating for lymphocytes) of two different donors treated with Archazolid A (Arch) at indicated concentrations for 48h is shown.
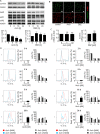
Figure 5. Archazolid A inhibits Notch1 signaling
A. Hes1 mRNA expression of Jurkat cells treated with Archazolid A (Arch, 10 nM, 24h) or DBZ (50 μM, 24h) is shown. Archazolid A: paired _t_-test, *p = 0.0341, n = 3. DBZ: paired _t_-test, *p = 0.0090, n = 3. B. Immunoblots from Jurkat cells treated with Archazolid A (Arch, 10 nM, left panel) or DBZ (10 μM, right panel) for the indicated times and probed with antibodies for Notch, NICD, and c-myc are shown. Immunoblots for β-tubulin indicate equal loading. Bar graphs display quantitative evaluations of immunoblots for Notch1, NICD, and c-myc. n = 3. C. Immunoblots from PDX cells treated with Archazolid A (10 nM, 24h) and probed with antibodies for NICD are shown. Ponceau staining is used as loading control. D. Immunostainings from Jurkat cells treated with Archazolid A (Arch, 10 nM, 24h) or DBZ (50 μM, 24h) for NICD (green, left panels) and Notch1 (green, right panels) are shown. n = 3. Scale bar 10 μm. Bar graphs display quantitative evaluations of NICD and Notch1 intensities. E. Immunostainings from Jurkat cells treated with Archazolid A (Arch, 10 nM, 24h) for LAMP1 (red) and Notch1 (green) are shown. Merged pictures indicate colocalization of LAMP1 and Notch1 (yellow). n = 3. Scale bar 10 μm.
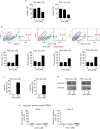
Figure 6. NICD cannot rescue Archazolid A mediated induction of apoptosis
A. Apoptosis rate determined by Nicoletti assay (left bar graph) and by Annexin V/PI staining (right bar graph) of Jurkat cells overexpressing either empty vector or NICD after treatment with Archazolid A (48h) is shown. Immunoblots show NICD overexpression. n = 3. B. Increased expression of Notch downstream targets Hey1 (paired _t_-test, *p = 0.0197), Hey2 (paired _t_-test, p = 0.0576), NRARP (paired _t_-test, *p = 0.0407), Hes1 (paired _t_-test, p = 0.1117) after NICD overexpression (24h) is shown. n = 3. C. Proliferation of Jurkat cells overexpressing either empty vector or NICD after treatment with DBZ at indicated concentrations for 72h is shown. _t_-test, *p = 0.0209, n = 3. D. Expression of V-ATPase subunit c (ATP6V0C) of Jurkat cells treated with DBZ (50 μM, 24h) is shown. Non-significant (ns), paired _t_-test, p = 0.1886.
Figure 7. y-secretase inhibition by DBZ inhibits growth but does not induce leukemic cell death
A., B. DBZ inhibits proliferation of leukemic cells. Inhibition rates of proliferation of Jurkat A. and CEM cells B. after treatment with DBZ for 72h at indicated concentrations are shown. EC50 is indicated. n = 3. Scale bar 50 μm. C., D. Colony formation of Jurkat C. and CEM cells D. after treatments with DBZ at indicated concentrations is shown. Scale bar 100 μm. One-Way ANOVA, Tukey, **p ≤ 0.01, ***p ≤ 0.001, n = 3. E., F. Apoptosis rate determined by Nicoletti assay of Jurkat E. and CEM cells F. after treatments with DBZ at indicated concentrations for 72h is shown. n = 3. G. Apoptosis rate determined by Annexin V/PI staining of Jurkat cells after treatments with DBZ at indicated concentrations for 24h, 48h, and 72h is shown. 24h and 48h: n = 2. 72h: n = 3. H. Apoptosis rate determined by PI exclusion of PDX leukemic cells with/without treatments with DBZ (48h) at indicated concentrations is shown.
Figure 8. Archazolid A decreases the anti-apoptotic protein survivin and interferes with the cell cycle in leukemic cells
A. Archazolid A decreases the anti-apoptotic protein survivin. Immunoblots from Jurkat cells treated with Archazolid A (Arch, 10 nM, left panel) or DBZ (50 μM, right panel) for the indicated times and probed with antibodies for survivin, XIAP, IAP1, and IAP2 are shown. Immunoblots for tubulin indicate equal loading. n = 3. Bar graphs display the quantitative evaluation of survivin expression. B. Immunostainings for survivin (green) and actin (red) after treatment with/without Archazolid A (Arch, 10 nM, 24h) and DBZ (50 μM, 24h) is shown. Scale bar 10 μm. C. Archazolid A (Arch) and DBZ do not interfere with survivin mRNA expression. Survivin mRNA levels from Jurkat cells treated with Archazolid A (1 and 10 nM) and DBZ (50 μM) for 24h are shown. Not significant (ns), Archazolid A: One-Way ANOVA, DBZ: paired _t_-test, n = 3. D. Archazolid A (Arch) induces S-phase cell cycle arrest of Jurkat cells. Cell cyle analysis and apoptosis measurement after aphidicolin synchronization (24h) and subsequent treatment with Archazolid A for indicated times is shown. Control cells (untreated, Archazolid A 0 nM) are indicated in red, Archazolid A (Arch, 10 nM) treated cells are indicated in blue. One representative out of three independent experiments is shown.
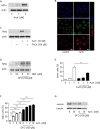
Figure 9. Archazolid A interferes with the iron metabolism in leukemic cells
A. Archazolid A increases Hif1α. Immunoblots show Hif1α levels of Jurkat cells with/without Archazolid A (Arch) treatment at indicated concentrations for 24h. Actin indicates equal loading. B. Immunostainings for Hif1α (green) and f-actin (red) after treatment with/without Archazolid A (Arch, 10 nM, 24h) is shown. Nuclei are labeled with Hoechst33342 (blue). Scale bar 7.5 μm. C. Archazolid A mediated Hif1α increase is abrogated by iron citrate. Immunoblots show Hif1α levels of Jurkat cells with/without Archazolid A (Arch) and iron citrate (FeCit) treatment at indicated concentrations for 24h. Actin indicates equal loading. n = 3. D. Inhibition of Notch by DBZ does not influence Hif1α. Immunoblots of Jurkat cells treated with DBZ and deferoxamine (DFO) at indicated concentrations for 24h for Hif1α and actin (loading control) are shown. E. Archazolid A mediated cell death is partially rescued by iron citrate. The graph shows cell death of Jurkat cells treated with/without Archazolid A (Arch) and iron citrate (FeCit) at indicated concentrations for 48 h. Mann Whitney test, **p = 0.0022, n = 3. F. DFO induces cell death in Jurkat cells and is enhanced by Archazolid A. Nicoletti assay of cells treated with/without Archazolid A (Arch) and DFO at indicated concentrations for 48 h is shown. One-Way ANOVA, Tukey's post test, ***p ≤ 0.001, n = 3. G. Survivin is decreased by DFO which is enhanced by Archazolid A. Immunoblots for survivin and tubulin (loading control) from cells treated with/without DFO (100 μM) and Archazolid A (Arch, 10 nM) for 48h are shown; n = 3.
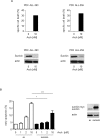
Figure 10. Archazolid A-induced apoptosis in PDX is in line with decreased levels of the anti-apoptotic protein survivin
A. Upper panels show apoptosis rates (specific cell death) determined by PI exclusion staining of PDX leukemia samples treated with Archazolid A (Arch, 10 nM, 48 h). Lower panels display immunoblots from PDX cells from the same patients treated with Archazolid A (Arch, 10 nM, 24 h) and probed with antibodies for survivin. Immunoblots for actin indicate equal loading. B. Archazolid A mediated cell death is partially rescued by survivin overexpression. The graph shows early apoptosis (AnnexinV-positive and PI-negative cells) determined by AnnexinV/PI staining of Jurkat cells overexpressing either empty vector (ev) or survivin and treated with/without Archazolid A (Arch) at indicated concentrations for 48 h. One-Way ANOVA, Tukey, *p ≤ 0.05, ***p ≤ 0.001, n = 3. Immunoblots show overexpression of empty vector (ev) and survivin 24h after transfection; actin indicates equal loading.
Similar articles
- V-ATPase inhibition by archazolid leads to lysosomal dysfunction resulting in impaired cathepsin B activation in vivo.
Kubisch R, Fröhlich T, Arnold GJ, Schreiner L, von Schwarzenberg K, Roidl A, Vollmar AM, Wagner E. Kubisch R, et al. Int J Cancer. 2014 May 15;134(10):2478-88. doi: 10.1002/ijc.28562. Epub 2013 Nov 14. Int J Cancer. 2014. PMID: 24166050 - Vacuolar-ATPase Inhibition Blocks Iron Metabolism to Mediate Therapeutic Effects in Breast Cancer.
Schneider LS, von Schwarzenberg K, Lehr T, Ulrich M, Kubisch-Dohmen R, Liebl J, Trauner D, Menche D, Vollmar AM. Schneider LS, et al. Cancer Res. 2015 Jul 15;75(14):2863-74. doi: 10.1158/0008-5472.CAN-14-2097. Epub 2015 May 27. Cancer Res. 2015. PMID: 26018087 - The vacuolar-type ATPase inhibitor archazolid increases tumor cell adhesion to endothelial cells by accumulating extracellular collagen.
Luong B, Schwenk R, Bräutigam J, Müller R, Menche D, Bischoff I, Fürst R. Luong B, et al. PLoS One. 2018 Sep 11;13(9):e0203053. doi: 10.1371/journal.pone.0203053. eCollection 2018. PLoS One. 2018. PMID: 30204757 Free PMC article. - V-ATPase inhibitors and implication in cancer treatment.
Pérez-Sayáns M, Somoza-Martín JM, Barros-Angueira F, Rey JM, García-García A. Pérez-Sayáns M, et al. Cancer Treat Rev. 2009 Dec;35(8):707-13. doi: 10.1016/j.ctrv.2009.08.003. Epub 2009 Sep 15. Cancer Treat Rev. 2009. PMID: 19758758 Review. - Inhibitors of V-ATPases: old and new players.
Huss M, Wieczorek H. Huss M, et al. J Exp Biol. 2009 Feb;212(Pt 3):341-6. doi: 10.1242/jeb.024067. J Exp Biol. 2009. PMID: 19151208 Review.
Cited by
- Lysosome-mediated chemoresistance in acute myeloid leukemia.
Cuesta-Casanovas L, Delgado-Martínez J, Cornet-Masana JM, Carbó JM, Clément-Demange L, Risueño RM. Cuesta-Casanovas L, et al. Cancer Drug Resist. 2022 Mar 14;5(1):233-244. doi: 10.20517/cdr.2021.122. eCollection 2022. Cancer Drug Resist. 2022. PMID: 35582535 Free PMC article. Review. - Isoform-specific gene disruptions reveal a role for the V-ATPase subunit a4 isoform in the invasiveness of 4T1-12B breast cancer cells.
McGuire CM, Collins MP, Sun-Wada G, Wada Y, Forgac M. McGuire CM, et al. J Biol Chem. 2019 Jul 19;294(29):11248-11258. doi: 10.1074/jbc.RA119.007713. Epub 2019 Jun 5. J Biol Chem. 2019. PMID: 31167791 Free PMC article. - Vacuolar (H+)-ATPase Critically Regulates Specialized Proresolving Mediator Pathways in Human M2-like Monocyte-Derived Macrophages and Has a Crucial Role in Resolution of Inflammation.
Rao Z, Pace S, Jordan PM, Bilancia R, Troisi F, Börner F, Andreas N, Kamradt T, Menche D, Rossi A, Serhan CN, Gerstmeier J, Werz O. Rao Z, et al. J Immunol. 2019 Aug 15;203(4):1031-1043. doi: 10.4049/jimmunol.1900236. Epub 2019 Jul 12. J Immunol. 2019. PMID: 31300512 Free PMC article. - The constitutive protease release by primary human acute myeloid leukemia cells.
Honnemyr M, Bruserud Ø, Brenner AK. Honnemyr M, et al. J Cancer Res Clin Oncol. 2017 Oct;143(10):1985-1998. doi: 10.1007/s00432-017-2458-7. Epub 2017 Jun 19. J Cancer Res Clin Oncol. 2017. PMID: 28631213 - Vacuolar H+-ATPase Subunit V0C Regulates Aerobic Glycolysis of Esophageal Cancer Cells via PKM2 Signaling.
Son SW, Chau GC, Kim ST, Um SH. Son SW, et al. Cells. 2019 Sep 24;8(10):1137. doi: 10.3390/cells8101137. Cells. 2019. PMID: 31554233 Free PMC article.
References
- Koch U, Radtke F. Notch in T-ALL: new players in a complex disease. Trends Immunol. 2011;32:434–442. - PubMed
- Rosati E, Sabatini R, Rampino G, Tabilio A, Di Ianni M, Fettucciari K, Bartoli A, Coaccioli S, Screpanti I, Marconi P. Constitutively activated Notch signaling is involved in survival and apoptosis resistance of B-CLL cells. Blood. 2009;113:856–865. - PubMed
Publication types
MeSH terms
Substances
LinkOut - more resources
Full Text Sources
Other Literature Sources
Research Materials
