Bif-1 deficiency impairs lipid homeostasis and causes obesity accompanied by insulin resistance - PubMed (original) (raw)
Bif-1 deficiency impairs lipid homeostasis and causes obesity accompanied by insulin resistance
Ying Liu et al. Sci Rep. 2016.
Abstract
Bif-1 is a membrane-curvature inducing protein that is implicated in the regulation of autophagy and tumorigenesis. Here, we report that Bif-1 plays a critical role in regulating lipid catabolism to control the size of lipid droplets and prevent the development of obesity and insulin resistance upon aging or dietary challenge. Our data show that Bif-1 deficiency promotes the expansion of adipose tissue mass without altering food intake or physical activities. While Bif-1 is dispensable for adipose tissue development, its deficiency reduces the basal rate of adipose tissue lipolysis and results in adipocyte hypertrophy upon aging. The importance of Bif-1 in lipid turnover is not limited to adipose tissue since fasting and refeeding-induced lipid droplet clearance is also attenuated by Bif-1 loss in the liver. Interestingly, obesity induced by a high fat-diet or Bif-1 deficiency downregulates the expression of proteins involved in the autophagy-lysosomal pathway, including Atg9a and Lamp1 in the adipose tissue. These findings thus identify Bif-1 as a novel regulator of lipid homeostasis to prevent the pathogenesis of obesity and its associated metabolic complications.
Figures
Figure 1. Loss of Bif-1 induces obesity.
(a) Female wild type (WT) and Bif-1 knockout (KO) mice were fed with either control chow diet (CD) or high-fat diet (HFD) for the indicated periods of time. Body weight of each mouse was monitored weekly (n = 9–12). Statistical significance was determined using one-way ANOVA followed by Bonferroni’s multiple comparison test. (b) Representative images of WT and Bif-1 KO mice fed on HFD for 23 weeks. (c–e) Body composition of mice fed with the indicated diet for 23 weeks was measured using TD-NMR. Loss of Bif-1 leads to larger total (c) and percent (d) fat mass and has no effect on lean mass (e). Statistical significance was determined using one-way ANOVA followed by Bonferroni’s multiple comparison. (f) Representative images of fat deposits in WT and Bif-1 KO mice fed on HFD for 23 weeks. (g) Representative images of abdominal gonadal fat pads from WT and Bif-1 KO mice fed on either CD or HFD for 23 weeks. (h,i) Loss of Bif-1 leads to adipocyte enlargement. Hematoxylin and eosin stain of the abdominal gonadal white adipose tissue (WAT) (h) and interscapular brown adipose tissue (i) sections from mice fed with CD or HFD for 23 weeks. Scale bars in (h) and (i) represent 50μm and 200μm, respectively. All values are mean ± SEM. Differences with controls were significant for *p < 0.05, **p < 0.01, and ***p < 0.001.
Figure 2. Obesity induced by Bif-1 loss leads to insulin resistance.
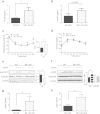
(a,b) Levels of insulin in plasma from mice fed with CD (a) or HFD (b) for 23 weeks were measured using BioRad Luminex assays, n = 9–12. Statistical significance was determined using Student’s _t_-test. (c,d) Insulin tolerance test (c) and oral glucose tolerance test in mice fed with HFD for 23 weeks were performed as described in Methods. n = 9–11. Statistical significance was determined using Student’s _t_-test. (e,f) WT and Bif-1 KO mice fed with CD for 23 weeks were fasted for 16 h and then given 0.75 U/kg of insulin intraperitoneally 15 min prior to sacrifice. Liver (e) and gastric muscle (f) lysates were prepared and subjected to immunoblot analysis using the indicated antibodies. The intensities of phosphorylated-Akt (pAkt S473) or phosphorylated-ERK1/2 (p-ERK) relative to total Akt or total ERK1/2 were normalized against β-actin. Statistical significance was determined using Student’s _t_-test in (e) and One-way ANOVA followed by Bonferroni’s multiple comparison test in (f). (g,h) Levels of leptin in plasma from mice fed with CD (g) or HFD (h) for 23 weeks were measured using BioRad Luminex assays, n = 9–12. Statistical significance was determined using Student’s _t_-test. All values are mean ± SEM. Differences with controls were significant for *p < 0.05.
Figure 3. Effects of Bif-1 on food intake, physical activities, and fuel preference.
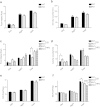
Indirect calorimetry analysis of WT and Bif-1 KO mice fed with CD for 4 weeks (10-week old, n = 4) (a,b,e) or with the indicated diet for 19 weeks (25-week old, n = 8) (c,d,f). Food intake (a,c), physical activities (b,d), and energy expenditure (e,f) were measured during a 48-h cycle using metabolic cages. Statistical significance was determined using one-way ANOVA followed by Bonferroni’s multiple comparison. All values are mean ± SEM. Differences with controls were significant for *p < 0.05 and ****p < 0.0001.
Figure 4. Bif-1 deficiency does not affect adipogenesis.
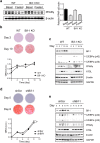
(a) Bif-1 does not impact adipogenesis in vivo. Relative protein expression levels of PPAR-γ in WT and Bif-1 KO WAT homogenates prepared from 6- week-old mice were determined via immunoblotting (n = 3). (b) Immortalized perivascular cells isolated from brown adipose tissue (iPBA) of 6-week-old mice as described in Methods were induced to differentiate with an adipogenic cocktail. Cells were subjected to Oil Red O (ORO) staining on the indicated days following adipogenesis induction. Representative images were acquired, and the optical density of ORO extracted from the cells was quantified by absorption at 520 nm (n = 4). (c) Lysates prepared from iPBA cells on the indicated days during adipogenesis were subjected to immunoblotting with the indicated antibodies. (d) 3T3-L1 cells transduced with lentiviruses encoding Bif-1 shRNA (shBif-1) or scrambled shRNA (shScr) were induced to differentiate as described in Methods Cells on indicated days during adipogenesis were stained with ORO. Representative images were acquired, and the optical density of ORO extracted from the cells was quantified by absorption at 520nm (n = 4). Statistical significance was determined using Student’s _t_-test. All values are mean ± SEM. Differences with controls were significant for **p < 0.01. (e) Lysates prepared from 3T3-L1 shScr and shBif-1 cells on the indicated days during adipogenesis were subjected to immunoblotting with the indicated antibodies.
Figure 5. Bif-1 regulates lipid turnover in adipose tissue and liver.
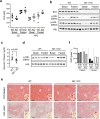
(a) Plasma levels of free fatty acid (FFA) from mice fed with the indicated diet for 23 weeks in resting and 16 h-fasted states were measured (n = 4). (b) Lysates prepared from white adipose tissue collected from the same animals in (a) were subjected to immunoblotting with the indicated antibodies. Same lysates were also used in Fig. 6b. (c) Plasma levels of glycerol from 6-week old mice fed with normal CD were measured using glycerol reagent (Sigma). Statistical significance was determined using Student’s _t_-test. (d) Lysates prepared from white adipose tissue collected from the same animals in (c) were subjected to immunoblotting with the indicated antibodies. Same lysates were also used in Fig. 4a. (e,f) Representative images (e) and quantification (f) of ORO stain of the liver sections from mice fed with CD for 20 weeks, fasted overnight or fasted overnight and then refed for 24 h. Scale bars represent 100 μm.
Figure 6. Bif-1 is important for autophagy in adipose tissue.
(a–c) Immunoblots for the indicated proteins in WAT homogenates prepared from 30-week-old mice. The mice were fed with CD or HFD for 23 weeks (a), fed with CD, at basal or 16 h-fasted states (b), or fasted for 16 h, with or without insulin injection 15 min prior to sacrifice (c). n = 3–4. (d) Immunoblots for the indicated proteins in WAT homogenates from 6-week old mice fed with CD or 11-week old mice fed with 5 weeks HFD. n = 3.
Similar articles
- FGF21-FGFR1 Coordinates Phospholipid Homeostasis, Lipid Droplet Function, and ER Stress in Obesity.
Ye M, Lu W, Wang X, Wang C, Abbruzzese JL, Liang G, Li X, Luo Y. Ye M, et al. Endocrinology. 2016 Dec;157(12):4754-4769. doi: 10.1210/en.2016-1710. Epub 2016 Oct 3. Endocrinology. 2016. PMID: 27690692 - The Bif-1-Dynamin 2 membrane fission machinery regulates Atg9-containing vesicle generation at the Rab11-positive reservoirs.
Takahashi Y, Tsotakos N, Liu Y, Young MM, Serfass J, Tang Z, Abraham T, Wang HG. Takahashi Y, et al. Oncotarget. 2016 Apr 12;7(15):20855-68. doi: 10.18632/oncotarget.8028. Oncotarget. 2016. PMID: 26980706 Free PMC article. - Adipose-specific knockout of SEIPIN/BSCL2 results in progressive lipodystrophy.
Liu L, Jiang Q, Wang X, Zhang Y, Lin RC, Lam SM, Shui G, Zhou L, Li P, Wang Y, Cui X, Gao M, Zhang L, Lv Y, Xu G, Liu G, Zhao D, Yang H. Liu L, et al. Diabetes. 2014 Jul;63(7):2320-31. doi: 10.2337/db13-0729. Epub 2014 Mar 12. Diabetes. 2014. PMID: 24622797 - Lipophagy in nonliver tissues and some related diseases: Pathogenic and therapeutic implications.
Zhou K, Yao P, He J, Zhao H. Zhou K, et al. J Cell Physiol. 2019 Jun;234(6):7938-7947. doi: 10.1002/jcp.27988. Epub 2018 Dec 10. J Cell Physiol. 2019. PMID: 30537019 Review. - Autophagy: a molecular switch to regulate adipogenesis and lipolysis.
Sekar M, Thirumurugan K. Sekar M, et al. Mol Cell Biochem. 2022 Mar;477(3):727-742. doi: 10.1007/s11010-021-04324-w. Epub 2022 Jan 13. Mol Cell Biochem. 2022. PMID: 35022960 Review.
Cited by
- Lipophagy: Molecular Mechanisms and Implications in Metabolic Disorders.
Shin DW. Shin DW. Mol Cells. 2020 Aug 31;43(8):686-693. doi: 10.14348/molcells.2020.0046. Mol Cells. 2020. PMID: 32624503 Free PMC article. Review. - The Emerging Roles of Autophagy in Human Diseases.
Lei Y, Klionsky DJ. Lei Y, et al. Biomedicines. 2021 Nov 9;9(11):1651. doi: 10.3390/biomedicines9111651. Biomedicines. 2021. PMID: 34829881 Free PMC article. Review. - Automated lipid droplet quantification system for phenotypic analysis of adipocytes using CellProfiler.
Adomshick V, Pu Y, Veiga-Lopez A. Adomshick V, et al. Toxicol Mech Methods. 2020 Jun;30(5):378-387. doi: 10.1080/15376516.2020.1747124. Epub 2020 Apr 8. Toxicol Mech Methods. 2020. PMID: 32208812 Free PMC article. - Role of Flavonoids in The Interactions among Obesity, Inflammation, and Autophagy.
García-Barrado MJ, Iglesias-Osma MC, Pérez-García E, Carrero S, Blanco EJ, Carretero-Hernández M, Carretero J. García-Barrado MJ, et al. Pharmaceuticals (Basel). 2020 Oct 26;13(11):342. doi: 10.3390/ph13110342. Pharmaceuticals (Basel). 2020. PMID: 33114725 Free PMC article. Review. - Emerging Roles of Lipophagy in Health and Disease.
Kounakis K, Chaniotakis M, Markaki M, Tavernarakis N. Kounakis K, et al. Front Cell Dev Biol. 2019 Sep 10;7:185. doi: 10.3389/fcell.2019.00185. eCollection 2019. Front Cell Dev Biol. 2019. PMID: 31552248 Free PMC article. Review.
References
- Clinical N. I. H. Guidelines on the Identification, Evaluation, and Treatment of Overweight and Obesity in Adults–The Evidence Report. National Institutes of Health. Obes Res 6 Suppl 2, 51S–209S (1998). - PubMed
- Mizushima N., Yoshimori T. & Ohsumi Y. The role of Atg proteins in autophagosome formation. Annu Rev Cell Dev Biol 27, 107–32 (2011). - PubMed
Publication types
MeSH terms
Substances
LinkOut - more resources
Full Text Sources
Other Literature Sources
Medical
Molecular Biology Databases
Research Materials
Miscellaneous


