mDia1 regulates breast cancer invasion by controlling membrane type 1-matrix metalloproteinase localization - PubMed (original) (raw)
mDia1 regulates breast cancer invasion by controlling membrane type 1-matrix metalloproteinase localization
Daehwan Kim et al. Oncotarget. 2016.
Abstract
Mammalian diaphanous-related formin 1 (mDia1) expression has been linked with progression of malignant cancers in various tissues. However, the precise molecular mechanism underlying mDia1-mediated invasion in cancer cells has not been fully elucidated. In this study, we found that mDia1 is upregulated in invasive breast cancer cells. Knockdown of mDia1 in invasive breast cancer profoundly reduced invasive activity by controlling cellular localization of membrane type 1-matrix metalloproteinase (MT1-MMP) through interaction with microtubule tracks. Gene silencing and ectopic expression of the active form of mDia1 showed that mDia1 plays a key role in the intracellular trafficking of MT1-MMP to the plasma membrane through microtubules. We also demonstrated that highly invasive breast cancer cells possessed invasive activity in a 3D culture system, which was significantly reduced upon silencing mDia1 or MT1-MMP. Furthermore, mDia1-deficient cells cultured in 3D matrix showed impaired expression of the cancer stem cell marker genes, CD44 and CD133. Collectively, our findings suggest that regulation of cellular trafficking and microtubule-mediated localization of MT1-MMP by mDia1 is likely important in breast cancer invasion through the expression of cancer stem cell genes.
Keywords: breast cancer cells; invasion; mDia1; membrane type 1-matrix metalloproteinase (MT1-MMP); microtubule dynamics.
Conflict of interest statement
CONFLICTS OF INTEREST
The authors declare no conflicts of interest.
Figures
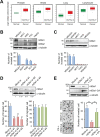
Figure 1. mDia1 stimulates breast cancer invasion
A. Analysis of mDia1 gene expression in prostate, breast, lung and lymphocyte using the Oncomine database. B, C. Western blotting and transwell migration assays showed that MDA-MB-231 cells are highly motile and invasive. Expression of mDia1 was higher in invasive breast cancer cells (MDA-MB-231 and MDA-MB-361) than in non-invasive cancer cells (MCF7, T47D, and MDA-MB-453). D. Western blot analysis demonstrating the downregulation of mDia1 in MDA-MB-231 cells transfected with siRNA against mDia1 (mDia1-si #1, #2, and #3) compared with mock-transfected cells (Mock-si). Numbers under the blot indicate relative levels of mDia1 expression in the samples. siRNA-mediated silencing of mDia1 led to a significant decrease in invasive capability, but not in motility. E. Western blot analysis comparing the expression of mDia1 among MDA-MB-231 cells transfected with mock siRNA (Mock-si), mDia1 siRNA (mDia1-si), or the constitutively active form of mDia1 (mDia1-CA). Knockdown of mDia1 resulted in decreased invasiveness, which was rescued by the forced expression of mDia1-CA. Images were obtained by light microscopy. **p < 0.01.
Figure 2. mDia1 stimulates invasion through MT1-MMP
A. Invasion of MDA-MB-231 cells transfected with mock and mDia1-CA plasmid was measured using transwells. GM6001 (5 μM) was added to both cells to prevent MMP-dependent invasion. Invasiveness induced by overexpression of mDia1-CA was significantly decreased in the presence of 5 μM GM6001. B. Western blot analysis demonstrating the expression level of MT1-MMP in MDA-MB-231 cells transfected with mock siRNA (Mock-si) or MT1-MMP siRNA (MT1-MMP-si). Total cell lysates were subjected to Western blot analysis using an antibody against MT1-MMP. Expression of MT1-MMP was markedly decreased following siRNA silencing, resulting in reduced MMP-2 activity. Numbers under the blot and zymography gels indicate relative levels of MT1-MMP and MMP-2 activity in the samples, respectively. C. Western blot analysis demonstrating mDia1-CA and MT1-MMP expression levels in MDA-MB-231 cells transfected with mDia1-CA plasmid and MT1-MMP siRNA. Numbers under the blot indicate relative levels of MT1-MMP in the samples. Cells were subjected to transwell invasion assay. Images were obtained by light microscopy. *p < 0.05, ** p < 0.01.
Figure 3. mDia1 regulates membrane localization of MT1-MMP
A. Western blot analysis demonstrating MT1-MMP expression levels in MDA-MB-231 cells transfected with mock siRNA (Mock-si), mDia1 siRNA (mDia1-si), or mDia1 siRNA plus mDia1-CA plasmid (mDia1-si + CA). Cell lysates were subjected to Western blot analysis using an antibody against MT1-MMP. MMP-9 and MMP-2 activities were determined by gelatin zymography. Numbers under the blot and zymography gels indicate relative levels of MT1-MMP and activity of MMP-2 in the samples, respectively. B. Membrane fractionation assay was performed using MDA-MB-231 cells transfected with mock siRNA (Mock-si), mDia1 siRNA (mDia1-si), or mDia1 siRNA plus mDia1-CA plasmid (mDia1-si + CA). Cell lysates were subjected to Western blot analysis using antibodies against mDia1, Integrin β1, and α-tubulin. Integrin β1 and α-tubulin were used as positive controls for the plasma membrane and the cytosolic fractions, respectively [54, 55]. C, cytosol; P, plasma membrane. C. Cells transfected with mock siRNA (Mock-si), mDia1 siRNA (mDia1-si), or mDia1 siRNA plus mDia1-CA plasmid (mDia1-si + CA) were fixed, and then stained with an antibody against MT1-MMP followed by a secondary Cy3-conjugated antibody to label endogenous MT1-MMP on the cell surface or in whole cells. Scale bar, 20 μm. **p < 0.01.
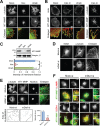
Figure 4. mDia1 affects MT1-MMP localization by modulating microtubule dynamics
A. Immunofluorescence labeling confocal microscopy for α-tubulin (green) and MT1-MMP (red) in nocodazole-treated MDA-MB-231 cells. Cells were treated with 5 μM nocodazole for 1 h. Mock, mock-treated cells; Noc, nocodazole; Wash, nocodazole was washed out of cells. Arrowheads indicate co-localization of α-tubulin and MT1-MMP. Scale bar, 20 μm. B. Similar experiments were performed as in (A.) but by using cells treated with cytochalasin D. Cells were stained with Alexa Fluor® 488 phalloidin for actin (green) and antibody against MT1-MMP (red) (left). One of the same samples was also stained with antibodies against α-tubulin (green) and MT1-MMP (red) (right). Mock, mock-treated cells; Cyto D, cytochalasin D; Wash, cytochalasin D was washed out of cells. Arrowheads indicate co-localization of actin and MT1-MMP (left) and of α-tubulin and MT1-MMP (right). Scale bar, 20 μm. C. Membrane fractionation assay was performed using nocodazole-treated MDA-MB-231 cells. Cell lysates were subjected to Western blot analysis with antibodies against MT1-MMP and integrin β1. Integrin β1 was used as a positive control for the plasma membrane fraction. D. Immunofluorescence labeling confocal microscopy for α-tubulin and mDia1 in MDA-MB-231 cells transfected with mock siRNA (Mock-si) and mDia1 siRNA (mDia1-si). Scale bar, 20 μm. E. Nocodazole-treated mock siRNA-transfected (Mock-si) and mDia1-silenced cells (mDia1-si) were washed to re-polymerize microtubules, then fixed and stained with antibodies against α-tubulin (green), MT1-MMP (red), and 4′,6-diamidino-2-phenylindole (DAPI). Arrowheads indicate co-localization of MT1-MMP and α-tubulin (upper). Scale bar, 20 μm. More detailed area of co-localization of MT1-MMP and α-tubulin in cell peripheral region is represented (lower), and their intensity was quantified. Co-localization of MT1-MMP and α-tubulin in mDia1-silenced cells was significantly decreased. Dashed line indicates cell outline. F. MDA-MB-231 cells transfected mock siRNA (Mock-si) and mDia1 siRNA (mDia1-si) were fixed and stained with antibodies against MT1-MMP (green) and LAMP1 (red) or EEA1 (red), respectively, and analyzed by TIRFM. Insets are higher magnification views of boxed areas. Arrowheads indicate co-localization of MT1-MMP and LAMP1 or EEA1, and arrows indicate lesser or non-co-localization of MT1-MMP and LAMP1 or EEA1. Scale bar, 20 μm. **p < 0.01.
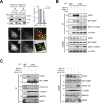
Figure 5. mDia1 regulates interaction between MT1-MMP and microtubules
A. Immunoprecipitation (IP) and Western blot analysis demonstrating reduction in MT1-MMP binding to microtubules in MDA-MB-231 cells transfected with siRNA for mDia1 (mDia1-si) compared with that in mock transfected cells (Mock-si). Cell lysates were subjected to IP with an antibody against MT1-MMP, followed by Western blot analysis with antibodies against mDia1, α-tubulin, and MT1-MMP. Relative ratio of IP over total protein expression was quantified and presented. MT1, MT1-MMP; Mo, Mock; mD, mDia1. Immunofluorescence was used to visualize mDia1 (red) and MT1-MMP (green). (a) mDia1 immunofluorescence; (b) MT1-MMP immunofluorescence; (c) enlarged inset area from (a); (d) enlarged inset area from (b); (e) merged image of (c) and (d) showing areas of co-localization; (f) reconstruction of co-localized fluorescence peaks. The arrows indicate co-localization of MT1-MMP and mDia1. Scale bar, 20 μm. B. IP and Western blot analysis demonstrating a decrease in the amount of interaction between MT1-MMP and α-tubulin in MDA-MB-231 cells transfected with siRNA for mDia1 (mDia1-si) compared with mock siRNA-transfected cells (Mock-si). Cell lysates were subjected to IP using an antibody against α-tubulin, followed by Western blot analysis using antibodies against mDia1, MT1-MMP, detyrosinated-α-tubulin, and α-tubulin. Detyrosinated-α-tubulin was used as an internal control to demonstrate that mDia1 specifically regulates MT1-MMP binding to microtubules. Numbers under the blot indicate relative levels of IP over total protein expression in the samples. C. IP and Western blot analysis showing a decrease in the amount of interaction between MT1-MMP and α-tubulin in MDA-MB-231 cells transfected with siRNA for mDia1 (mDia1-si), which was markedly rescued by forced expression of mDia1-CA. Cell lysates were subjected to IP using an antibody against α-tubulin, followed by Western blot analysis with antibodies against mDia1, MT1-MMP, GFP, α-tubulin, microtubule-associated protein (MAP) 1B, and MAP2. MAP1B and MAP2 were used to confirm the specificity of interactions among mDia1, MT1-MMP, and α-tubulin. Numbers under the blot indicate relative levels of IP over total protein expression in the samples. **p < 0.01.
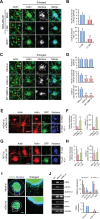
Figure 6. mDia1 is required for breast cancer invasion in 3D environments
A, B. Immunofluorescence labeling demonstrating protrusive phenotypes of MDA-MB-231 cells treated with or without GM6001 (5 μM) and of MCF7 cells. MDA-MB-231 and MCF7 cells were mixed with collagen (2 mg/ml) and Matrigel® (1 mg/ml), then allowed to polymerize for 1 h. 3D matrices were incubated for 6 days to allow spheroid formation. Samples were fixed and stained with phalloidin and DAPI to visualize cellular actin and nuclei, respectively. The histogram shows the number of protrusive cells per spheroid and the lengths of protrusive cells in untreated MDA-MB-231 cells compared with those of cells treated with GM6001. C, D. Similar experiments were performed using MDA-MB-231 cells transfected with mock siRNA (Mock-si), mDia1 siRNA (mDia1-si), and MT1-MMP siRNA (MT1-MMP-si). The histogram shows the number of spheroids in each matrix, the number of protrusive cells per spheroid, and the lengths of protrusive cells in MDA-MB-231 cells transfected with siRNA against mDia1 (mDia1-si) and MT1-MMP (MT1-MMP-si) compared with those of mock transfected cells (Mock-si). Arrowheads and arrows indicate the protrusive phenotype and cells, respectively. Scale bar, 50 μm. *p < 0.05, ** p < 0.01 E, F. Similar experiments were performed using MDA-MB-231 cells transfected with mDia1 siRNA (mDia1-si) and mDia1 siRNA plus mDia1-CA plasmid (mDia1-si + CA). As shown by the histogram, the number of protrusive cells per spheroid and the lengths of protrusive cells were decreased in mDia1 siRNA transfected cells and significantly rescued by overexpression of mDia1-CA. Scale bar, 50 μm. G, H. Similar experiments were performed using MDA-MB-231 cells transfected with MT1-MMP siRNA (MT1-si) and MT1-MMP siRNA plus mDia1-CA plasmid (MT1-si + CA). As shown by the histogram, the number of protrusive cells per spheroid and the lengths of protrusive cells were decreased in MT1-MMP siRNA transfected cells, which was not markedly restored by overexpression of mDia1-CA. Scale bar, 50 μm. I, J. MDA-MB-231 cells transfected with mock siRNA (Mock-si) and mDia1 siRNA (mDia1-si) were incubated for 2 days to form spheroids as described in Materials and Methods. Collagen embedded spheroids were further incubated for 4 days to allow cell invasion. Samples were fixed and stained with phalloidin and DAPI to visualize cellular actin and nuclei, respectively. At the end of incubation, total RNA of the samples were extracted and used for detection of CD44, CD133, ALDH1A1, Oct3/4, and Sox2 mRNA expression by RT-PCR (left) and qRT-PCR (right). Scale bar, 400 μm. *p < 0.05, ** p < 0.01.
Similar articles
- Matrix metalloproteinase‑2 regulates MDA‑MB‑231 breast cancer cell invasion induced by active mammalian diaphanous-related formin 1.
Kim D, Rhee S. Kim D, et al. Mol Med Rep. 2016 Jul;14(1):277-82. doi: 10.3892/mmr.2016.5282. Epub 2016 May 13. Mol Med Rep. 2016. PMID: 27177153 - Enhanced membrane-type 1 matrix metalloproteinase expression by hyaluronan oligosaccharides in breast cancer cells facilitates CD44 cleavage and tumor cell migration.
Kung CI, Chen CY, Yang CC, Lin CY, Chen TH, Wang HS. Kung CI, et al. Oncol Rep. 2012 Nov;28(5):1808-14. doi: 10.3892/or.2012.1993. Epub 2012 Aug 24. Oncol Rep. 2012. PMID: 22922740 - Less is more: low expression of MT1-MMP is optimal to promote migration and tumourigenesis of breast cancer cells.
Cepeda MA, Pelling JJ, Evered CL, Williams KC, Freedman Z, Stan I, Willson JA, Leong HS, Damjanovski S. Cepeda MA, et al. Mol Cancer. 2016 Oct 18;15(1):65. doi: 10.1186/s12943-016-0547-x. Mol Cancer. 2016. PMID: 27756325 Free PMC article. - Matrix invasion by tumour cells: a focus on MT1-MMP trafficking to invadopodia.
Poincloux R, Lizárraga F, Chavrier P. Poincloux R, et al. J Cell Sci. 2009 Sep 1;122(Pt 17):3015-24. doi: 10.1242/jcs.034561. J Cell Sci. 2009. PMID: 19692588 Review. - Nucleus-Invadopodia Duo During Cancer Invasion.
Ferrari R, Infante E, Chavrier P. Ferrari R, et al. Trends Cell Biol. 2019 Feb;29(2):93-96. doi: 10.1016/j.tcb.2018.11.006. Epub 2018 Dec 17. Trends Cell Biol. 2019. PMID: 30573318 Review.
Cited by
- DDR2 controls the epithelial-mesenchymal-transition-related gene expression via c-Myb acetylation upon matrix stiffening.
Kim D, You E, Jeong J, Ko P, Kim JW, Rhee S. Kim D, et al. Sci Rep. 2017 Jul 28;7(1):6847. doi: 10.1038/s41598-017-07126-7. Sci Rep. 2017. PMID: 28754957 Free PMC article. - SMIFH2 inhibition of platelets demonstrates a critical role for formin proteins in platelet cytoskeletal dynamics.
Green HLH, Zuidscherwoude M, Alenazy F, Smith CW, Bender M, Thomas SG. Green HLH, et al. J Thromb Haemost. 2020 Apr;18(4):955-967. doi: 10.1111/jth.14735. Epub 2020 Feb 17. J Thromb Haemost. 2020. PMID: 31930764 Free PMC article. - PTPN3 suppresses lung cancer cell invasiveness by counteracting Src-mediated DAAM1 activation and actin polymerization.
Li MY, Peng WH, Wu CH, Chang YM, Lin YL, Chang GD, Wu HC, Chen GC. Li MY, et al. Oncogene. 2019 Oct;38(44):7002-7016. doi: 10.1038/s41388-019-0948-6. Epub 2019 Aug 12. Oncogene. 2019. PMID: 31406243 - Formins in Human Disease.
Labat-de-Hoz L, Alonso MA. Labat-de-Hoz L, et al. Cells. 2021 Sep 27;10(10):2554. doi: 10.3390/cells10102554. Cells. 2021. PMID: 34685534 Free PMC article. Review. - Protein diaphanous homolog 1 (Diaph1) promotes myofibroblastic activation of hepatic stellate cells by regulating Rab5a activity and TGFβ receptor endocytosis.
Liu D, Fu X, Wang Y, Wang X, Wang H, Wen J, Kang N. Liu D, et al. FASEB J. 2020 Jun;34(6):7345-7359. doi: 10.1096/fj.201903033R. Epub 2020 Apr 18. FASEB J. 2020. PMID: 32304339 Free PMC article.
References
- Yilmaz M, Christofori G. EMT, the cytoskeleton, and cancer cell invasion. Cancer Metastasis Rev. 2009;28:15–33. - PubMed
- Wang Y, Wen J, Zhang W. MIIP, a cytoskeleton regulator that blocks cell migration and invasion, delays mitosis, and suppresses tumorogenesis. Curr Protein Pept Sci. 2011;12:68–73. - PubMed
- Poincloux R, Lizarraga F, Chavrier P. Matrix invasion by tumour cells: a focus on MT1-MMP trafficking to invadopodia. J Cell Sci. 2009;122:3015–3024. - PubMed
- Remacle AG, Rozanov DV, Baciu PC, Chekanov AV, Golubkov VS, Strongin AY. The transmembrane domain is essential for the microtubular trafficking of membrane type-1 matrix metalloproteinase (MT1-MMP) J Cell Sci. 2005;118:4975–4984. - PubMed
Publication types
MeSH terms
Substances
LinkOut - more resources
Full Text Sources
Other Literature Sources
Medical
Research Materials
Miscellaneous


