Improved Methods for Fluorescence Microscopy Detection of Macromolecules at the Axon Initial Segment - PubMed (original) (raw)
Improved Methods for Fluorescence Microscopy Detection of Macromolecules at the Axon Initial Segment
Musaad A Alshammari et al. Front Cell Neurosci. 2016.
Abstract
The axonal initial segment (AIS) is the subcellular compartment required for initiation of the action potential in neurons. Scaffolding and regulatory proteins at the AIS cluster with ion channels ensuring the integrity of electrical signaling. Interference with the configuration of this protein network can lead to profound effects on neuronal polarity, excitability, cell-to-cell connectivity and brain circuit plasticity. As such, the ability to visualize AIS components with precision provides an invaluable opportunity for parsing out key molecular determinants of neuronal function. Fluorescence-based immunolabeling is a sensitive method for morphological and molecular characterization of fine structures in neurons. Yet, even when combined with confocal microscopy, detection of AIS elements with immunofluorescence has been limited by the loss of antigenicity caused by fixative materials. This technical barrier has posed significant limitations in detecting AIS components alone or in combination with other markers. Here, we designed improved protocols targeted to confocal immunofluorescence detection of the AIS marker fibroblast growth factor 14 (FGF14) in combination with the cytoskeletal-associated protein Ankyrin-G, the scaffolding protein βIV-spectrin, voltage-gated Na(+) (Nav) channels (especially the Nav1.6 isoform) and critical cell type-specific neuronal markers such as parvalbumin, calbindin, and NeuN in the mouse brain. Notably, we demonstrate that intracardiac perfusion of animals with a commercially available solution containing 1% formaldehyde and 0.5% methanol, followed by brief fixation with cold acetone is an optimal and sensitive protocol for FGF14 and other AIS marker detection that guarantees excellent tissue integrity. With variations in the procedure, we also significantly improved the detection of Nav1.6, a Nav isoform known for its fixative-sensitivity. Overall, this study provides an ensemble of immunohistochemical recipes that permit excellent staining of otherwise invisible molecules within well-preserved tissue architecture. While improving the specific investigation of AIS physiology and cell biology, our thorough study can also serve as a roadmap for optimizing immunodetection of other fixative-sensitive proteins expanding the repertoire of enabling methods for brain studies.
Keywords: Ankyrin-G; FGF14; Nav1.6; axon initial segment; immunohistochemistry; nodes of Ranvier; sodium channel.
Figures
Figure 1
Scheme and examples of routinely used brain tissue preparations for immunohistochemistry. (A) Free-floating sections of 4% PFA perfusion-fixed mouse brain tissue are depicted in individual wells in a 24-well plate before mounting. (a) Representative confocal image of 4% PFA perfusion-fixed sections of the hippocampal DG immunolabeled with a rabbit anti-calbindin (CB) antibody visualized with an Alexa 488-conjugated secondary antibody (green), a mouse monoclonal anti-calretinin (CR) antibody visualized with an Alexa 568-conjugated secondary antibody (red) and Topro-3 nuclei staining (blue). (B) Fresh-frozen mouse brain slices directly adhered to positively charged glass slides. (b) Representative confocal image of a fresh-frozen section of the hippocampal DG, immunolabeled with a mouse monoclonal anti-FGF14 antibody visualized with an Alexa 568-conjugated secondary antibody. PFA, paraformaldehyde; DG, dentate gyrus; ML, molecular layer; GCL, granule cell layer; SGZ, sub-granular zone. Scale bars represent 20 μm.
Scheme 1
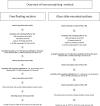
Study design of the three options experimental procedures. Mouse brain tissues were processed following three general procedures for fixation including Option A (fresh-frozen), Option B (perfusion-fixed), and Option C (freshly prepared acute brain slices) with up to ten variations in the type of fixative used for perfusion through the vascular system and/or for post-fixation treatment (Tables 1–3).
Scheme 2
Immunostaining procedure. Workflow of the general immunostaining procedure used for free floating and glass slide pre-mounted brain sections.
Figure 2
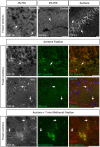
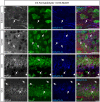
Representative examples of double immunofluorescence staining of mouse brain fresh-frozen sections followed by the indicated post-fixative treatments. (A) Weak detection of FGF14 immunoreactivity at the AIS (arrow) in cells in the mouse cortical region using 1% PFA post-fixed treatment (Scheme 1, Option A, first column of Table 1). (B) Weak detection of FGF14 immunoreactivity at the AIS (arrow) in cells of the mouse cortical region using 4% PFA post-fixed treatment (Scheme 1, Option A, second column of Table 1). (C) Optimal detection of FGF14 immunoreactivity in the CA3 hippocampal region following acetone-based brief post-fixation treatment (Scheme 1, Option A, third column of Table 1). (D) Representative confocal images of double immunostaining of the DG using acetone-based post-fixation treatment. The gray and red channels represent FGF14 immunoreactivity visualized with an Alexa 568-conjugated secondary antibody. The green channel represents βIV-spectrin immunoreactivity visualized with an Alexa 488-conjugated secondary antibody. Arrows show co-localization between FGF14 and βIV-spectrin at the AIS. Green and red channel overlay images are shown on the right. (E) Representative confocal images of double immunostaining of the NAc using acetone-based (without methanol) post-fixation treatment (Scheme 1, Option A, third column of Table 1). The gray and red channels represent FGF14 immunoreactivity, the green channel represents Nav1.6 (primary antibody from Alomone Labs) visualized (weakly) with an Alexa 488-conjugated secondary antibody. The blue represents Topro-3 nuclear staining shown in the green, red, and blue image overlay on the right. Arrows show co-localization between FGF14 and Nav1.6 at the AIS. (F) Representative confocal images of double immunostaining of a zoomed area of the CA1 hippocampal region using acetone + methanol-based post-fixation treatment (Scheme 1, Option A, fourth column of Table 1). The gray and red channels represent FGF14 immunoreactivity visualized with an Alexa 568-conjugated secondary antibody. The green channel represents parvalbumin immunoreactivity visualized with an Alexa 488-conjugated secondary antibody. Arrows show localization of FGF14 at the AIS in areas around the parvalbumin soma. Green and red channel overlay images are shown on the right. Note an FGF14 positive halo overlays with somatic parvalbumin staining suggesting localized co-expression of the two proteins in cytoplasmic regions. Arrows indicate FGF14, βIV-spectrin, and/or Nav1.6 signals at the axon initial segment (AIS). DG, dentate gyrus; NAc, nucleus accumbens; PFA, paraformaldehyde. Scale bars represent 20 μm.
Figure 3
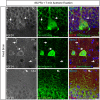
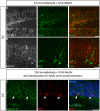
Representative examples of immunofluorescence staining of mouse fixed brain sections followed by indicated post-fixation treatments. (A) 1% PFA perfused-brain fixation revealed weak detection of FGF14 at the AIS in the DG region (Scheme 1, Option B, first column of Tale 2). (B) Light fixation with a mixture containing 1% formaldehyde and 0.5% methanol (diluted from commercially available mixture of 37% formaldehyde in PBS, pH = 7.4) resulted in robust staining of FGF14 in the DG region (Scheme 1, Option B, second column of Table 2). (C) FGF14 immunoreactivity is almost non-detectable in the DG upon 4% PFA perfused-fixed sections [Scheme 1, Option B, third column of Table 2 (left)]. (D) FGF14 immunoreactivity is enhanced in 4% PFA perfused-brain followed by brief acetone post-fixation treatment [Scheme 1, Option B, third column of Table 2 (right)]. (E) FGF14 immunoreactivity is non-detectable in Optimal Fix™ perfusion conditions (Scheme 1, Option B, fifth column of Table 2). (F) The green channel represents calbindin immunoreactivity visualized with an Alexa 488-conjugated secondary antibody in the DG. (G) Enhanced NeuN staining visualized with an Alexa 488-conjugated secondary antibody in 1% formaldehyde with 0.5% methanol fixation in the DG. (H) Detection of parvalbumin immunoreactivity visualized with an Alexa 488-conjugated secondary antibody in the soma and dendrites with 4% PFA fixed sections in the DG. (I) Parvalbumin immunoreactivity in the soma and dendrites in the CA3 hippocampal region using 4% PFA followed by brief acetone post-fixation treatment. (J) Calbindin immunoreactivity in the cerebellum using Optimal Fix™ perfusion. DG, dentate gyrus; PFA, paraformaldehyde. Scale bars represent 20 μm.
Figure 4
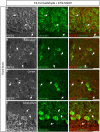
Representative examples of double immunofluorescence staining of mouse brain tissue using 4% PFA perfusion and acetone-based post-fixation treatment. For the entire figure, the gray and red channels represent FGF14 immunoreactivity visualized with an Alexa 568-conjugated secondary antibody; the green channel represents parvalbumin immunoreactivity visualized with an Alexa 488-conjugated secondary antibody; image overlaid of the green, red, and blue channel (representing Topro-3 nuclear staining) in the DG region (A), PFC region (B), and CA1 region (C). (C) The same staining and immunolabelling used in (A,B) reveals a rather weak signal corresponding to FGF14 immunoreactivity, but selective parvalbumin labeling of somata and dendrites (green) in the CA1 hippocampal region. Arrows show FGF14 signals at the axon initial segment (AIS). DG, dentate gyrus; PFC, pre-frontal cortex; PFA, paraformaldehyde. Scale bars represent 20 μm.
Figure 5
Representative examples of double immunofluorescence staining of mouse brain tissue using 1% formaldehyde and 0.5% MeOH fixation. (A–D) For the entire figure, the gray and red channels represent FGF14 immunoreactivity and the green calbindin in indicated brain regions. The corresponding green and red merged images are shown in the right column. Arrows indicate FGF14 signal at the axon initial segment (AIS). DG, dentate gyrus. Scale bars represent 20 μm.
Figure 6
Representative examples of triple immunofluorescence staining of mouse brain tissue using 1% formaldehyde and 0.5% MeOH fixation. (A–D) For the entire figure, the gray and red channels represent FGF14 immunoreactivity, the green NeuN, and blue Ankyrin-G (NeuroMab, catalog number 75-146) in indicated brain regions. The corresponding multichannel overlaid images are shown in the right column. DG, dentate gyrus; NeuN, Neuronal marker. Scale bars represent 20 μm.
Figure 7
Immunolabeling of FGF14 and selected neurogenesis markers in the DG using 1% formaldehyde and 0.5% MeOH fixation. (A) The gray and red channels represent FGF14 immunoreactivity visualized with an Alexa 568-conjugated secondary antibody, and the green channel represents Sox2, or DCX in (B), visualized with an Alexa 488-conjugated secondary antibody. Green and red channels overlaid images are shown in the right column of both (A,B). (C) The green channel represents Ankyrin-G (NeuroMab, catalog number 75-146) visualized with an Alexa 488-conjugated secondary antibody. The red channel represents BrdU immunoreactivity visualized with an Alexa 568-conjugated secondary antibody and the blue represents NeuN visualized with an Alexa 647-conjugated secondary antibody. DG, dentate gyrus; Sox2, Sex determining region Y-Box 2; DCX, doublecortin; BrdU, Bromodeoxyuridine; NeuN, Neuronal marker. Scale bars represent 20 μm.
Figure 8
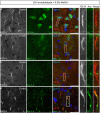
Co-localization of FGF14 and Nav1.6 in mouse cortex using 1% formaldehyde and 0.5% MeOH fixation. (A–D) The gray and red channels represent FGF14 immunoreactivity visualized with an Alexa 568-conjugated secondary antibody, the green channel represents PanNav (Sigma-Aldrich, rabbit anti PanNav, catalog number S6936) in (A), Nav1.1 (Alomone Labs) in (B), Nav1.2 (Alomone Labs) in (C), and Nav1.6 (Alomone Labs) in (D) visualized with an Alexa 488-conjugated secondary antibody and the blue represents Topro3 nuclear staining in the cortex. Right panels represent overlaid images (third column from the left) and high magnification of boxed ROI from the merged images. Scale bars represent 20 μm.
Figure 9
Evaluation of the 1% formaldehyde + 0.5% MeOH fixation method for post-hoc analysis in acute brain slices. (A–C) The gray channel represents FGF14 immunoreactivity visualized with an Alexa 568-conjugated secondary antibody. The green channel represents Nav1.6 (Alomone Labs) visualized with an Alexa 488-conjugated secondary antibody, and the blue represents Ankyrin-G (NeuroMab, catalog number 75-146) visualized with an Alexa 647-conjugated secondary antibody in the cortex at low in (A,C) and high in (B) magnification. Images in (A,B) are from the cortex while images in (C) are taken from the NAc. (D) The red channel represents Nav1.6 (Alomone Labs) immunoreactivity visualized with an Alexa 568-conjugated secondary antibody. The green channel represents Ankyrin-G (NeuroMab, catalog number 75–146) visualized with an Alexa 488-conjugated secondary antibody and the blue represents NeuN (visualized with an Alexa 647-conjugated secondary antibody) in the NAc. Arrows show FGF14 and/or Nav1.6 signals at the axon initial segment (AIS). NAc, nucleus accumbens. Scale bars represent 20 μm.
Similar articles
- FGF14 localization and organization of the axon initial segment.
Xiao M, Bosch MK, Nerbonne JM, Ornitz DM. Xiao M, et al. Mol Cell Neurosci. 2013 Sep;56:393-403. doi: 10.1016/j.mcn.2013.07.008. Epub 2013 Jul 26. Mol Cell Neurosci. 2013. PMID: 23891806 Free PMC article. - Characterization of the axon initial segment of mice substantia nigra dopaminergic neurons.
González-Cabrera C, Meza R, Ulloa L, Merino-Sepúlveda P, Luco V, Sanhueza A, Oñate-Ponce A, Bolam JP, Henny P. González-Cabrera C, et al. J Comp Neurol. 2017 Nov 1;525(16):3529-3542. doi: 10.1002/cne.24288. Epub 2017 Aug 18. J Comp Neurol. 2017. PMID: 28734032 - M-current inhibition rapidly induces a unique CK2-dependent plasticity of the axon initial segment.
Lezmy J, Lipinsky M, Khrapunsky Y, Patrich E, Shalom L, Peretz A, Fleidervish IA, Attali B. Lezmy J, et al. Proc Natl Acad Sci U S A. 2017 Nov 21;114(47):E10234-E10243. doi: 10.1073/pnas.1708700114. Epub 2017 Nov 6. Proc Natl Acad Sci U S A. 2017. PMID: 29109270 Free PMC article. - Axonal Membranes and Their Domains: Assembly and Function of the Axon Initial Segment and Node of Ranvier.
Nelson AD, Jenkins PM. Nelson AD, et al. Front Cell Neurosci. 2017 May 9;11:136. doi: 10.3389/fncel.2017.00136. eCollection 2017. Front Cell Neurosci. 2017. PMID: 28536506 Free PMC article. Review. - The Axon Initial Segment, 50Years Later: A Nexus for Neuronal Organization and Function.
Leterrier C. Leterrier C. Curr Top Membr. 2016;77:185-233. doi: 10.1016/bs.ctm.2015.10.005. Epub 2015 Nov 28. Curr Top Membr. 2016. PMID: 26781833 Review.
Cited by
- Axon initial segment geometry in relation to motoneuron excitability.
Rotterman TM, Carrasco DI, Housley SN, Nardelli P, Powers RK, Cope TC. Rotterman TM, et al. PLoS One. 2021 Nov 19;16(11):e0259918. doi: 10.1371/journal.pone.0259918. eCollection 2021. PLoS One. 2021. PMID: 34797870 Free PMC article. - An ankyrin G-binding motif mediates TRAAK periodic localization at axon initial segments of hippocampal pyramidal neurons.
Luque-Fernández V, Vanspauwen SK, Landra-Willm A, Arvedsen E, Besquent M, Sandoz G, Rasmussen HB. Luque-Fernández V, et al. Proc Natl Acad Sci U S A. 2024 Jul 30;121(31):e2310120121. doi: 10.1073/pnas.2310120121. Epub 2024 Jul 26. Proc Natl Acad Sci U S A. 2024. PMID: 39058579 Free PMC article. - Epilepsy and neuropsychiatric comorbidities in mice carrying a recurrent Dravet syndrome SCN1A missense mutation.
Ricobaraza A, Mora-Jimenez L, Puerta E, Sanchez-Carpintero R, Mingorance A, Artieda J, Nicolas MJ, Besne G, Bunuales M, Gonzalez-Aparicio M, Sola-Sevilla N, Valencia M, Hernandez-Alcoceba R. Ricobaraza A, et al. Sci Rep. 2019 Oct 2;9(1):14172. doi: 10.1038/s41598-019-50627-w. Sci Rep. 2019. PMID: 31578435 Free PMC article. - Pathological consequences of chronic olfactory inflammation on neurite morphology of olfactory bulb projection neurons.
LaFever BJ, Kawasawa YI, Ito A, Imamura F. LaFever BJ, et al. Brain Behav Immun Health. 2022 Mar 18;21:100451. doi: 10.1016/j.bbih.2022.100451. eCollection 2022 May. Brain Behav Immun Health. 2022. PMID: 35360408 Free PMC article. - The penetration of methanol into bovine cardiac and hepatic tissues is faster than ethanol and formalin.
Steicke M, Yang G, Dinh TN, Dunster-Jones M, Sargisson O, Ahmady F, Golledge J, Wang Y. Steicke M, et al. Eur J Histochem. 2018 Feb 7;62(1):2880. doi: 10.4081/ejh.2018.2880. Eur J Histochem. 2018. PMID: 29569879 Free PMC article.
References
- Al-Mulla F. (2011). Formalin-Fixed Paraffin-Embedded Tissues Methods and Protocols. New York, NY: Humana Press.
- Bancroft J. D., Stevens A. (1990). Theory and Practice of Histological Techniques. Edinburgh; New York, NY: Churchill Livingstone.
- Bocksteins E., Shepherd A. J., Mohapatra D. P., Snyders D. J. (2012). Immunostaining of voltage-gated ion channels in cell lines and neurons—key concepts and potential pitfalls, in Applications of Immunocytochemistry, ed Dehghani H. (InTech; ). 10.5772/34817 Available online at: http://www.intechopen.com/books/applications-of-immunocytochemistry/immu... - DOI
LinkOut - more resources
Full Text Sources
Other Literature Sources
Research Materials


