Excess sphingomyelin disturbs ATG9A trafficking and autophagosome closure - PubMed (original) (raw)
. 2016 May 3;12(5):833-49.
doi: 10.1080/15548627.2016.1159378. Epub 2016 Apr 12.
Signe Diness Vindeløv 1, Saara Hämälistö 1, Baharia Mograbi 2, Anne Keldsbo 1, Jan Hinrich Bräsen 3, Elena Favaro 1, Dieter Adam 4, Piotr Szyniarowski 1, Paul Hofman 2 5, Stefan Krautwald 6, Thomas Farkas 1, Nikolaj H T Petersen 1, Mikkel Rohde 1, Andreas Linkermann 6, Marja Jäättelä 1
Affiliations
- PMID: 27070082
- PMCID: PMC4854555
- DOI: 10.1080/15548627.2016.1159378
Excess sphingomyelin disturbs ATG9A trafficking and autophagosome closure
Elisabeth Corcelle-Termeau et al. Autophagy. 2016.
Abstract
Sphingomyelin is an essential cellular lipid that traffics between plasma membrane and intracellular organelles until directed to lysosomes for SMPD1 (sphingomyelin phosphodiesterase 1)-mediated degradation. Inactivating mutations in the SMPD1 gene result in Niemann-Pick diseases type A and B characterized by sphingomyelin accumulation and severely disturbed tissue homeostasis. Here, we report that sphingomyelin overload disturbs the maturation and closure of autophagic membranes. Niemann-Pick type A patient fibroblasts and SMPD1-depleted cancer cells accumulate elongated and unclosed autophagic membranes as well as abnormally swollen autophagosomes in the absence of normal autophagosomes and autolysosomes. The immature autophagic membranes are rich in WIPI2, ATG16L1 and MAP1LC3B but display reduced association with ATG9A. Contrary to its normal trafficking between plasma membrane, intracellular organelles and autophagic membranes, ATG9A concentrates in transferrin receptor-positive juxtanuclear recycling endosomes in SMPD1-deficient cells. Supporting a causative role for ATG9A mistrafficking in the autophagy defect observed in SMPD1-deficient cells, ectopic ATG9A effectively reverts this phenotype. Exogenous C12-sphingomyelin induces a similar juxtanuclear accumulation of ATG9A and subsequent defect in the maturation of autophagic membranes in healthy cells while the main sphingomyelin metabolite, ceramide, fails to revert the autophagy defective phenotype in SMPD1-deficient cells. Juxtanuclear accumulation of ATG9A and defective autophagy are also evident in tissues of smpd1-deficient mice with a subsequent inability to cope with kidney ischemia-reperfusion stress. These data reveal sphingomyelin as an important regulator of ATG9A trafficking and maturation of early autophagic membranes.
Keywords: ATG9A; Niemann Pick disease; acid sphingomyelinase; autophagy; ischemia-reperfusion injury; kidney; lysosome; sphingomyelin; trafficking.
Figures
Figure 1
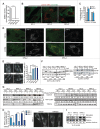
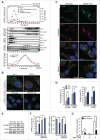
Sphingomyelinases and starvation revert autophagy defect in NPA patient fibroblasts. (A) SMPD1 hydrolytic activity in lysates of fibroblasts from a healthy controls (HC) and NPA patients (NPA). Bars, SD for a quadruplicate representative (n = 3) experiment. (B) Representative confocal images of the indicated fibroblasts permeabilized and stained with lysenin plus anti-lysenin and anti-ceramide antibodies to visualize intracellular SM and ceramide pools. (C) NAGLU and cysteine cathepsin (zFRase) activities in lysates of the indicated fibroblasts. Bars, SD for 3 triplicate experiments. (D) Representative confocal images of NPA-2 and NPA-3 fibroblasts stained for LGALS1 (green), LGALS3 (red) and LAMP2 (white, converted from blue). When indicated, cells were treated with 2 mM LLOMe for 2 h to induce lysosomal membrane permeabilization and LGALS1/3 puncta formation. (E) Representative confocal images of the indicated fibroblasts stained with anti-MAP1LC3B antibody (left) and the quantification of MAP1LC3B-puncta positive cells (≥10 puncta/cell) in these samples (right). Bars, SEM for ≥2 experiments with >50 cells analyzed/sample. (F) Representative immunoblots of MAP1LC3B-I and -II (LC3B-I and LC3B-II) and SQSTM1 from the indicated fibroblasts left untreated (−) or treated (+) for 16 h with 1 nM ConA. HSP90 and GAPDH served as loading controls. The values below represent MAP1LC3B-II:HSP90 and SQSTM1:GAPDH ratios as a percentage of the ratio in untreated HC-1 cells (upper row) or as a percentage of values in untreated cells from the same individual (lower row). (G) Representative immunoblots of MAP1LC3B-II and SQSTM1 from the indicated fibroblasts treated with vehicle (–) or 5 µg/ml of bSMase (left) or rHsSMPD1 (right) (+) every 24 h for the indicated times. TUBA1A served as a loading control. The values below the blots represent SQSTM1:TUBA1A (upper row) and MAP1LC3B-II:TUBA1A (lower row) ratios as a percentage of values in untreated cells from the same individual. (H) Quantification of LC3-puncta positive NPA fibroblasts (≥10 puncta/cell) after treatment with vehicle (−) or 5 µg/ml/24 h bSMase (+) for 48 h and staining with anti-MAP1LC3B antibody (left). Representative images of NPA-1 fibroblasts are shown (right). Bars, as in (C). (I) Representative SQSTM1 immunoblots of proteins from the indicated fibroblasts cultured in the normal growth medium (−) or in HBSS plus 1 g/L glucose (+) for 8 h. TUBA1A served as a loading control. All lanes originate from the same blot. The values represent SQSTM1:TUBA1A ratios as a percentage of values in untreated cells from the same individual. Scale bars: 20 μm. *, P < 0.05; **, P < 0.01; ***, P < 0.001.
Figure 2.
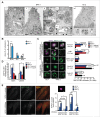
NPA fibroblasts accumulate unclosed autophagic membranes. (A) Representative TEM images of NPA-1 (i to vi) and HC-2 (vii) fibroblasts. Black arrowheads indicate small vesicles in contact with an outer membrane of AVi (vi). Insets in (vii) show representative images of a normal AVi, lysosome (L), multivesicular endososome (MVE) and mitochondrion (mt) in HC-2 fibroblasts. N, nucleus; RER, rough ER. White scale bars: 0.2 µm (i, iii to vi) or 0.5 µm (vii). Black scale bars: 2 µm. (B) Quantification of the cytoplasmic area covered by the indicated autophagic structures in TEM sections of HC-2 and NPA-1 fibroblasts. Bars, SD for 15 randomly chosen cross-sections from 2 independent blocks. Ω/IM, omegasomes and phagophores. (C and D) Representative super resolution SIM images of the indicated MAP1LC3B-positive autophagic membranes in HC-1 and NPA-3 fibroblasts stained for MAP1LC3B and WIPI2 (C, left) and their relative (C, right) and absolute (D) quantification. When indicated, cells were starved in HBSS plus 1 g/L glucose for 2 h or treated with 2 nM ConA for 4 h. Bars, SEM for 4 (HC-1), 10 (NPA-3) or 6 (HC-1, starved and ConA) randomly chosen stacks with 1 to 5 cells each. Scale bars: 0.2 µm. See also 3D reconstructions of a typical omegasome (Movie 1) and tubular phagophore (Movie 2) in starved HC-3 cells and compact (Movie 3) and diffuse (Movie 4) phagophores in NPA-3 cells. (E) Representative confocal images of NPA-3 fibroblasts treated with vehicle (−) or 5 µg/ml/24 h bSMase (+) for 48 h and stained for WIPI2 and MAP1LC3B (left), and quantification of puncta in similarly treated NPA-2 and NPA-3 fibroblasts (right). HC-3 control cells are shown as a negative control. Super resolution 3D-SIM image shows a typical WIPI2-positive puncta in NPA fibroblasts. Bars, SEM for a representative experiment with >20 cells/sample (n = 2). Scale bars: 20 µm (left) and 0.2 µm (right). *, P < 0.05; **, P < 0.01; ***, P < 0.001 by the Student t test.
Figure 3
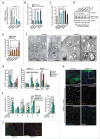
SMPD1 depletion impairs autophagosome closure in MCF7 cells. (A) SMPD1 activity in lysates of MCF7 cells transfected with the indicated siRNAs. Desipramine (25 µM for 1 h) served as a control for SMPD1 inhibition. (B) eGFP-puncta formation in MCF7-eGFP-LC3 cells transfected with the indicated siRNAs. Lipidation-defective mutant eGFP-LC3G120A served as a negative control. Quantification of cells with a minimum of 5 (eGFP-LC3) or one (LC3G120A) puncta are shown. Desipramine (25 µM for 6 h) served as a control. (C) Autophagic flux assessed by comparing the ratios of luciferase activities in lysates of MCF7-RLuc-LC3 and MCF7-RLuc-LC3G120A cells transfected with the indicated siRNAs. BECN1/Beclin 1 and ULK1 siRNAs served as positive controls for autophagy inhibition. (D) Representative immunoblots of the indicated proteins extracted from MCF7 cells transfected with the indicated siRNAs. RPTOR and SQSTM1 siRNAs served as positive controls for enhanced autophagic flux and SQSTM1 immunoblot, respectively, and HSP90 staining was used as a loading control. SQSTM1:HSP90 (upper row) and MAP1LCB3-II:HSP90 (lower row) ratios as a percentage of the ratio in control siRNA-treated cells are shown below. (E) Quantification of fluorescent puncta corresponding to neutral (yellow) and acidic (red) autophagic structures in MCF7-tfLC3 cells transfected with the indicated siRNAs. MCOLN1 (mucolipin 1) and RPTOR/raptor siRNAs served as controls for inhibited and enhanced autophagic flux, respectively. (F) Representative TEM images of MCF7 cells transfected with the indicated siRNAs. Arrowheads indicate elongated phagophores and swollen autophagosomes (open) and lamellar lysosomes (closed). AP, autophagosome; mt, mitochondria; N, nucleus. (G) Quantification of the indicated eGFP-positive membranes in MCF7-eGFP-LC3 cells transfected as indicated, stained for WIPI2 and analyzed by super resolution 3D-SIM. ATG2A/B and RPTOR siRNAs served as controls for disturbed and normal autophagy, respectively. (H and I) Representative confocal images (H) and quantification (I) of autophagic puncta in MCF7-eGFP-LC3 cells transfected with the indicated siRNAs and stained for WIPI2 and ATG16L1. Insert in the _SMPD1_-1 panel is enlarged and individual channels are shown in black and white, and the merged image in color. ATG2A/B siRNA served as a positive control for disturbed maturation of autophagic membranes. (J) Representative confocal images of MCF7 cells transfected with the indicated siRNAs and stained with LC3, WIPI2 and SM. Scale bars: 0.5 µm (F, white), 2 µm (F, black), or 10 µm (H and J). Bars, SD for 3 independent experiments (b,c,e), or a representative (n = 3) quadruplicate experiment (A), or SEM for 5–7 randomly chosen stacks with 2 to 10 cells/stack (G) or for ≥ 18 randomly chosen cells (H). *, P < 0.05; **, P < 0.01; ***, P < 0.001 by the Student t test. See also Fig. S1.
Figure 4.
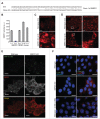
_SMPD1_-deficient MCF7 cells accumulate early autophagic membranes. (A) Sequence of SMPD1 exon1 in wild-type (WT) MCF7 cells and CRISPr-Cas9 clone 2.5. (B) Total SMPD1 activity in lysates of single cell clones of MCF7 cells transfected with SMPD1 guide-RNA. Bars, SD for a representative triplicate experiment. (C) Representative images of clones 2.6 (wild type) and 2.5 (_SMPD1_-KO) stained with 50 nM LysoTracker Red for 5 min were acquired by an epifluorescence microscope using Cellˆp software (Olympus). (D to F) Representative images of wild-type and _SMPD1_-KO MCF7 cells stained for LAMP2 (D), MAP1LC3B (green) and WIPI2 (red) (E), or LGALS3 (green) and LAMP2 (red) (F) were acquired by confocal laser scanning microscope 510 using Zen2009 software (Zeiss). When indicated, cells were treated with 2 mM LLOMe as a positive control for lysosomal membrane permeabilization and LGALS3 puncta formation (F). Scale bars: 20 µm ((C)to F) and 2 µm for inserts in (D).
Figure 5
Altered trafficking of ATG9A in _SMPD1_-deficient cells. (A) NAGLU activities (top), indicated immunoblots (middle) and ATG9A distribution profiles of density gradient fractions of postnuclear supernatant fractions from HC-3 and NPA-3 fibroblasts (bottom). When indicated, HC-3 fibroblasts were starved in HBSS plus 1 g/L glucose and treated with 2 nM ConA for 2 h (S/C). The migration of MAP1LC3B-I and MAP1LC3B-II are marked with a line and greater-than symbol, respectively. ATG9A distribution in fractions is expressed as percentage of the total ATG9A in all fractions as quantified by densitometry and ImageJ software. See figures S2A and B for additional data. (B and C) Representative confocal images of HC-1 and NPA-3 fibroblasts and CRISPr-Cas-9 wild-type (WT) and _SMPD1_-KO (KO) MCF7 cells stained as indicated. When indicated, cells were starved in HBSS plus 1 g/L glucose for 2 h. Step size, 300 nm. See figures S2C and D for additional staining. (D) Manders coefficients for colocalization of TFRC with ATG9A and vice versa (left), and percentages of ATG9A and colocalized ATG9A-TFRC in the juxtanuclear area (4 µm from nucleus) in WT and KO cells. Bars, SEM for 20 randomly chosen cells. (E) Representative immunoblots of the indicated proteins in lysates of WT and KO cells. (F) Quantification of the number of WIPI2 puncta/cell (top) and the percentage of ATG9A-positive WIPI2 puncta of all WIPI2 puncta (bottom) in WT and KO cells. Bars, SEM for 20 randomly chosen cells (top) or 4–10 randomly chosen stacks with 2 to 9 cells/stack (bottom). Representative confocal images are shown in Fig. S2E. (G) Quantification of the number of WIPI2 and MAP1LCB3 puncta in MCF7 _SMPD1_-KO (KO) cells successfully transfected (green) with pN1 vector or pN1-ATG9A plasmids and stained 48 h later for WIPI2 and LC3. Bars, SEM 4 to 8 randomly chosen stacks with 2 to 9 cells/stack. Representative confocal images are shown in Fig. S2F. Scale bars: 10 µm. *, P < 0.05; **, P < 0.01; ***, P < 0.001 by the Student t test.
Figure 6.
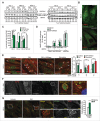
Exogenous SM phenocopies NPA-associated lysosomal and autophagic pathologies. (A) Representative SQSTM1, MAP1LCB3-I and MAP1LCB3-II immunoblots of protein lysates from the indicated fibroblasts left untreated (UT) or treated with DMSO vehicle (V), 3 µM C16-ceramide (Cer) or 39 µM C12-SM (SM) for the indicated times. HSP90 served as a loading control. SQSTM1:HSP90 (upper row) and MAP1LCB3-II:HSP90 (lower row) ratios as a percentage of the ratio in vehicle-treated cells from the same individual are shown below. (B) Representative confocal images of the HC-3 (top) and HC-1 (bottom) fibroblasts treated with 39 µM of BODIPY® C12-SM (green) for 12 h and stained for LAMP2 and WIPI2 (red), respectively. Note juxtanuclear mainly accumulation of BODIPY-FL® C12-SM and lack of colocalization with either LAMP2 or WIPI2. Step size, 1 µm. (C) Lysosomal areas in the indicated fibroblasts treated for 12 h with vehicle (V) or 19.5 or 39 µM C12-SM (SM) were measured with Celigo® adherent cell cytometer after staining with LysoTracker®Red and Hoechst. Bars, SEM for a representative duplicate experiment (n = 3). (D) Quantification of the indicated autophagic membranes in HC-1 cells treated with vehicle or 39 µM C12-SM for 24 h with or without 10 µg/ml bSMase for the last 12 h, stained for WIPI2 and LC3, and analyzed by super resolution 3D-SIM. Bars, SEM for a representative experiment with 4 fields analyzed (n = 3). (E) Representative confocal images of HC-3 control fibroblasts treated and stained as in (D) (left), and quantification of WIPI2 and MAP1LC3B puncta (right; n ≥ 20). HC-3 fibroblasts starved for amino acids by 2 h treatment with HBSS plus 1 g/L glucose served as a positive control. White arrows and arrowheads indicate WIPI2-positive/MAP1LC3B-negative (red) and double-positive (yellow) structures, respectively. Similar data were obtained with fibroblasts from another healthy individual. (F) Representative confocal images of HC-3 fibroblasts treated with 39 µM C12-SM for 24 h and stained for WIPI2 and MAP1LC3B. Close-ups show a typical omegasome- (1) and phagophore membrane (2). (G) Representative confocal images of HC-1 fibroblasts treated with vehicle or 39 µM C12-SM for 12 h and stained for ATG9A and TFRC. Close-ups demonstrate the perinuclear colocalization of ATG9A and TFRC and the histogram shows Manders coefficients for the colocalization. Bars, SEM for minimum 20 randomly chosen cells. C16-SM induced a similar increase in the colocalization of ATG9A and TFRC (Fig. S3). Scale bars: 20 µm (white) or 2 µm (yellow). *, P < 0.05; **, P < 0.01; ***, P < 0.001 by the Student t test.
Figure 7.
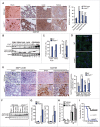
_smpd1_−/− mice have defective autophagic flux and increased sensitivity to renal IR injury. (A) Representative images (left) and quantification (right) of SQSTM1 staining in tissues from wild-type (WT) and _smpd1_−/− mice. (B) Representative SQSTM1 and MAP1LC3B immunoblots of extracts from the tissues in (A). Extracts of WT and _atg5_−/− murine embryonic fibroblasts left untreated or treated with ConA served as controls. HSP90 served as a loading control. (C) Quantification of MAP1LC3B- and WIPI2-puncta positive tubules (>5 puncta/tubule) and WIPI2 puncta/tubule in kidneys from the indicated mice stained for MAP1LC3B and WIPI2 and analyzed by confocal microscopy. Confocal images of MAP1LC3B- and WIPI2-stained kidney sections are shown in Fig. S4. (D) Representative confocal projections of 5-µm thick areas of kidney sections from the indicated mice stained for ATG9A and DNA (Hoechst). (E) Representative images (left) and quantifications (right) of cells with punctuate MAP1LC3B staining and high intensity SQSTM1 immunostainings of paraffin sections of kidneys of the indicated mice exposed to a sham operation or 30 min ischemia followed by a 48 h reperfusion period. (F) Representative MAP1LC3B immunoblot of protein extracts from kidneys of wild-type (WT) and _smpd1_−/− mice exposed to a sham operation or 30 min ischemia followed by a 24 or 48 h reperfusion period (IR). HSP90 served as a loading control. (G) Serum urea (left) and creatinine (right) levels in the indicated mice treated as in (F). (H) Quantification of renal damage scores (right) of paraffin sections of kidneys from mice treated as in (E) and stained with periodic acid-Schiff (PAS) reagent. (I) Kaplan-Meyer survival plots for WT (n=7) and KO (n=6) mice exposed to a sham operation or 35 min renal ischemia followed by a 240-h reperfusion period. Scale bars: 10 µm (D) or 100 µm (A, E). Bars, SD for 4 independent sections (A), SEM for 52 wild-type and 45 _smpd1_−/− kidney tubules (C), or SD for 4 sham-operated mice and 8 (E) or 7 (G, H) IR-treated mice/group. *, P < 0.05; **, P < 0.01; ***, P < 0.001 by the Student t test.
Similar articles
- Atg9A trafficking through the recycling endosomes is required for autophagosome formation.
Imai K, Hao F, Fujita N, Tsuji Y, Oe Y, Araki Y, Hamasaki M, Noda T, Yoshimori T. Imai K, et al. J Cell Sci. 2016 Oct 15;129(20):3781-3791. doi: 10.1242/jcs.196196. Epub 2016 Sep 1. J Cell Sci. 2016. PMID: 27587839 - SNX18 regulates ATG9A trafficking from recycling endosomes by recruiting Dynamin-2.
Søreng K, Munson MJ, Lamb CA, Bjørndal GT, Pankiv S, Carlsson SR, Tooze SA, Simonsen A. Søreng K, et al. EMBO Rep. 2018 Apr;19(4):e44837. doi: 10.15252/embr.201744837. Epub 2018 Feb 7. EMBO Rep. 2018. PMID: 29437695 Free PMC article. - ATG9A shapes the forming autophagosome through Arfaptin 2 and phosphatidylinositol 4-kinase IIIβ.
Judith D, Jefferies HBJ, Boeing S, Frith D, Snijders AP, Tooze SA. Judith D, et al. J Cell Biol. 2019 May 6;218(5):1634-1652. doi: 10.1083/jcb.201901115. Epub 2019 Mar 27. J Cell Biol. 2019. PMID: 30917996 Free PMC article. - Mammalian autophagy and the plasma membrane.
Pavel M, Rubinsztein DC. Pavel M, et al. FEBS J. 2017 Mar;284(5):672-679. doi: 10.1111/febs.13931. Epub 2016 Nov 6. FEBS J. 2017. PMID: 27758042 Review. - Solving the secretory acid sphingomyelinase puzzle: Insights from lysosome-mediated parasite invasion and plasma membrane repair.
Andrews NW. Andrews NW. Cell Microbiol. 2019 Nov;21(11):e13065. doi: 10.1111/cmi.13065. Epub 2019 Jun 10. Cell Microbiol. 2019. PMID: 31155842 Free PMC article. Review.
Cited by
- AP-4 vesicles contribute to spatial control of autophagy via RUSC-dependent peripheral delivery of ATG9A.
Davies AK, Itzhak DN, Edgar JR, Archuleta TL, Hirst J, Jackson LP, Robinson MS, Borner GHH. Davies AK, et al. Nat Commun. 2018 Sep 27;9(1):3958. doi: 10.1038/s41467-018-06172-7. Nat Commun. 2018. PMID: 30262884 Free PMC article. - Atg9 proteins, not so different after all.
Ungermann C, Reggiori F. Ungermann C, et al. Autophagy. 2018;14(8):1456-1459. doi: 10.1080/15548627.2018.1477382. Epub 2018 Jul 23. Autophagy. 2018. PMID: 29966469 Free PMC article. - CPTP: A sphingolipid transfer protein that regulates autophagy and inflammasome activation.
Mishra SK, Gao YG, Deng Y, Chalfant CE, Hinchcliffe EH, Brown RE. Mishra SK, et al. Autophagy. 2018;14(5):862-879. doi: 10.1080/15548627.2017.1393129. Epub 2018 Feb 21. Autophagy. 2018. PMID: 29164996 Free PMC article. - Small but mighty: Atg8s and Rabs in membrane dynamics during autophagy.
Barz S, Kriegenburg F, Sánchez-Martín P, Kraft C. Barz S, et al. Biochim Biophys Acta Mol Cell Res. 2021 Aug;1868(9):119064. doi: 10.1016/j.bbamcr.2021.119064. Epub 2021 May 26. Biochim Biophys Acta Mol Cell Res. 2021. PMID: 34048862 Free PMC article. Review. - Lipid composition of the cancer cell membrane.
Szlasa W, Zendran I, Zalesińska A, Tarek M, Kulbacka J. Szlasa W, et al. J Bioenerg Biomembr. 2020 Oct;52(5):321-342. doi: 10.1007/s10863-020-09846-4. Epub 2020 Jul 26. J Bioenerg Biomembr. 2020. PMID: 32715369 Free PMC article. Review.
References
- He C, Klionsky DJ. Regulation mechanisms and signaling pathways of autophagy. Annu Rev Genet 2009; 43:67-93; PMID:19653858; http://dx.doi.org/10.1146/annurev-genet-102808-114910 - DOI - PMC - PubMed
- Weidberg H, Shvets E, Elazar Z. Biogenesis and Cargo Selectivity of Autophagosomes. Annu Rev Biochem 2011; 80:125-56; PMID:21548784; http://dx.doi.org/10.1146/annurev-biochem-052709-094552 - DOI - PubMed
- Kroemer G, Marino G, Levine B. Autophagy and the integrated stress response. Mol Cell 2010; 40:280-93; PMID:20965422; http://dx.doi.org/10.1016/j.molcel.2010.09.023 - DOI - PMC - PubMed
- Lamb CA, Yoshimori T, Tooze SA. The autophagosome: origins unknown, biogenesis complex. Nat Rev Mol Cell Biol 2013; 14:759-74; PMID:24201109; http://dx.doi.org/10.1038/nrm3696 - DOI - PubMed
- Mizushima N, Yoshimori T, Ohsumi Y. The role of Atg proteins in autophagosome formation. Annual review of cell and developmental biology 2011; 27:107-32; PMID:21801009; http://dx.doi.org/10.1146/annurev-cellbio-092910-154005 - DOI - PubMed
MeSH terms
Substances
LinkOut - more resources
Full Text Sources
Other Literature Sources
Research Materials
Miscellaneous
