Ammonia Induces Autophagy through Dopamine Receptor D3 and MTOR - PubMed (original) (raw)
Ammonia Induces Autophagy through Dopamine Receptor D3 and MTOR
Zhiyuan Li et al. PLoS One. 2016.
Abstract
Hyperammonemia is frequently seen in tumor microenvironments as well as in liver diseases where it can lead to severe brain damage or death. Ammonia induces autophagy, a mechanism that tumor cells may use to protect themselves from external stresses. However, how cells sense ammonia has been unclear. Here we show that culture medium alone containing Glutamine can generate milimolar of ammonia at 37 degrees in the absence of cells. In addition, we reveal that ammonia acts through the G protein-coupled receptor DRD3 (Dopamine receptor D3) to induce autophagy. At the same time, ammonia induces DRD3 degradation, which involves PIK3C3/VPS34-dependent pathways. Ammonia inhibits MTOR (mechanistic target of Rapamycin) activity and localization in cells, which is mediated by DRD3. Therefore, ammonia has dual roles in autophagy: one to induce autophagy through DRD3 and MTOR, the other to increase autophagosomal pH to inhibit autophagic flux. Our study not only adds a new sensing and output pathway for DRD3 that bridges ammonia sensing and autophagy induction, but also provides potential mechanisms for the clinical consequences of hyperammonemia in brain damage, neurodegenerative diseases and tumors.
Conflict of interest statement
Competing Interests: The authors have declared that no competing interests exist.
Figures
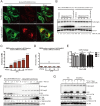
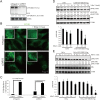
Fig 1. Aged medium and ammonia increase autophagy and cause GFP-DRD3-Flag degradation.
(A) Immunofluorescence shows “aged medium” induces increased GFP-DRD3-Flag localization on autophagosomes. HeLa cells stably expressing GFP-DRD3-Flag were cultured in fresh DMEM medium containing Glutamine or in “aged medium”, which was cultured for a few days. Cells were fixed with -20°C methanol for 5 minutes and stained with anti-Flag or anti-LC3B antibodies. Scale bar, 10 μm. (B) “Old medium” induces free GFP fragment from GFP-DRD3-Flag. HeLa cells stably expressing GFP-DRD3-Flag cells or mCherry-EGFP-LC3 were incubated in culture medium containing Glutamine that had been incubated at 37°C for indicated times in the absence of cells (1–7 days). “Old medium” means a bottle of medium that was inappropriately stored during shipment (left out of refrigerator for at least 10 days). Representative Western blots show the effect of culture medium on GFP fragment from GFP-DRD3-Flag. (C) Cell culture medium containing Glutamine (medium alone, without cells) was stored at 4°C or 37°C for 1–7 days before they were tested for ammonia concentration. (D) Cell culture medium containing GlutaMax (medium alone, without cells) was stored at 4°C or 37°C for 1–7 days before they were tested for ammonia concentration. ***p<0.005. ns, not significant. (E) CCK-8 assays measure the effects of ammonia on cell vitality. HeLa cells stably expressing GFP-DRD3-Flag were cultured in the presence of 0, 1, 5 10 mM of ammonia for 1, 2 or 3 days before they were tested by CCK-8 assays. (F) Ammonia induces free GFP fragment from GFP-DRD3-Flag. HeLa cells stably expressing GFP-DRD3-Flag or GFP-LC3-Flag cells were cultured in different concentrations of NH4Cl for 24 hours. Representative Western blots are shown. (G) “Old medium” containing Glutamax does not induce free GFP fragment from GFP-DRD3-Flag unless ammonia was added. HeLa-GFP-DRD3-Flag cells were incubated in culture medium containing Glutamine or GlutaMAX that had been incubated in 37°C or 4°C for 5 days. NH4Cl was added for 24 hours before cells were harvested and processed for Western blots. Representative Western blots are shown. Densitometric analysis was performed and quantification results were labeled below the corresponding blots.
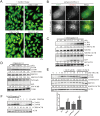
Fig 2. Ammonia has dual functions in autophagy regulation.
(A) Acridine orange staining shows that 5–10 mM of NH4Cl increase the vesicular pH in cells. HeLa cells were treated with 5μg/ml Acridine Orange at 37°C for 15 minutes and washed with PBS. Then cells were treated with different concentrations of NH4Cl for 10 minutes before fluorescent microscope acquisition excited at 488 nm. (B) Live cell imaging shows ammonia increases both autophagosomes number and their pH. HeLa-mCherry-EGFP-LC3 cells were treated with 5 mM ammonium chloride for 2 hours before they were imaged. Scale bar, 10 μm. (C, D) Autophagy inhibitor increases SQSTM1/p62 while autophagy inducer decreases SQSTM1/p62. HeLa cells stably expressing GFP-DRD3-Flag were incubated with increasing concentrations of (C) Chloroquine, (D) Rapamycin, before cells were harvested and processed for Western blots. (E, F) NH4Cl induces autophagy. (E) HeLa cells stably expressing GFP-DRD3-Flag were incubated with increasing concentrations of NH4Cl for 6 hours with or without Chloroquine or Bafilomycin A1 for 3 hours. Representative Western blots are shown. Quantification of LC3BII/internal control from three independent experiments is shown on the bottom. *p<0.05, **p<0.01. (F) HeLa cells stably expressing GFP-DRD3-Flag were incubated with increasing concentrations of NH4Cl for 6 hours with or without E-64d/Pepstatin A for 7 hours. Representative Western blots are shown. Densitometric analysis was performed and quantification results were labeled below the corresponding blots.
Fig 3. PIK3C3/VPS34 plays important roles in ammonia-induced GFP-DRD3-Flag degradation and GFP fragment accumulation.
(A) HeLa-GFP-DRD3-Flag cells were transfected with 80 nM Negative or PIK3C3/VPS34 siRNAs for 72 hours and treated with 10 mM NH4Cl for 24 hours before they were fixed and stained with anti-Flag antibodies. Scale bar: 10 μm. (B) Inhibition of PIK3C3/VPS34 prevents free GFP fragment generation from GFP-DRD3-Flag. HeLa-GFP-DRD3-Flag cells were treated with NH4Cl and VPS34-IN1 for 24 hours before cells were harvested and processed for Western blots. Representative Western blots are shown. (C) Quantification of relative GFP fragment amount in (B). Data show mean ± s.d. n = 3. *p<0.05. Representative Western blots are shown. Densitometric analysis was performed and quantification results were labeled below the corresponding blots.
Fig 4. Ammonia, but not starvation or Bafilomycin A1, enriches DRD3 on autophagosomes.
(A) NH4Cl induces DRD3 enrichment on autophagosomes. HeLa cells stably expressing GFP-DRD3-FLAG were incubated in control medium or in medium containing 10 mM NH4Cl for 24 hours before they were fixed and stained with anti-Flag (green) and anti-LC3B (red). The inset shows the enlarged view of the corresponding boxed regions in NH4Cl-treated cells. Scale bar, 10 μm. (B) HeLa cells stably expressing GFP-DRD3-FLAG were treated with Bafilomycin A1, EBSS or EBSS combined with Bafilomycin A1 for 2 hours before fixing with -20°C methanol and staining with anti-Flag or anti-LC3B antibodies. Scale bar, 10 μm. (C) Bafilomycin A1 induces much less GFP fragment from GFP-DRD3-Flag than NH4Cl does. HeLa cells stably expressing GFP-DRD3-Flag were treated with different concentrations of NH4Cl or Bafilomycin A1 for 24 hours. Cells were harvested for Western blots. Representative results are shown in the Figures. Densitometric analysis was performed and quantification results were labeled below the corresponding blots.
Fig 5. Ammonia does not enrich membrane protein EGFR on autophagosomes.
(A) EGFR internalizes upon EGF addition. HeLa cells were treated with or without 10 mM NH4Cl for 24 hours before they were pulsed and chased with EGF-Alexa 555 (red). Cells were fixed in 4% formaldehyde and stained with anti-EGFR antibody (green). (B) NH4Cl does not induce EGFR enrichment on autophagosomes. HeLa cells were treated with or without 10 mM NH4Cl for 24 hours before they were fixed in -20°C methanol and stained with anti-EGFR (green) and LC3 (red) antibodies. Representative images are shown. The inset shows the enlarged view of the corresponding boxed region in NH4Cl-treated cell. (C) HeLa cells stably expressing GFP-DRD3-FLAG were incubated in control medium or in medium containing 10 mM NH4Cl for 24 hours before they were fixed in -20°C methanol and stained with anti-Flag (green) and anti-EGFR (red) antibodies. Scale bar, 10 μm.
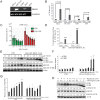
Fig 6. DRD3 is an ammonia sensor.
(A) Semi-quantitative Reverse-Transcription PCR to compare the relative mRNA level in HeLa, HCT116, CHO and 293T cells. Last lane shows RT-PCR result using ddH2O as template. Human and Chinese Hamster DRD3 and GAPDH sequences were aligned to design primers that match DRD3 and GAPDH in both human and Chinese Hamster. (B) Different cells have different autophagy responses to ammonia. HeLa, HCT116, CHO and 293T cells were treated with 5 mM NH4Cl for 24 hours before they were fixed and stained with anti-LC3B antibody. Quantification of LC3B puncta in HeLa, HCT116, CHO and 293T cells are shown. Fifty cells were counted for LC3B puncta in three independent experiments. (C) Transfected GFP-DRD3-Flag responds to ammonia in a traditional GPCR assay. cAMP-Glo experiment using CHO, or CHO cells that stably express GFP-DRD3-Flag to measure the effects of ammonia on cAMP levels in cells. (D) Quantification of LC3 puncta in CHO, or CHO cells that stably express GFP-DRD3-Flag before and after NH4Cl treatment. Fifty cells were counted for LC3B puncta. n = 3. (E) Transfected GFP-DRD3-Flag increases autophagy response to ammonia. Representative Western blots of CHO, or CHO cells that stably express GFP-DRD3-Flag treated with different concentrations of NH4Cl for 24 hours. (F) Quantification of LC3BI and LC3BII in (E) from three independent results. Data were all normalized to LC3BII control in CHO cells. (G) Quantification of the relative level of SQSTM1/p62 in (E) from three independent results. Data were all normalized to control in CHO cells. For (F) and (G), **p<0.01, ***p<0.005. Data show mean ± s.d. n = 3. (H) Adding both autophagy inducer and inhibitor counteracts on SQSTM1/p62. HeLa cells stably expressing GFP-DRD3-Flag cells were incubated with increasing concentrations of Chloroquine and/or Rapamycin for 6 hours. Representative Western blots are shown. Densitometric analysis was performed and quantification results were labeled below the corresponding blots.
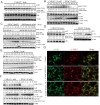
Fig 7. Ammonia inhibits MTOR activity and affects its localization.
(A-F) Ammonia inhibits MTOR activity in cells. (A) Representative Western blots analyze MTOR activity in HeLa cells stably expressing GFP-DRD3-Flag treated with different concentrations of ammonia for 1h. (B) Representative Western blots analyze MTOR activity in HeLa cells stably expressing GFP-DRD3-Flag treated with 2.5 mM or 5 mM ammonia for 5 min to 4 h. (C) Representative Western blots analyze MTOR activity in HeLa cells stably expressing GFP-DRD3-Flag treated with different concentrations of ammonia or Bafilomycin A1 for 1 h. (D) Representative Western blots analyze MTOR activity in HeLa cells stably expressing GFP-DRD3-Flag treated with different concentrations of ammonia for 24 h. (E) Representative Western blots analyze MTOR activity in HeLa cells stably expressing GFP-DRD3-Flag treated with 3 mM ammonia for 2 min to 24 h. (F) Representative Western blots analyze MTOR activity in HeLa cells stably expressing GFP-DRD3-Flag treated with 5 mM or 10 mM ammonia for 30 min to 6 h. (G) Ammonia reduces MTOR localization on lysosomes. Immunofluorescence of HCT116 cells treated with 10 mM NH4Cl for 1 hour or 24 hours. Cells were fixed with 4% formaldehyde at room temperature for 20 minutes and immunostained with anti-MTOR and anti-LAMP1(H4A3) antibodies. Scale bar, 10 μm. n = 3. Representative Western blots are shown. Densitometric analysis was performed and quantification results were labeled below the corresponding blots.
Fig 8. DRD3 mediates ammonia-induced MTOR localization change and autophagy induction.
(A) Representative Western blots show that DRD3 RNAi efficiently knockdown DRD3. HeLa cells stably expressing GFP-DRD3-Flag were treated with 40 nM Negative or DRD3 siRNA for 3 days. Samples were loaded in duplicate for verification. Anti-GFP and anti-Tubulin were used. (B) Immunofluorescence shows that DRD3 RNAi abolishes ammonia-induced MTOR localization changes. HeLa cells were incubated with 40 nM Negative or DRD3 siRNA for 3 days before they were treated with 10 mM NH4Cl for 1 hour. Cells were fixed and stained with anti-MTOR. Scale bar, 10 μm. (C) Quantification of LC3B dots in HeLa cells treated with Negative or DRD3 siRNA and treated with 10 mM NH4Cl for 24 hours. Fifty cells were counted for their LC3B dots. n = 3. (D, E) DRD3 mediates ammonia-induced MTOR activity inhibition. (D) CHO versus CHO-GFP-DRD3-Flag cells were treated with NH4Cl for 0.5–1 hour before they were harvested for Western blots using anti-pS6K, anti-S6K and anti-Tubulin antibodies. Quantifications show the relative value of pS6K/S6K, normalized to CHO cells with no ammonia addition. Data show mean ± s.d. n = 3. (E) HeLa versus HeLa-GFP-DRD3-Flag cells were treated with different concentrations of NH4Cl for 0.5–1 hour before they were harvested for Western blots using anti-pS6K, anti-S6K and anti-Tubulin antibodies. Quantifications show the relative value of pS6K/S6K, normalized to HeLa cells with no ammonia addition. Data show mean ± s.d. n = 3. Representative Western blots are shown. Densitometric analysis was performed and quantification results were labeled below the corresponding blots.
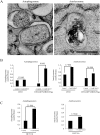
Fig 9. Electron Microscopy of autophagosomes and autolysosomes in cells expressing different levels of DRD3.
(A) Representative electron microscopic images of two autophagosomes (AP, left panel) and an autolysosome (AL, right panel). Scale bar: 500 nm. (B) Quantification of autophagosomes and autolysosomes in CHO cells and CHO cells overexpressing GFP-DRD3-Flag. (C) Quantification of autophagosomes and autolysosomes in HCT116 cells. Results represent mean value of 15–25 random cell images per experimental group.
Fig 10. A model illustrates the roles of ammonia in autophagy regulation.
Our data show that ammonia has dual roles in autophagy. One is to induce autophagy through Dopamine receptor D3 and MTOR, the other is to inhibit autophagic flux by perturbing vesicle pH. At the same time, it also enriches DRD3 on autophagosomes for degradation.
Similar articles
- Dopamine Receptor Subtypes Differentially Regulate Autophagy.
Wang D, Ji X, Liu J, Li Z, Zhang X. Wang D, et al. Int J Mol Sci. 2018 May 22;19(5):1540. doi: 10.3390/ijms19051540. Int J Mol Sci. 2018. PMID: 29786666 Free PMC article. - SAR405, a PIK3C3/Vps34 inhibitor that prevents autophagy and synergizes with MTOR inhibition in tumor cells.
Pasquier B. Pasquier B. Autophagy. 2015 Apr 3;11(4):725-6. doi: 10.1080/15548627.2015.1033601. Autophagy. 2015. PMID: 25905679 Free PMC article. - Vps34 and PLD1 take center stage in nutrient signaling: their dual roles in regulating autophagy.
Yoon MS. Yoon MS. Cell Commun Signal. 2015 Nov 21;13:44. doi: 10.1186/s12964-015-0122-x. Cell Commun Signal. 2015. PMID: 26589724 Free PMC article. Review. - MTOR, PIK3C3, and autophagy: Signaling the beginning from the end.
Munson MJ, Ganley IG. Munson MJ, et al. Autophagy. 2015;11(12):2375-6. doi: 10.1080/15548627.2015.1106668. Autophagy. 2015. PMID: 26565689 Free PMC article. Review. - Dual PI-3 kinase/mTOR inhibition impairs autophagy flux and induces cell death independent of apoptosis and necroptosis.
Button RW, Vincent JH, Strang CJ, Luo S. Button RW, et al. Oncotarget. 2016 Feb 2;7(5):5157-75. doi: 10.18632/oncotarget.6986. Oncotarget. 2016. PMID: 26814436 Free PMC article.
Cited by
- ULK1-ATG13 and their mitotic phospho-regulation by CDK1 connect autophagy to cell cycle.
Li Z, Tian X, Ji X, Wang J, Chen H, Wang D, Zhang X. Li Z, et al. PLoS Biol. 2020 Jun 9;18(6):e3000288. doi: 10.1371/journal.pbio.3000288. eCollection 2020 Jun. PLoS Biol. 2020. PMID: 32516310 Free PMC article. - Dopamine receptor D3 is related to prognosis in human hepatocellular carcinoma and inhibits tumor growth.
Yan Y, Chen Y, Pan J, Xing W, Li Q, Wang Y, Gei L, Yuan Y, Xie J, Zeng W, Chen D. Yan Y, et al. BMC Cancer. 2022 Dec 2;22(1):1248. doi: 10.1186/s12885-022-10368-y. BMC Cancer. 2022. PMID: 36456906 Free PMC article. - Autophagic flux is highly active in early mitosis and differentially regulated throughout the cell cycle.
Li Z, Ji X, Wang D, Liu J, Zhang X. Li Z, et al. Oncotarget. 2016 Jun 28;7(26):39705-39718. doi: 10.18632/oncotarget.9451. Oncotarget. 2016. PMID: 27213594 Free PMC article. - Sirtuin 5 alleviates apoptosis and autophagy stimulated by ammonium chloride in bovine mammary epithelial cells.
He J, Feng L, Yang H, Gao S, Dong J, Lu G, Liu L, Zhang X, Zhong K, Guo S, Zha G, Han L, Li H, Wang Y. He J, et al. Exp Ther Med. 2024 May 22;28(1):295. doi: 10.3892/etm.2024.12584. eCollection 2024 Jul. Exp Ther Med. 2024. PMID: 38827477 Free PMC article. - Hepatic encephalopathy is linked to alterations of autophagic flux in astrocytes.
Lu K, Zimmermann M, Görg B, Bidmon HJ, Biermann B, Klöcker N, Häussinger D, Reichert AS. Lu K, et al. EBioMedicine. 2019 Oct;48:539-553. doi: 10.1016/j.ebiom.2019.09.058. Epub 2019 Oct 21. EBioMedicine. 2019. PMID: 31648987 Free PMC article.
References
- Rose C, Felipo V (2005) Limited capacity for ammonia removal by brain in chronic liver failure: potential role of nitric oxide. Metab Brain Dis 20: 275–283. - PubMed
- Ott P, Larsen FS (2004) Blood-brain barrier permeability to ammonia in liver failure: a critical reappraisal. Neurochem Int 44: 185–198. - PubMed
Publication types
MeSH terms
Substances
Grants and funding
This work was supported by Chinese Academy of Sciences “Hundred Talent program” and National Natural Science Foundation of China (Project No.31301112) to Xin Zhang. The funders had no role in study design, data collection and analysis, decision to publish, or preparation of the manuscript.
LinkOut - more resources
Full Text Sources
Other Literature Sources
Miscellaneous
