ABHD5/CGI-58, the Chanarin-Dorfman Syndrome Protein, Mobilises Lipid Stores for Hepatitis C Virus Production - PubMed (original) (raw)
ABHD5/CGI-58, the Chanarin-Dorfman Syndrome Protein, Mobilises Lipid Stores for Hepatitis C Virus Production
Gabrielle Vieyres et al. PLoS Pathog. 2016.
Abstract
Hepatitis C virus (HCV) particles closely mimic human very-low-density lipoproteins (VLDL) to evade humoral immunity and to facilitate cell entry. However, the principles that govern HCV association with VLDL components are poorly defined. Using an siRNA screen, we identified ABHD5 (α/β hydrolase domain containing protein 5, also known as CGI-58) as a new host factor promoting both virus assembly and release. ABHD5 associated with lipid droplets and triggered their hydrolysis. Importantly, ABHD5 Chanarin-Dorfman syndrome mutants responsible for a rare lipid storage disorder in humans were mislocalised, and unable to consume lipid droplets or support HCV production. Additional ABHD5 mutagenesis revealed a novel tribasic motif that does not influence subcellular localization but determines both ABHD5 lipolytic and proviral properties. These results indicate that HCV taps into the lipid droplet triglyceride reservoir usurping ABHD5 lipase cofactor function. They also suggest that the resulting lipid flux, normally devoted to VLDL synthesis, also participates in the assembly and release of the HCV lipo-viro-particle. Altogether, our study provides the first association between the Chanarin-Dorfman syndrome protein and an infectious disease and sheds light on the hepatic manifestations of this rare genetic disorder as well as on HCV morphogenesis.
Conflict of interest statement
The authors have declared that no competing interests exist.
Figures
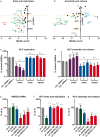
Fig 1. Identification of ABHD5 as a new host factor for HCV production.
(a, b) A rational siRNA screen was designed to identify host factors involved in the lipid metabolism and participating in the HCV replication cycle (see S2 Fig) with readouts for HCV entry and replication (a) or assembly and release (b). For each graph, the p-value is plotted against the median score. A maximal p-value of 0.05 together with a mean score superior to 2 (blue dots, antiviral factors) or inferior to -2 (green dots, proviral factors) was considered highly significant. CD81, PI4KA and APOE controls are shown in red in the relevant graph and the non-targeting negative control siRNAs in grey. ABHD5 is depicted with a diamond. Yellow dotted lines indicate our statistical thresholds. (c, d) ABHD5-specific siRNAs used in the initial screen as a pool (panels a and b) were transfected individually into HCV RNA-transfected cells. Their specific effect on HCV RNA replication (panel c, corrected for cell viability effects) and progeny virion production (panel d, corrected for HCV RNA replication effects) is depicted after normalisation to the average value of two non-targeting siRNAs. Note that statistics were performed at the gene level. (e- g) Effect of ABHD5-specific shRNAs on ABHD5 gene expression (e), HCV entry and replication (f) and HCV assembly and release (g). (e) ABHD5 mRNA levels were quantified by qRT-PCR at the time of virus harvest. (f) HCV entry and replication were determined by the RLuc activity in the producer cell lysates at the same time point and corrected for the effects on cell viability. (g) The efficiency of HCV production was evaluated by the RLuc activity in target cells infected with the supernatant of shRNA-transduced and JcR-2a-infected producer cells, and corrected for the shRNA effects on HCV entry and replication.
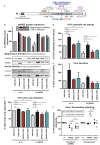
Fig 2. ABHD5, but not the Chanarin-Dorfman syndrome mutants, supports both HCV assembly and release.
(a) Functional and structural organisation of ABHD5. Below are indicated the consensus sequences for the esterase/lipase motif (GXNXG, in green), and for the predicted NLS (in blue), phosphorylation sites (in red) and LPAAT motif (HX4D, in purple). Note that the replacement of the nucleophilic serine in the typical GXSXG lipase motif by an asparagine prevents any hydrolase activity. The predicted hydrolase pseudo-catalytic triad [16] includes residues N153, H327, and E260 or D301. The lipid droplet-binding domain is defined according to Gruber et al. [40]. The mutations used in this study are shown on top of the schema with a color code corresponding to their targeted motif. Those mutations associated with the Chanarin-Dorfman syndrome (Q130P, E260K) are underlined. (b-e) Irrelevant (sh irr) or ABHD5-specific shRNAs (sh ABHD5) were transduced into cells together with shRNA-resistant wild-type or mutant ABHD5 (Q130P or E260K), or with an empty vector (pWPI-BLR). After 4 days, the cells were infected with JcR-2a for 72 h before transferring the supernatant onto target cells. (b) ABHD5 expression was detected by Western blot at the beginning (96h post-transduction) and at the end of HCV infection (72 h post-infection, corresponding to 7 days post-transduction). Detection of β-tubulin served as an internal control for protein load. A representative Western blot is presented in the bottom panel while the top panel depicts the quantification of ABHD5 expression, normalised for β-tubulin expression and for the mock-treated cells (sh irr and pWPI-BLR transduction) and averaged over 3 independent experiments. (c-e) In the same set of experiments as in panel b, HCV replication, progeny virion production and core secretion were analysed. Note that the mild effects of ABHD5 expression on HCV entry and replication in this assay are probably due to the late time point chosen (72h post-infection) where virus spread and re-infection starts affecting the readout. (f) Infectious titres were determined in the supernatants (extracellular infectivity) as well as in the cleared freeze-and-thaw lysates (intracellular infectivity) of infected cells with manipulated ABHD5 or ApoE expression.
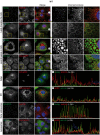
Fig 3. Subcellular localisation of ABHD5.
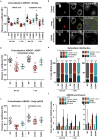
Lunet N hCD81 cells expressing HA-tagged ABHD5 were stained for the HA epitope as well as for diverse organelles (LD (Bodipy or ADRP), _trans_-Golgi (p230), ER (calnexin), early endosomes (EEIA), lysosomes (Lamp1)) and counterstained with Dapi. In each panel, representative pictures are shown on the left part. For the colocalisation analysis with the lipid droplet markers Bodipy and ADRP, a portion of the image highlighted with a yellow square is magnified on the right side and depicted in the different channels in the same order. Moreover, for the same pictures, the intensity profile of the different dyes along the dotted line in the merged picture is shown in the lower right quarter and labelled with a Roman number.
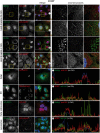
Fig 4. Subcellular localisation of ABHD5 Q130P Chanarin-Dorfman mutant.
Lunet N hCD81 cells expressing HA-tagged Q130P mutant were stained and depicted as in Fig 3. Note that data for the E260K mutant is gathered in S4 Fig.
Fig 5. ABHD5 mutants accumulate in the nucleus and poorly associate with lipid droplets.
Experimental details and representative immunofluorescence pictures are to be found in Figs 3, 4 and S4. For each analysis, the data were averaged over 2 independent experiments and at least 10 (ADRP, Bodipy) or 7 frames (Golgi) per experiment. (a-c) Pearson’s correlation coefficient (Rr) between HA-tagged ABHD5 and lipid droplet (a, b) or _trans_-Golgi markers (c) were calculated on the whole cells or specifically on the cytoplasm, as indicated. Note that the correlation with the ADRP marker was restricted to the cytoplasmic signal to prevent the bias that would have been caused by the diffuse, non-LD-associated, nuclear ADRP signal. Each dot corresponds to one frame. (d-f) Analysis of relative ABHD5 subcellular distribution and enrichment. (d) Cell segmentation strategy: example for the lipid droplet and nucleus segmentation. Within a multichannel picture (Dapi, Bodipy, HA-tagged ABHD5), nuclei and lipid droplets were automatically identified in the respective channels as objects. The lipid droplet periphery was extrapolated as rings of constant thickness around each individual LD. Based on this automated object identification, the ABHD5 signal was then segmented into its nuclear, cytoplasmic and LD-associated fractions. Total and mean intensities in the different cell compartments were measured and normalised to the total or mean ABHD5 intensity in the whole cell, giving the subcellular distribution and enrichment of ABHD5 across these compartments, respectively. A similar strategy was used for the Golgi segmentation (Dapi, p230, HA-tagged ABHD5 triple staining). (e) Subcellular distribution of ABHD5. Left panel: The total ABHD5 signal in the nucleus, at the lipid droplet periphery (LD “rings”) and in the rest of the cytoplasm was quantified and normalised to the total ABHD5 signal. The percentage of LD-associated ABHD5 is indicated on top of each bar. Right panel: A similar analysis was performed on cells stained for the Golgi apparatus instead of the lipid droplets. The percentage of Golgi-associated ABHD5 is indicated on top of each bar. (f) Subcellular enrichment of ABHD5. Left panel: The mean ABHD5 signal intensity in the nucleus, at the lipid droplet periphery (LD “rings”) and in the rest of the cytoplasm was quantified and normalised for the mean ABHD5 signal intensity in the whole cell (set to 1 and highlighted with a dotted horizontal line). Right panel: A similar analysis was performed on cells stained for the Golgi apparatus instead of the lipid droplets.
Fig 6. ABHD5 expression regulates the lipid droplet content of the hepatoma cells.
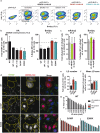
(a-c) FACS readout. (a) Representative FACS plots for the overexpression setup. Lunet N hCD81 cells were mock-transduced (pWPI-BLR) or transduced with an HA-tagged ABHD5 construct. Mock- and ABHD5-transduced cells were mixed and stained for their lipid droplets with the Bodipy dye (FL1, x axis) and for ABHD5 overexpression with an anti-HA antibody (FL4, y axis). Fluorescence at the single cell level was analysed by FACS. The first plot shows the mock-transduced cells alone. The other six plots depict ABHD5-overexpressing cells mixed with mock-transduced cells, which serve each time as an internal reference. The ABHD5-overexpressing cells (top clouds of cells) can easily be distinguished by the HA epitope staining (FL4, y axis). Note, specifically for the wild-type-expressing cells (plots 2 to 4), the shift in the top cloud shape towards lower Bodipy intensities (FL1, x axis). To reach similar expression levels as compared to the ABHD5 mutants, wild-type ABHD5 construct was transduced with undiluted, 3 fold- or 10 fold-diluted lentiviruses. (b) For each ABHD5 construct, the level of ABHD5 overexpression (left panel) was estimated by the HA mean fluorescence intensity (MFI) of the HA-positive cell population (top cloud of cells) relative to the MFI of the HA-negative cell population (bottom cloud). The lipid droplet content of ABHD5-overexpressing cells (right panel) was estimated by the Bodipy MFI of the HA-positive cells after normalisation with the Bodipy MFI of the HA-negative cells. (c) Knockdown setup. In this setup, cells were transduced simultaneously with the indicated shRNA (sh irr, sh ABHD5, or sh ApoE) and an mRuby2-expressing construct. As in the overexpression setup, each cell population was mixed with mock-transduced cells (irrelevant shRNA + empty pWPI-Puro vector), which served as an internal reference. The expression of mRuby2 allowed distinguishing the 2 cell populations. The mixed cell populations were also stained with Bodipy to assess their lipid droplet content. The fold increase in mRuby2 expression between the shRNA- and mRuby2-transduced cells on one hand and the mock-transduced cells on the other hand is depicted in the left panel. The effect of the shRNA on the lipid droplet content (right panel) was assessed by normalising the Bodipy MFI of the mRuby2-positive cells by the MFI of the mock-transduced cells. (b, c) Averages and standard deviations were calculated over 3 independent experiments. (d-g) Microscopy readout. (d) Representative immunofluorescence pictures. Lunet N hCD81 cells expressing HA-tagged ABHD5 were mixed together with mock-transduced cells and reseeded on coverslips. The next day, cells were fixed and stained for the HA epitope (ABHD5 overexpression), lipid droplets (Bodipy) and nuclei (Dapi). The outline of ABHD5-overexpressing cells was drawn manually and is shown in yellow. Each picture was taken to contain both HA-positive and HA-negative cells so that the mock-transduced cells can serve as an internal control for the subsequent quantifications. (e) Lipid droplet number. Note that in each frame, the number of lipid droplets in HA-negative and HA-positive cell populations was normalised for the total nuclear area of the respective population, as a substitute for the whole cell area. (f) Mean lipid droplet area. (e, f) In each condition (WT / Q130P / E260K), the lipid droplet number and mean area were normalised for those calculated in the mock-transduced cells detected in the same frames. (g) Lipid droplet size distribution. Individual lipid droplets in HA-negative and HA-positive cells were classified in groups depending on their size. For each frame, the number of lipid droplets per size group was normalised by the total number of lipid droplets in the relevant cell population. Note that a lower diameter cut-off value of 2 pixels was used for the lipid droplet identification, so that lipid droplets with an area of less than 3.14 pixels are not detected. For space reasons, the axis labels in the 2 lower panels were not duplicated but are similar as for the WT. (e-g) Averages and standard deviations were calculated over 3 independent experiments and 10 frames per experiment.
Fig 7. Mapping of ABHD5 determinants responsible for ABHD5 function in lipid metabolism and role in HCV virion production.
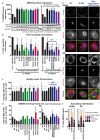
ABHD5 functional domains were dissected with a panel of mutants targeting its lipase motif (green), putative NLS (blue), phosphorylation sites (red) and LPAAT motifs (purple) (see Fig 2a). All mutants were cloned with a C-terminal double HA tag. Some mutants were also combined with the Q130P CDS mutation to test for compensatory effects. (a) ABHD5 expression was detected by Western blot at the time of virus harvest with an anti-ABHD5 antibody and with the anti-HA tag antibody. Detection of β-tubulin served as an internal control for protein load. Note that the detection was performed with the Odyssey system, with anti-ABHD5 antibody detected in one channel and both anti-HA and anti-β-tubulin antibodies in the second channel. A representative Western blot is presented in the bottom of each panel while the top part depicts the quantification of ABHD5 expression, normalised for β-tubulin expression and for the mock-treated cells (sh irr and pWPI-BLR transduction) and averaged over the 5 (left panel) or 3 (right panel) independent rescue experiments. Note that in the right panel, the two constructs harbouring a triple mutation of the tribasic motif could not be detected with the anti-ABHD5 antibody. Their expression was therefore measured with the HA tag staining and calculated relatively to the expression of the HA-tagged wild-type construct. (b) Progeny virion production was analysed in the same set of experiments as in panel a (5 or 3 independent experiments for the left and right panels, respectively). Statistically significant differences were tested by comparing the overexpression of the different mutants with the knockdown control (second bar). (c, d) The lipolytic activity of the HA-tagged ABHD5 mutants was analysed by overexpression and with the FACS-based assay described in Fig 6a. Normalised Bodipy signals are plotted in (c) as percentages and the fold increases in HA epitope detection over background are depicted in (d). As in Fig 6, serial dilutions of the WT ABHD5 lentiviruses were included so as to reach expression levels similar to the least expressed mutants. Data show the averages over 3 independent experiments. (e) Lunet N hCD81 cells expressing the HA-tagged ABHD5 TBLC motif mutant or the wild-type or CDS controls were fixed and stained for the HA epitope as well as lipid droplets (Bodipy) and the Golgi (p230) and counterstained with Dapi. Representative pictures of two independent experiments are shown. (f) The subcellular distribution of ABHD5 was analysed as in Fig 5 (but with quadruple staining pictures) for the mutants depicted in panel e, in absence or presence of oleic acid. The numbers on top of each bar correspond to the percentage of LD-associated ABHD5. The data correspond to the average of 2 independent experiments with 10 frames per experiment and construct. (e, f) Note that the complete set of representative immunofluorescence pictures and quantified data covering the entire panel of mutants is available in S10–S12 Figs.
Similar articles
- The ATGL lipase cooperates with ABHD5 to mobilize lipids for hepatitis C virus assembly.
Vieyres G, Reichert I, Carpentier A, Vondran FWR, Pietschmann T. Vieyres G, et al. PLoS Pathog. 2020 Jun 15;16(6):e1008554. doi: 10.1371/journal.ppat.1008554. eCollection 2020 Jun. PLoS Pathog. 2020. PMID: 32542055 Free PMC article. - Molecular mechanism of the ichthyosis pathology of Chanarin-Dorfman syndrome: Stimulation of PNPLA1-catalyzed ω-O-acylceramide production by ABHD5.
Ohno Y, Nara A, Nakamichi S, Kihara A. Ohno Y, et al. J Dermatol Sci. 2018 Dec;92(3):245-253. doi: 10.1016/j.jdermsci.2018.11.005. Epub 2018 Nov 20. J Dermatol Sci. 2018. PMID: 30527376 - Critical roles for α/β hydrolase domain 5 (ABHD5)/comparative gene identification-58 (CGI-58) at the lipid droplet interface and beyond.
Brown AL, Mark Brown J. Brown AL, et al. Biochim Biophys Acta Mol Cell Biol Lipids. 2017 Oct;1862(10 Pt B):1233-1241. doi: 10.1016/j.bbalip.2017.07.016. Epub 2017 Aug 4. Biochim Biophys Acta Mol Cell Biol Lipids. 2017. PMID: 28827091 Free PMC article. Review. - An exceptional mutational event leading to Chanarin-Dorfman syndrome in a large consanguineous family.
Samuelov L, Fuchs-Telem D, Sarig O, Sprecher E. Samuelov L, et al. Br J Dermatol. 2011 Jun;164(6):1390-2. doi: 10.1111/j.1365-2133.2011.10252.x. Epub 2011 May 13. Br J Dermatol. 2011. PMID: 21332462 - The important role of epidermal triacylglycerol metabolism for maintenance of the skin permeability barrier function.
Radner FP, Fischer J. Radner FP, et al. Biochim Biophys Acta. 2014 Mar;1841(3):409-15. doi: 10.1016/j.bbalip.2013.07.013. Epub 2013 Aug 6. Biochim Biophys Acta. 2014. PMID: 23928127 Review.
Cited by
- CGI-58: Versatile Regulator of Intracellular Lipid Droplet Homeostasis.
Yu L, Li Y, Grisé A, Wang H. Yu L, et al. Adv Exp Med Biol. 2020;1276:197-222. doi: 10.1007/978-981-15-6082-8_13. Adv Exp Med Biol. 2020. PMID: 32705602 Free PMC article. Review. - Lipolysis: cellular mechanisms for lipid mobilization from fat stores.
Grabner GF, Xie H, Schweiger M, Zechner R. Grabner GF, et al. Nat Metab. 2021 Nov;3(11):1445-1465. doi: 10.1038/s42255-021-00493-6. Epub 2021 Nov 19. Nat Metab. 2021. PMID: 34799702 Review. - Molecular Basis of ABHD5 Lipolysis Activation.
Sanders MA, Zhang H, Mladenovic L, Tseng YY, Granneman JG. Sanders MA, et al. Sci Rep. 2017 Feb 17;7:42589. doi: 10.1038/srep42589. Sci Rep. 2017. PMID: 28211464 Free PMC article. - Sequence analysis and structure prediction of ABHD16A and the roles of the ABHD family members in human disease.
Xu J, Gu W, Ji K, Xu Z, Zhu H, Zheng W. Xu J, et al. Open Biol. 2018 May;8(5):180017. doi: 10.1098/rsob.180017. Open Biol. 2018. PMID: 29794032 Free PMC article. Review. - The ATGL lipase cooperates with ABHD5 to mobilize lipids for hepatitis C virus assembly.
Vieyres G, Reichert I, Carpentier A, Vondran FWR, Pietschmann T. Vieyres G, et al. PLoS Pathog. 2020 Jun 15;16(6):e1008554. doi: 10.1371/journal.ppat.1008554. eCollection 2020 Jun. PLoS Pathog. 2020. PMID: 32542055 Free PMC article.
References
- Global Burden of Disease Study 2013 Collaborators (2015) Global, regional, and national incidence, prevalence, and years lived with disability for 301 acute and chronic diseases and injuries in 188 countries, 1990–2013: a systematic analysis for the Global Burden of Disease Study 2013. Lancet 386: 743–800. 10.1016/S0140-6736(15)60692-4 - DOI - PMC - PubMed
- Brown RS (2005) Hepatitis C and liver transplantation. Nature 436: 973–978. - PubMed
- Thomssen R, Bonk S, Thiele A (1993) Density heterogeneities of hepatitis C virus in human sera due to the binding of beta-lipoproteins and immunoglobulins. Med Microbiol Immunol 182: 329–334. - PubMed
Publication types
MeSH terms
Substances
Supplementary concepts
LinkOut - more resources
Full Text Sources
Other Literature Sources
Medical
