Ethanol-mediated activation of the NLRP3 inflammasome in iPS cells and iPS cells-derived neural progenitor cells - PubMed (original) (raw)
Ethanol-mediated activation of the NLRP3 inflammasome in iPS cells and iPS cells-derived neural progenitor cells
Lidia De Filippis et al. Mol Brain. 2016.
Abstract
Background: Alcohol abuse produces an enormous impact on health, society, and the economy. Currently, there are very limited therapies available, largely due to the poor understanding of mechanisms underlying alcohol use disorders (AUDs) in humans. Oxidative damage of mitochondria and cellular proteins aggravates the progression of neuroinflammation and neurological disorders initiated by alcohol abuse.
Results: Here we show that ethanol exposure causes neuroinflammation in both human induced pluripotent stem (iPS) cells and human neural progenitor cells (NPCs). Ethanol exposure for 24 hours or 7 days does not affect the proliferation of iPS cells and NPCs, but primes an innate immune-like response by activating the NLR family pyrin domain containing 3 (NLRP3) inflammasome pathway. This leads to an increase of microtubule-associated protein 1A/1B-light chain 3(+) (LC3B(+)) autophagic puncta and impairment of the mitochondrial and lysosomal distribution. In addition, a decrease of mature neurons derived from differentiating NPCs is evident in ethanol pre-exposed compared to control NPCs. Moreover, a second insult of a pro-inflammatory factor in addition to ethanol preexposure enhances innate cellular inflammation in human iPS cells.
Conclusions: This study provides strong evidence that neuronal inflammation contributes to the pathophysiology of AUDs through the activation of the inflammasome pathway in human cellular models.
Keywords: Alcohol use disorders; Disease modeling; Human induced pluripotent stem cells; Neuroinflammation; Stem cells.
Figures
Fig. 1
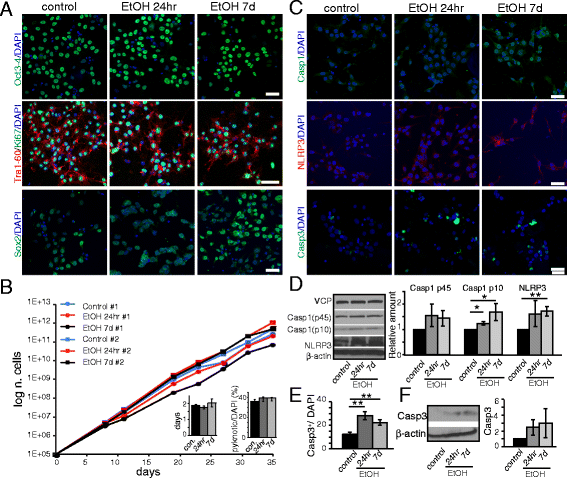
Ethanol activates the inflammasome pathway in iPS cells. iPS cells were cultured in 70 mM ethanol for 24hr or 7d. a From the top: Immunofluorescence analysis by confocal microscopy shows the expression of pluripotency markers Oct3-4, Tra-1-60, Sox2, and of the proliferation marker Ki-67 in iPS cells after 24hr or 7d ethanol exposure. Scale bar: 50 μm. b Growth curve of iPS cell lines #1 and #2. Inserts: showing the doubling time (days in vitro) (left), and the relative percentage of pyknotic nuclei over total DAPI+ nuclei (right). c Confocal microscopy images showing the expression of the apoptotic marker, Cleaved Caspase-3 (Casp3) and of the inflammasome-related markers, Caspase-1 (Casp1) and NLRP3. Scale bars: 50 μm. d Western Blot analysis and graph showing the relative densitometric analysis of expression of the inflammasome-pathway markers Casp1 (p45 and p10) and NLRP3. Quantification of the proteins was normalized to β-actin expression. e Graph showing the relative percentage of Casp3+ cells over the total number of DAPI+ cell nuclei. f Western Blot analysis of Casp3 expression
Fig. 2
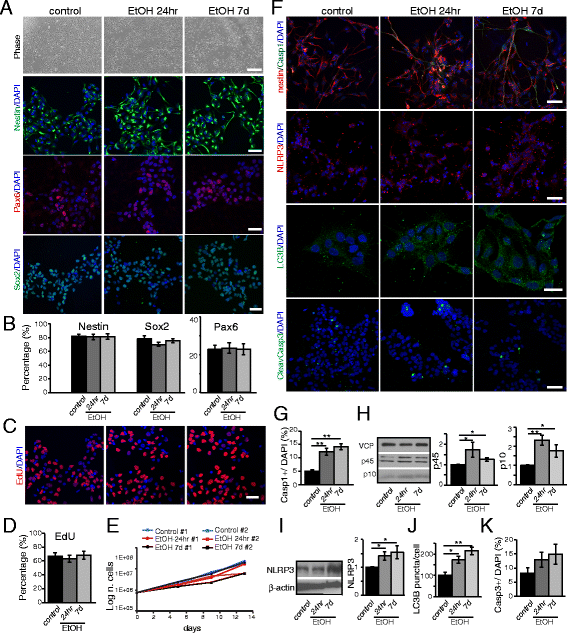
Ethanol activates the inflammasome pathway in NPCs. NPCs were obtained from iPS cells by epigenetic neural induction and treated with ethanol for 24hr or 7d. a From the top: phase contrast pictures show that the cell density between the different treatments is comparable at day 7. Scale bar: 200 μm. Immunofluorescence analysis by confocal microscopy shows the expression of neural multipotency markers Nestin, Pax6, and Sox2 in NPCs. Scale bar: 50 μm. b Graphs showing the relative percentage of Nestin+, Pax6+ and Sox2+ cells over the total number of DAPI+ nuclei. c Fluorescent images of EdU+ nuclei after incorporation assay for 24hr at day 7 of ethanol exposure. Scale bar: 50 μm. d Graph showing the relative percentage of EdU+ cells over the total number of DAPI+ nuclei. e Growth curve of NPC lines #1 and #2 after acute or chronic ethanol exposure. f Immunofluorescence analysis by confocal microscopy shows the expression of the inflammasome markers Casp1 and NLRP3, autophagy marker LC3B, and of the apoptotic marker Casp3 in NPCs with or without ethanol exposure (24hr or 7d). Scale bar: 20 & 50 μm (LC3B). g Graph showing the relative percentage of Casp1+ cells over the total number of DAPI+ nuclei. h Western Blot and graph showing the relative densitometric analysis of Casp1 (p45 and p10) expression. Quantification of relative protein expression normalized to VCP expression. i Western Blot and graph showing the relative densitometric analysis of NLRP3 expression. Protein quantification was normalized to β-actin. j Graph showing the relative percentage of LC3B puncta per cell. k Graph showing the relative percentage of Casp3+ cells over the total number of DAPI+ nuclei. The differences among all the values were not statistically significant unless indicated (* p ≤ 0.05, ** p ≤ 0.01, *** p ≤ 0.001). Student’s _t_-test was utilized for all experiments
Fig. 3
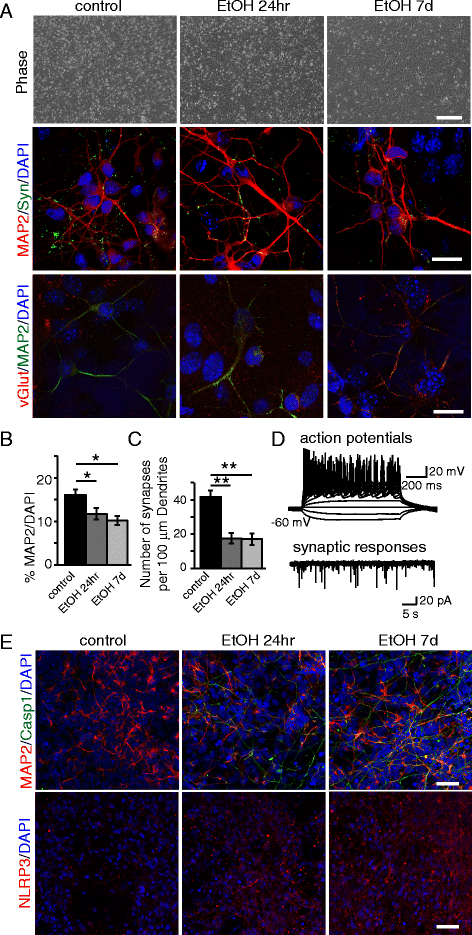
Early ethanol exposure leads to a decrease of NPC-derived neurons. NPCs were pretreated with ethanol for 24hr or 7d and differentiated to neurons for 26 days. a Phase contrast pictures of treated and untreated NPCs after 7 days of differentiation toward the neuronal lineage, and immunofluorescence analysis of neurons differentiated from NPCs showing the synaptic marker synapsin, and glutamatergic marker vGlut. Scale bars: 200 μm (top), 10 μm (middle, bottom). b Graph showing the relative percentage of MAP2+ cells over the total number of DAPI+ nuclei. c Number of synapses quantified by synapsin+ puncta per 100 μm dendrite length under control or ethanol pre-exposure conditions. d Electrophysiological analysis. e Immunofluorescence analysis showing the expression of Casp1, MAP2, and NLRP3. Scale bar: 50 μm. The differences among all the values were not statistically significant unless indicated (* p ≤ 0.05, ** p ≤ 0.01, *** p ≤ 0.001). Student’s _t_-test was utilized for all experiments
Fig. 4
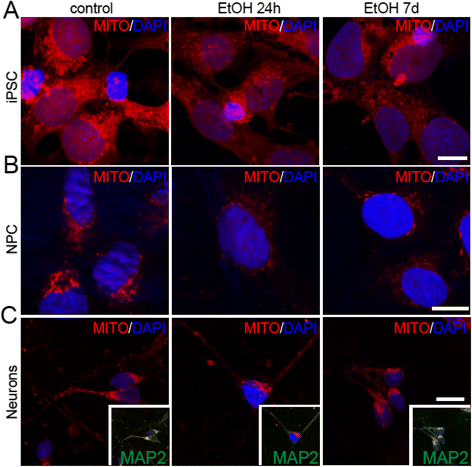
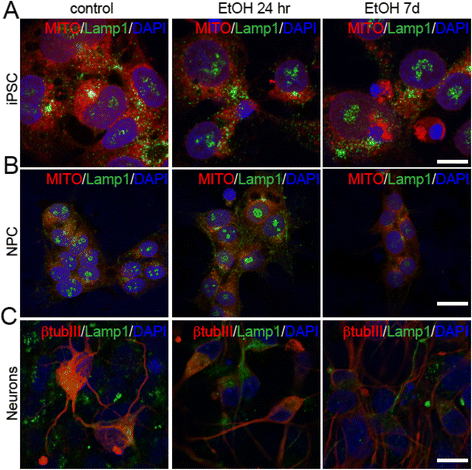
Ethanol alters mitochondrial patterns in iPS cells, NPCs, and NPC-derived neurons. Confocal microscopy images showing the mitochondrial pattern (Mitotracker) in iPS cells (a), NPCs (b), and NPC-derived neurons (after 26 days of differentiation) (c) after treatment with ethanol for 24hr or 7d. Nuclei (in blue) are counterstained with DAPI. Inserts: co-immunolabeling with MAP2 shows different colocalization of Mitotracker in neuronal cells. Scale bars: 10 μm
Fig. 5
Ethanol alters lysosomal patterns in iPS cells, NPCs, and NPC-derived neurons. Analysis of co-localization of the lysosomal marker Lamp1 with Mitotracker in iPS cells (a) and NPCs (b) after 24hr or 7d treatment with ethanol, and co-localization of Lamp1 with β-tubulinIII in untreated and treated NPC-derived neurons (c). Scale bars: 10 μm (a), 20 μm (b and c)
Fig. 6
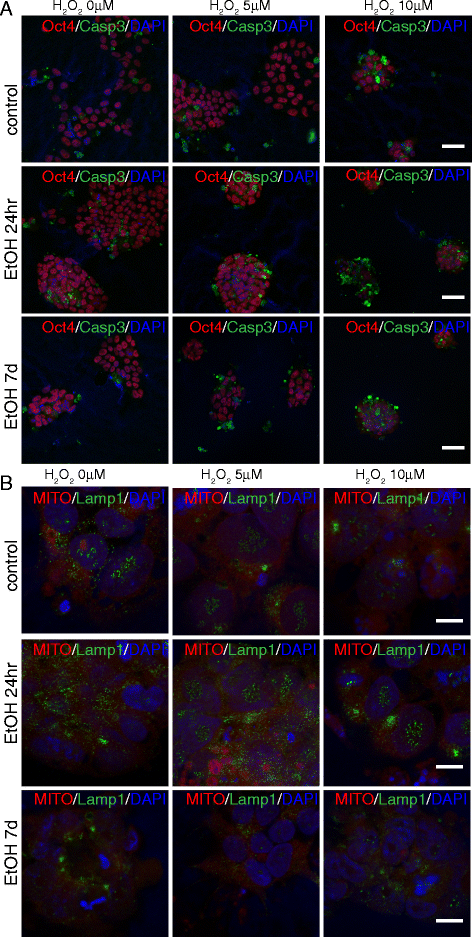
Cooperative effects of ethanol and peroxide challenges on apoptosis and lysosomal/mitochondrial distribution. At day 7 after exposure to ethanol for 24hr or 7d, iPS cells were exposed for 14hr to 5 or 10 μM H2O2 and immunostained with antibodies against Oct4 and Casp3 (a), or stained with Mitotracker™ and Lamp1 (b). Both single treatments with ethanol and H2O2 alter the normal patterns of the cell, but a remarkable enhancement of the effects observed following a single challenge is evident following a double challenge. Scale bars: 50 μm (a), 10 μm (b)
Fig. 7
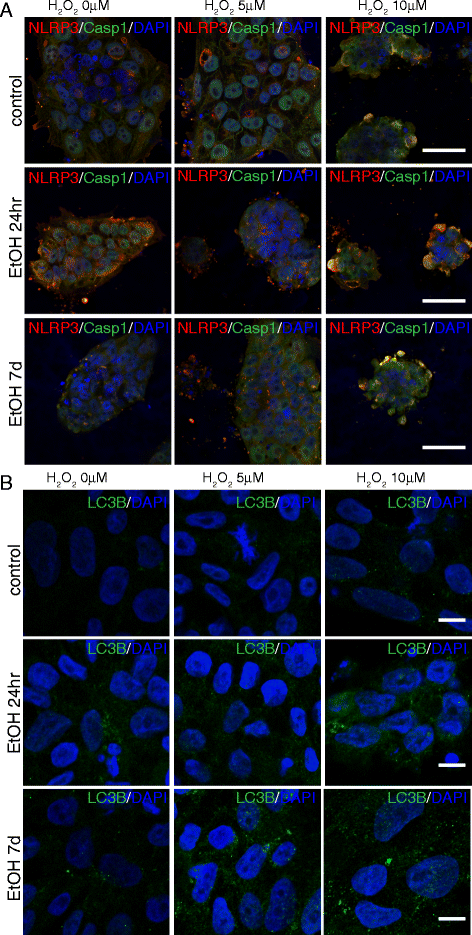
Cooperative effects of ethanol and peroxide challenges on inflammasome markers NLRP3 and Casp1 in iPS cells. On day 7 following 24hr or 7d ethanol treatment, iPS cells were exposed for 14hr to 5 or 10μM H2O2 and immunostained with antibodies against NLRP3 and Casp1 (a), and LC3B (b). At 10μM H2O2, iPS cells pretreated with ethanol for 7d displayed a dramatic increase in death. Scale bars: 50 μm (a), 10μm (b)
Fig. 8
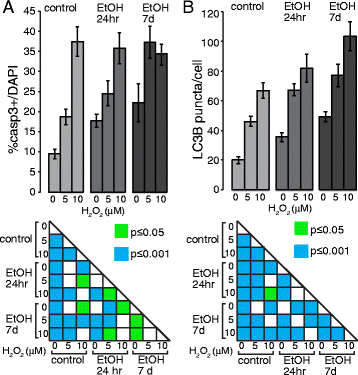
Cooperative effects of ethanol and peroxide challenges on Casp3+ cells and LC3B puncta in iPS cells. a Graph showing the relative percentages of Casp3+ cells over the total number of DAPI+ nuclei. _Low panel_s: Statistical significance was indicated. b Graph showing the relative percentages of LC3B puncta per cell. _Low panel_s: Statistical significance was indicated. Student’s _t_-test was utilized for all experiments
Fig. 9
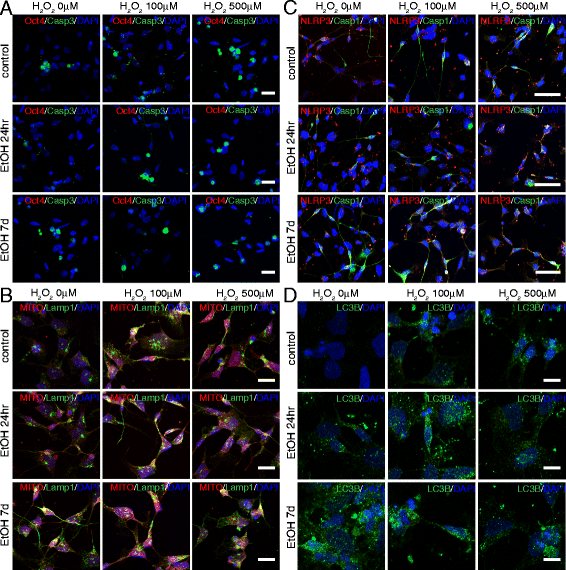
Cooperative effects of ethanol and peroxide challenges in NPCs. At day 7 after exposure to ethanol for 24hr or 7d, NPCs were exposed for 14hr to 100 or 500 μM H2O2 and immunostained with antibodies against Oct4 and Casp3 (a), NLRP3 and Casp1 (c), and LC3B (d), or stained with Mitotracker and Lamp1 (b). Both single treatments with ethanol and H2O2 alter the normal patterns of the cell, but a remarkable enhancement of the single effects is evident by the concurrence of the two treatments. Scale bars: 50 μm (a–c), 10 μm (b–d)
Similar articles
- Inflammasome activation by mitochondrial oxidative stress in macrophages leads to the development of angiotensin II-induced aortic aneurysm.
Usui F, Shirasuna K, Kimura H, Tatsumi K, Kawashima A, Karasawa T, Yoshimura K, Aoki H, Tsutsui H, Noda T, Sagara J, Taniguchi S, Takahashi M. Usui F, et al. Arterioscler Thromb Vasc Biol. 2015 Jan;35(1):127-36. doi: 10.1161/ATVBAHA.114.303763. Epub 2014 Nov 6. Arterioscler Thromb Vasc Biol. 2015. PMID: 25378412 - Silver Nanoparticle-Induced Autophagic-Lysosomal Disruption and NLRP3-Inflammasome Activation in HepG2 Cells Is Size-Dependent.
Mishra AR, Zheng J, Tang X, Goering PL. Mishra AR, et al. Toxicol Sci. 2016 Apr;150(2):473-87. doi: 10.1093/toxsci/kfw011. Epub 2016 Jan 21. Toxicol Sci. 2016. PMID: 26801583 - A novel human model of the neurodegenerative disease GM1 gangliosidosis using induced pluripotent stem cells demonstrates inflammasome activation.
Son MY, Kwak JE, Seol B, Lee DY, Jeon H, Cho YS. Son MY, et al. J Pathol. 2015 Sep;237(1):98-110. doi: 10.1002/path.4551. Epub 2015 May 26. J Pathol. 2015. PMID: 25925601 - Regulation and Function of the Nucleotide Binding Domain Leucine-Rich Repeat-Containing Receptor, Pyrin Domain-Containing-3 Inflammasome in Lung Disease.
Lee S, Suh GY, Ryter SW, Choi AM. Lee S, et al. Am J Respir Cell Mol Biol. 2016 Feb;54(2):151-60. doi: 10.1165/rcmb.2015-0231TR. Am J Respir Cell Mol Biol. 2016. PMID: 26418144 Free PMC article. Review. - Initiation and perpetuation of NLRP3 inflammasome activation and assembly.
Elliott EI, Sutterwala FS. Elliott EI, et al. Immunol Rev. 2015 May;265(1):35-52. doi: 10.1111/imr.12286. Immunol Rev. 2015. PMID: 25879282 Free PMC article. Review.
Cited by
- Using human stem cells as a model system to understand the neural mechanisms of alcohol use disorders: Current status and outlook.
Scarnati MS, Halikere A, Pang ZP. Scarnati MS, et al. Alcohol. 2019 Feb;74:83-93. doi: 10.1016/j.alcohol.2018.03.008. Epub 2018 Mar 31. Alcohol. 2019. PMID: 30087005 Free PMC article. Review. - 5. Collaborative Study on the Genetics of Alcoholism: Functional genomics.
Gameiro-Ros I, Popova D, Prytkova I, Pang ZP, Liu Y, Dick D, Bucholz KK, Agrawal A, Porjesz B, Goate AM, Xuei X, Kamarajan C; COGA Collaborators; Tischfield JA, Edenberg HJ, Slesinger PA, Hart RP. Gameiro-Ros I, et al. Genes Brain Behav. 2023 Oct;22(5):e12855. doi: 10.1111/gbb.12855. Epub 2023 Aug 2. Genes Brain Behav. 2023. PMID: 37533187 Free PMC article. Review. - Mental health dished up-the use of iPSC models in neuropsychiatric research.
McNeill RV, Ziegler GC, Radtke F, Nieberler M, Lesch KP, Kittel-Schneider S. McNeill RV, et al. J Neural Transm (Vienna). 2020 Nov;127(11):1547-1568. doi: 10.1007/s00702-020-02197-9. Epub 2020 May 7. J Neural Transm (Vienna). 2020. PMID: 32377792 Free PMC article. Review. - Neural Stem Cells from Shank3-ko Mouse Model Autism Spectrum Disorders.
Grasselli C, Carbone A, Panelli P, Giambra V, Bossi M, Mazzoccoli G, De Filippis L. Grasselli C, et al. Mol Neurobiol. 2020 Mar;57(3):1502-1515. doi: 10.1007/s12035-019-01811-6. Epub 2019 Nov 26. Mol Neurobiol. 2020. PMID: 31773410 - Inflammasome in drug abuse.
Xu E, Liu J, Wang X, Xiong H. Xu E, et al. Int J Physiol Pathophysiol Pharmacol. 2017 Dec 25;9(6):165-177. eCollection 2017. Int J Physiol Pathophysiol Pharmacol. 2017. PMID: 29348793 Free PMC article.
References
- Tingling JD, Bake S, Holgate R, Rawlings J, Nagsuk PP, Chandrasekharan J, Schneider SL, Miranda RC. CD24 expression identifies teratogen-sensitive fetal neural stem cell subpopulations: evidence from developmental ethanol exposure and orthotopic cell transfer models. PLoS One. 2013;8:e69560. doi: 10.1371/journal.pone.0069560. - DOI - PMC - PubMed
MeSH terms
Substances
Grants and funding
- F31 NS084551/NS/NINDS NIH HHS/United States
- F31 AA024033/AA/NIAAA NIH HHS/United States
- R21 DA035594/DA/NIDA NIH HHS/United States
- R01 AA023797/AA/NIAAA NIH HHS/United States
- R21 DA039686/DA/NIDA NIH HHS/United States
LinkOut - more resources
Full Text Sources
Other Literature Sources
Research Materials
