TFEB and TFE3 cooperate in the regulation of the innate immune response in activated macrophages - PubMed (original) (raw)
TFEB and TFE3 cooperate in the regulation of the innate immune response in activated macrophages
Nunzia Pastore et al. Autophagy. 2016.
Abstract
The activation of transcription factors is critical to ensure an effective defense against pathogens. In this study we identify a critical and complementary role of the transcription factors TFEB and TFE3 in innate immune response. By using a combination of chromatin immunoprecipitation, CRISPR-Cas9-mediated genome-editing technology, and in vivo models, we determined that TFEB and TFE3 collaborate with each other in activated macrophages and microglia to promote efficient autophagy induction, increased lysosomal biogenesis, and transcriptional upregulation of numerous proinflammatory cytokines. Furthermore, secretion of key mediators of the inflammatory response (CSF2, IL1B, IL2, and IL27), macrophage differentiation (CSF1), and macrophage infiltration and migration to sites of inflammation (CCL2) was significantly reduced in TFEB and TFE3 deficient cells. These new insights provide us with a deeper understanding of the transcriptional regulation of the innate immune response.
Keywords: Tfe3; Tfeb; autophagy; immune response; macrophages.
Figures
Figure 1.
Induction of TFE3 nuclear translocation in macrophages. (A) RAW 264.7 macrophages starved for 2 h in EBSS display rapid redistribution of TFE3 from the cytosol to nucleus. Scale bar: 10 µm. (B) RAW 264.7 macrophages treated with LPS exhibit a slow and sustained redistribution of TFE3 from the cytosol to nucleus. Nuclear localization peaks by 24 h and is maintained up to 48 h after treatment. Scale bar: 10 µm. (C) Quantification of TFE3 nuclear translocation from panels (Aand B). Treatment with Torin-1 for 3 h served as a positive control for nuclear translocation. *** denotes P value < 0.001 by one-way ANOVA analysis (n = 4, >300 cells per trial). (D) Nuclear-cytoplasmic fractionation of TFE3 and TFEB in Raw 264.7 macrophages. Western blots indicating total TFE3 and TFEB levels in whole cell lysates as well cytosolic/membrane fractions and nuclear fractions. TFE3 is undetectable in the nuclei of untreated cells. Starvation in EBSS for 2 h or treatment with Torin-1 for 3 h induces an increase in TFE3 detectable in the nuclear fraction whereas LPS treatment from 6 to 48 h induces a relatively lower level of nuclear TFE3. Histone H3 serves as specific marker of nuclear fraction. (E) Mouse primary bone marrow macrophages exhibit redistribution of TFE3 from the cytosol to nucleus in response to LPS stimulation. TFE3 translocates to the nucleus by 6 h and is sustained for up to 48 h. Scale bar: 5 µm. (F) Quantification of TFE3 nuclear translocation from panel (E). *** denotes P value < 0.001, and **< 0.01 by one-way ANOVA analysis (n = 3, >390 cells per trial).
Figure 2.
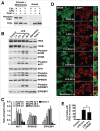
Mechanistic analysis of TFE3 nuclear translocation induced by macrophage activation. (A) Immunoblots of TFE3-Ser321 phosphorylation state in nuclear and cytosolic fractions of RAW 264.7 cells incubated with DMSO (Ctrl.), LPS (24 h), or Torin-1 (2 h). (B) Representative western blots of RAW 264.7 cells treated with LPS for 1, 6, 24 and 48 h. Starvation with EBSS and treatment with Torin-1 were used as positive controls for MTORC1 inhibition. (C) Quantification of 2 independent experiments from (B). (D) MTOR and LAMP1 colocalization in RAW 264.7 macrophages treated with DMSO (Control) or LPS for 1, 6, 24 and 48 h. Starvation with EBSS serves as a positive control of the inactivation and dissociation of MTOR from lysosomal membranes. Insets are 2.6-fold magnification of the selected areas. Scale bars: 10 µm. (E) PPP3/calcineurin inhibition reduces TFE3 nuclear localization in RAW 264.7 macrophages treated with LPS. Pretreatment of cells with the PPP3/calcineurin inhibitor, FK506, reduces the number of cells with nuclear TFE3 after 24 h LPS treatment. * denotes P value < 0.05 by one-way ANOVA analysis (n = 3, > 470 cells per trial).
Figure 3.
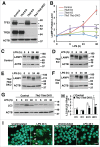
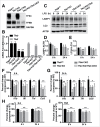
TFE3 and TFEB promote lysosome biogenesis and autophagosome formation in RAW 264.7 macrophages in response to LPS treatment. (A) RAW 264.7 macrophage Tfe3 KO, Tfeb KO and Tfe3 Tfeb double knockout (DKO) clones generated using CRISPR-Cas9 lentiviral transduction. Western blots of individual clones indicate the specificity of the KO cells. * indicates nonspecific cross-reacting band. (B) Relative LAMP1 protein levels quantified from western blots in panels C to F. LAMP1 levels normalized to actin loading control for each experiment. * denotes statistical significance, **** indicates highly significant result compared to control as determined by 2-way ANOVA with the Tukey multiple comparisons test. ((C)to F) Representative western blots of LAMP1 protein levels induced by (C) control, (D) Tfe3 KO, (E) Tfe3 Tfeb DKO, and (F) Tfeb KO clones of RAW 264.7 macrophages treated with LPS for 6 to 48 h. (G) Representative western blot of LC3-I and LC3-II levels in control and Tfe3 Tfeb DKO RAW 264.7 macrophages treated with LPS for 6 to 24 h. (H) Autophagosome formation in control and Tfe3 Tfeb DKO RAW 264.7 macrophages. Quantified by measuring ratio between LC3-II and LC3-I. * denotes P value < 0.05, and ** < 0.01 by the 2-tailed Student t test (n = 3). (I) Control, but not Tfe3 Tfeb DKO RAW 264.7 macrophages undergo distinct morphological changes in response to LPS treatment. Control cells treated with LPS for 48 h exhibit adherent and spread out cell borders and the presence of syncitia along with vacuoles and expanded LAMP1 positive structures (arrows). Scale bar: 10 µm.
Figure 4.
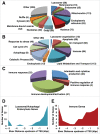
ChIP-seq analysis of TFE3 in LPS-stimulated RAW 264.7 cells. (A to C) GO analysis of the TFE3 binding sites. Numbers in parenthesis indicate the number of TFE3 targets. (A) Categories associated with “cellular compartment.” (B) Categories associated with “biological process.” (C) Categories associated with immune function. (D) Distribution of TFE3 binding sites in lysosomal, autophagy and endocytosis genes. Putative TFE3 binding sites tend to be concentrated within −1000 bp relative to the TSS. (E) Distribution of TFE3 binding sites in immune genes. Putative TFE3 binding sites were concentrated within −1500 bp or greater than −5000 bp relative to the TSS.
Figure 5.
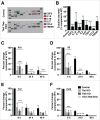
TFE3 and TFEB are required for cytokine production and secretion. (A) Cytokine array blots for control and Tfe3 Tfeb DKO RAW 264.7 cells that were stimulated with LPS for 24 h. Cytokine and chemokine levels of the supernatant were detected using the Mouse Cytokine Array Assay kit (R&D Systems) following manufacturer's protocol. (B) Quantification of cytokine and chemokine levels (n = 3). (Cto F) Relative Quantitative Real-Time PCR analysis of (C) Il1b, (D) Il6, (E) Tnf, and (F) Ccl5 mRNA transcript levels in control, Tfe3 KO, Tfeb KO, Tfe3 Tfeb DKO RAW cell lines after 6, 24, and 48 h of LPS stimulation (n = 3). The P values were calculated by the 2-tailed Student t test analysis of each mutant cell line vs. the control cells. **, P ≤ 0.01; ***, P ≤ 0.001; ****, P ≤ 0.0001.
Figure 6.
TFE3 and TFEB are involved in the immune response in BMDM. (A) Protein levels of TFE3 and TFEB in control and KO BMDM cells. (B) mRNA transcript levels of Tfe3 and Tfeb in BMDM cells. (C) Representative western blot of LAMP1 and LC3 in control and KO BMDM cells treated with LPS for 6 to 24 h and (Dand E) relative quantifications. (Fand G) Cytokines mRNA levels in KO BMDM cells treated with LPS 6 to 24 h compared to control LPS-treated cells. (H) Secreted IL6 and (I) TNF levels in BMDM after 6 to 24 h of LPS treatment. The P values were calculated by the 2-tailed Student t test analysis of each genotype vs. the control cells. **, P ≤ 0.01; ***, P ≤ 0.001.
Figure 7.
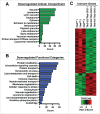
Expression profiling of stimulated Tfe3 KO/Tfeb CKO BMDM compared to _Tfeb_fl/fl control. (Ato C) GO analysis of microarray data from Tfe3 KO/Tfeb CKO BMDM treated with LPS for 24 h. (A) “Cellular compartment” categories. (B) “Biological processes” categories. (C) “Immune Genes” category.
Figure 8.
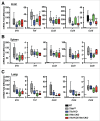
Cytokine and chemokine expression in vivo. (Ato C) Relative quantitative analysis of cytokines and chemokines in (A) liver, (B) spleen, and (C) lung from _Tfeb_fl/fl, Tfe3 KO, Tfeb CKO, or Tfe3 KO/Tfeb CKO mice after 4 h LPS treatment. n = 6 to 15. NT indicates nontreated control cells. The P values were calculated by the 2-tailed Student t test analysis of each genotype vs. the control cells. *, P ≤ 0.05; **, P ≤ 0.01; ***, P ≤ 0.001.
Similar articles
- The Transcription Factors TFEB and TFE3 Link the FLCN-AMPK Signaling Axis to Innate Immune Response and Pathogen Resistance.
El-Houjeiri L, Possik E, Vijayaraghavan T, Paquette M, Martina JA, Kazan JM, Ma EH, Jones R, Blanchette P, Puertollano R, Pause A. El-Houjeiri L, et al. Cell Rep. 2019 Mar 26;26(13):3613-3628.e6. doi: 10.1016/j.celrep.2019.02.102. Cell Rep. 2019. PMID: 30917316 Free PMC article. - A stress response p38 MAP kinase inhibitor SB202190 promoted TFEB/TFE3-dependent autophagy and lysosomal biogenesis independent of p38.
Yang C, Zhu Z, Tong BC, Iyaswamy A, Xie WJ, Zhu Y, Sreenivasmurthy SG, Senthilkumar K, Cheung KH, Song JX, Zhang HJ, Li M. Yang C, et al. Redox Biol. 2020 May;32:101445. doi: 10.1016/j.redox.2020.101445. Epub 2020 Jan 28. Redox Biol. 2020. PMID: 32037305 Free PMC article. - Biogenesis of the Spacious _Coxiella_-Containing Vacuole Depends on Host Transcription Factors TFEB and TFE3.
Padmanabhan B, Fielden LF, Hachani A, Newton P, Thomas DR, Cho HJ, Khoo CA, Stojanovski D, Roy CR, Scott NE, Newton HJ. Padmanabhan B, et al. Infect Immun. 2020 Feb 20;88(3):e00534-19. doi: 10.1128/IAI.00534-19. Print 2020 Feb 20. Infect Immun. 2020. PMID: 31818957 Free PMC article. - Emerging roles for TFEB in the immune response and inflammation.
Brady OA, Martina JA, Puertollano R. Brady OA, et al. Autophagy. 2018;14(2):181-189. doi: 10.1080/15548627.2017.1313943. Epub 2017 Jul 24. Autophagy. 2018. PMID: 28738171 Free PMC article. Review. - TFEB at a glance.
Napolitano G, Ballabio A. Napolitano G, et al. J Cell Sci. 2016 Jul 1;129(13):2475-81. doi: 10.1242/jcs.146365. Epub 2016 Jun 1. J Cell Sci. 2016. PMID: 27252382 Free PMC article. Review.
Cited by
- The phagosomal solute transporter SLC15A4 promotes inflammasome activity via mTORC1 signaling and autophagy restraint in dendritic cells.
López-Haber C, Netting DJ, Hutchins Z, Ma X, Hamilton KE, Mantegazza AR. López-Haber C, et al. EMBO J. 2022 Oct 17;41(20):e111161. doi: 10.15252/embj.2022111161. Epub 2022 Aug 29. EMBO J. 2022. PMID: 36031853 Free PMC article. - Ceramide-Induced Lysosomal Biogenesis and Exocytosis in Early-Onset Preeclampsia Promotes Exosomal Release of SMPD1 Causing Endothelial Dysfunction.
Ermini L, Farrell A, Alahari S, Ausman J, Park C, Sallais J, Melland-Smith M, Porter T, Edson M, Nevo O, Litvack M, Post M, Caniggia I. Ermini L, et al. Front Cell Dev Biol. 2021 May 4;9:652651. doi: 10.3389/fcell.2021.652651. eCollection 2021. Front Cell Dev Biol. 2021. PMID: 34017832 Free PMC article. - The FACT complex facilitates expression of lysosomal and antioxidant genes through binding to TFEB and TFE3.
Jeong E, Martina JA, Contreras PS, Lee J, Puertollano R. Jeong E, et al. Autophagy. 2022 Oct;18(10):2333-2349. doi: 10.1080/15548627.2022.2029671. Epub 2022 Mar 1. Autophagy. 2022. PMID: 35230915 Free PMC article. - Research Hotspots and Trends Analysis of TFEB: A Bibliometric and Scientometric Analysis.
Zhou R, Lin X, Liu D, Li Z, Zeng J, Lin X, Liang X. Zhou R, et al. Front Mol Neurosci. 2022 Apr 21;15:854954. doi: 10.3389/fnmol.2022.854954. eCollection 2022. Front Mol Neurosci. 2022. PMID: 35531069 Free PMC article. - Phosphorylation of EIF2S1 (eukaryotic translation initiation factor 2 subunit alpha) is indispensable for nuclear translocation of TFEB and TFE3 during ER stress.
Dang TT, Kim MJ, Lee YY, Le HT, Kim KH, Nam S, Hyun SH, Kim HL, Chung SW, Chung HT, Jho EH, Yoshida H, Kim K, Park CY, Lee MS, Back SH. Dang TT, et al. Autophagy. 2023 Jul;19(7):2111-2142. doi: 10.1080/15548627.2023.2173900. Epub 2023 Feb 9. Autophagy. 2023. PMID: 36719671 Free PMC article.
References
- Luzio JP, Hackmann Y, Dieckmann NMG, Griffiths GM. The biogenesis of lysosomes and lysosome-related organelles. Cold Spring Harb Perspect Biol 2014; 6:a016840; PMID:25183830; http://dx.doi.org/10.1101/cshperspect.a016840 - DOI - PMC - PubMed
- Sun-Wada GH, Wada Y, Futai M. Lysosome and lysosome-related organelles responsible for specialized functions in higher organisms, with special emphasis on vacuolar-type proton ATPase. Cell Struct Funct 2003; 28:455-63; PMID:14745137; http://dx.doi.org/10.1247/csf.28.455 - DOI - PubMed
- Saftig P, Klumperman J. Lysosome biogenesis and lysosomal membrane proteins: trafficking meets function. Nat Rev Mol Cell Biol 2009; 10:623-35; PMID:19672277; http://dx.doi.org/10.1038/nrm2745 - DOI - PubMed
- Jiang PD, Mizushima N. Autophagy and human diseases. Cell Res 2014; 24:69-79; PMID:24323045; http://dx.doi.org/10.1038/cr.2013.161 - DOI - PMC - PubMed
- Hemesath TJ, Steingrimsson E, McGill G, Hansen MJ, Vaught J, Hodgkinson CA, Arnheiter H, Copeland NG, Jenkins NA, Fisher DE. Microphthalmia, a critical factor in melanocyte development, defines a discrete transcription factor family. Genes Dev 1994; 8:2770-80; PMID:7958932; http://dx.doi.org/10.1101/gad.8.22.2770 - DOI - PubMed
Publication types
MeSH terms
Substances
LinkOut - more resources
Full Text Sources
Other Literature Sources
Research Materials
Miscellaneous

