A novel curcumin analog binds to and activates TFEB in vitro and in vivo independent of MTOR inhibition - PubMed (original) (raw)
. 2016 Aug 2;12(8):1372-89.
doi: 10.1080/15548627.2016.1179404. Epub 2016 May 12.
Yue-Ru Sun 3, Ivana Peluso 4, Yu Zeng 1 2, Xing Yu 1 2, Jia-Hong Lu 5, Zheng Xu 3, Ming-Zhong Wang 1, Liang-Feng Liu 1 2, Ying-Yu Huang 1 2, Lei-Lei Chen 1 2, Siva Sundara Kumar Durairajan 1 2, Hong-Jie Zhang 1 2, Bo Zhou 6, Hong-Qi Zhang 1, Aiping Lu 1, Andrea Ballabio 4, Diego L Medina 4, Zhihong Guo 3, Min Li 1 2
Affiliations
- PMID: 27172265
- PMCID: PMC4968239
- DOI: 10.1080/15548627.2016.1179404
A novel curcumin analog binds to and activates TFEB in vitro and in vivo independent of MTOR inhibition
Ju-Xian Song et al. Autophagy. 2016.
Abstract
Autophagy dysfunction is a common feature in neurodegenerative disorders characterized by accumulation of toxic protein aggregates. Increasing evidence has demonstrated that activation of TFEB (transcription factor EB), a master regulator of autophagy and lysosomal biogenesis, can ameliorate neurotoxicity and rescue neurodegeneration in animal models. Currently known TFEB activators are mainly inhibitors of MTOR (mechanistic target of rapamycin [serine/threonine kinase]), which, as a master regulator of cell growth and metabolism, is involved in a wide range of biological functions. Thus, the identification of TFEB modulators acting without inhibiting the MTOR pathway would be preferred and probably less deleterious to cells. In this study, a synthesized curcumin derivative termed C1 is identified as a novel MTOR-independent activator of TFEB. Compound C1 specifically binds to TFEB at the N terminus and promotes TFEB nuclear translocation without inhibiting MTOR activity. By activating TFEB, C1 enhances autophagy and lysosome biogenesis in vitro and in vivo. Collectively, compound C1 is an orally effective activator of TFEB and is a potential therapeutic agent for the treatment of neurodegenerative diseases.
Keywords: autophagy; curcumin analogs; lysosomal biogenesis; mechanistic target of rapamycin; transcription factor EB.
Figures
Figure 1.
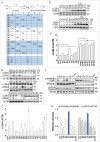
New MTOR dependent- and independent- autophagy enhancers identified from monocarbonyl analogs of curcumin. (A) Chemical structure of curcumin and its monocarbonyl analogs. (B) N2a cells were treated with curcumin (Cur, 10 μM) and its analogs (1 μM) for 12 h. The expression of LC3B-II was determined by western blot. (C) Relative intensity is normalized to that of ACTB/β-actin. Data are presented as the mean ± SD from 3 independent experiments. *, P< 0.05 vs. the control (0.1% DMSO). (D) N2a cells were treated with Cur (10 μM) and its analogs (1 μM) in the presence of chloroquine (CQ, 20 μM) for 12 h. The expression of LC3B-II was determined by western blot. (E) Relative intensity is normalized to that of ACTB/β-actin. Data are presented as the mean ± SD from 3 independent experiments. *, P < 0.05 vs. the control (0.1% DMSO); #, P < 0.05 vs. CQ treatment alone. (F) Effects of curcumin analogs on the MTOR pathway. N2a cells were treated with curcumin (Cur, 10 μM) and its analogs (1 μM) for 12 h. Torin1 (1 μM) treatment for 2 h was used as a positive control. Representative blots show the expression of phosphorylated (p-) and total RPS6KB1/p70S6K and MTOR. (G) Data are presented as the mean ± SD from 3 independent experiments. *, P < 0.05 vs. the control (0.1% DMSO).
Figure 2.
Effects of curcumin and its analogs on the nuclear translocation of TFEB. (Ato D) Effects of curcumin and its analogs on the nuclear translocation of endogenous TFEB. N2a cells were treated with curcumin (Cur, 10 μM) and its analogs (1 μM) for 12 h. (A) Cells were fixed and stained with TFEB antibody (green) and DAPI (blue). Representative images are shown. (B) Quantification of the number of cells with nuclear TFEB localization. Data are presented as mean ± SD of 3 replicates in a representative experiment. At least 500 cells were analyzed in each treatment group. (C) The expression of endogenous TFEB in the cytosolic (Cyt.) and nuclear (Nuc.) fractions were determined by western blotting. TUBB/β-tubulin and H3F3A (H3 histone, family 3A) were used as loading controls of the cytoplasmic and nuclear fraction, respectively. (D) Data are presented as the mean ± SD from 3 independent experiments. *, P< 0.05 vs. the control (0.1% DMSO). (E to I) Effects of curcumin and its analogs on the nuclear translocation of 3xFlag-TFEB. (E) HeLa cells stably expressing 3xFlag-TFEB were treated with Cur (10 μM) and its analogs (1 μM) for 12 h. Torin1 (1 μM) treatment for 2 h was used as a positive control. Cells were fixed and stained with anti-Flag antibody (red) and DAPI (blue). (F) Quantification of the number of cells with nuclear TFEB localization. Data are presented as mean ± SD of 3 replicates in a representative experiment. At least 500 cells were analyzed in each treatment group. (G) The expression of 3xFlag-TFEB in the cytosolic (Cyt.) and nuclear (Nuc.) fractions were determined by western blotting. TUBB/β-tubulin and H3F3A were used as loading controls of the cytoplasmic and nuclear fraction, respectively. (H) Data are presented as the mean ± SD from 3 independent experiments. *, P < 0.05 vs. the control (0.1% DMSO). (I) Dose–response curves of TFEB nuclear translocation induced by C1 and curcumin. Stable HeLa cells overexpressing 3xFlag-TFEB were seeded in 96-well plates, cultured for 12 h, and treated with 6 different concentrations of curcumin and C1, ranging from 123 nM to 30 μM. The graph shows the percentage of nuclear translocation at the different concentrations of each compound (in log of the concentration). The EC50 for each compound was calculated using Prism software.
Figure 3.
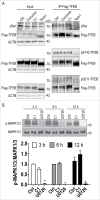
Curcumin analog C1 does not inhibit serine-phosphorylation of TFEB and MAPK1/3 activity. (A) HeLa cells stably overexpressing 3xFlag-TFEB were treated with curcumin (10 μM) and C1 (1 μM) for 12 h, and torin1 (1 μM) for 2 h. Protein extracts were subjected to immunoprecipitation using anti-FLAG antibody and then blotted with anti-phosphoserine (p-Ser) and anti-phospho-S142-TFEB (pS142-TFEB) antibodies. Phosphorylation of TFEB on serine 211 (pS211-TFEB) was detected using an antibody against the specific YWHA/14-3-3 motif that recognizes p-S211-TFEB. Blots are representative of at least 2 independent experiments. (B) Stable HeLa cells overexpressing 3xFlag-TFEB were treated with C1 (1 μM) and the MAPK1/3 inhibitor U0126 (50 μM) for the indicated time periods. The ratio of phospho-MAPK1/3 (p-MAPK1/3) to total MAPK1/3 was quantified. Data are presented as the mean ± SD from 3 independent experiments. *, P< 0.05 vs. the control (0.1% DMSO).
Figure 4.
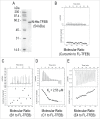
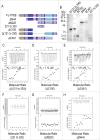
Curcumin analog C1 directly binds to recombinant TFEB. (A) SDS-PAGE gel of the purified recombinant His-TFEB. (B) ITC thermogram for curcumin (200 μM) and FL-TFEB (20 μM). (C) ITC thermogram for B1 (200 μM) and FL-TFEB (20 μM). (D) ITC thermogram for C1 (200 μM) and FL-TFEB (10 μM). Data were fitted with one site binding model, n = 0.99 ± 0.03, KD = 2.53 ± 0.33 μM, ΔH = 5.09 ± 0.24 kcal/mol−1, ΔS = 42.7 cal/mol−1 K−1. (E) ITC thermogram for E4 (200 μM) and FL-TFEB (20 μM).
Figure 5.
Curcumin analog C1 binds to TFEB at the N-terminal Gly and Ala-rich domain. (A) Map of TFEB protein domains. N-terminal deletions (ΔN) and carboxyl-terminal (ΔC) deletions are indicated with the corresponding amino acid positions. (B) SDS-PAGE of the purified recombinant TFEB deletion mutants. (C to E) Binding of C1 to TFEB truncations Δ(121 to 330) (C), ΔC150 (D) and ΔC461 (E). The concentration of each TFEB truncation was 10 μM and the concentration of C1 was 200 μM (for Δ(121 to 330)) and 100 μM (for ΔC150 and ΔC461). ((F)to H) ITC data showing TFEB truncation 221 to 320 (F), ΔN220 (G) and ΔN44 (H) has no binding with C1. Titration curves are shown with the baseline-corrected raw data with background subtraction.
Figure 6.
Curcumin analog C1 inhibits the MTOR-TFEB-YWHA interaction. HeLa cells stably expressing 3xFlag-TFEB were treated with C1 (1 μM) for 12 h. Endogenous MTOR (A) and YWHA (B) were coimmunoprecipitated with Flag-TFEB. The levels of immunoprecipitated MTOR and YWHA were normalized to their corresponding levels in whole cell lysates (WCL). Data are presented as the mean ± SD from 3 independent experiments. *, P< 0.05 vs. the control.
Figure 7.
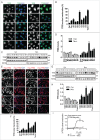
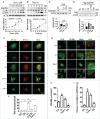
Curcumin analog C1 promotes autophagy flux and lysosomal degradation. (A) N2a cells were treated with increasing concentration of C1 for 12 h. (B) N2a cells were incubated with C1 (1 μM) for the indicated times. The protein levels of LC3B-II and SQSTM1/p62 were determined by western blotting. Data are presented as the mean ± SD from 3 independent experiments. *, P< 0.05 vs. the control (0.1% DMSO). (C) N2a cells were cotreated with cycloheximide (CHX, 10 μg/ml) and C1 (1 μM) for 12 h. The level of SQSTM1 was quantified as mean ± SD from 3 independent experiments. *, P < 0.05 vs. CHX treatment alone (N.S., not significant). (D) N2a cells were transfected with Flag-tagged SQSTM1 for 24 h and then treated with the indicated compounds for 12 h (C1, 1 μM; CQ, 20 μM; rapamycin [Rap], 5 µM). The level of Flag-SQSTM1 was quantified as mean ± SD from 3 independent experiments. *, P < 0.05 vs. the control (0.1% DMSO); #, P < 0.05 vs. C1 treatment alone (NT, nontransfected). (E) N2a cells were transiently transfected with mRFP-GFP-LC3 (tfLC3) plasmid and then treated with the indicated compounds (C1, 1 μM for 12 h; CQ, 50 μM for 12 h; torin1, 0.5 μM for 3 h). Representative images are shown (F) The numbers of red-only puncta per cell were quantified. n–20 randomly selected cells from 3 independent experiments. Data are presented as the mean ± SD. *, P < 0.05 vs. the control (0.1% DMSO); #, P < 0.05 vs. C1 treatment alone. (G) N2a cells were preincubated with 10 μg/ml of DQ-BSA-Red for 1 h, washed and then treated with the indicated compounds (C1, 1 μM for 12 h; CQ, 50 μM for 12 h; torin1, 0.5 μM for 3 h). Cells were fixed and then stained with LC3B antibody. (H) The number of DQ-BSA puncta (red) per cell was quantified. (I) The colocalization of DQ-BSA puncta (red) and LC3B puncta (green) were quantified. n–20 randomly selected cells from 3 independent experiments. Data are presented as the mean ± SD. *, P < 0.05 vs. the control (0.1% DMSO); #, P < 0.05 vs. the control (0.1% DMSO).
Figure 8.
Curcumin analog C1 promotes lysosomal biogenesis. (A to F) N2a and HeLa cells were treated with C1 (0.5, 1 μM) or sucrose (100 mM) for 12 h. The protein levels of the autophagy marker (LC3B-II), TFEB and lysosome markers (LAMP1, CTSD) were determined by western blotting. (A, B) Representative blots. (C to F) Relative intensities are normalized to that of ACTB/β-actin. Data are presented as the mean ± SD from 3 independent experiments. *, P< 0.05 vs. the control (0.1% DMSO). (G) HeLa cells were treated with C1 (1 μM) for 12 h. mRNA transcript abundance was assessed by real-time PCR using specific primers for the indicated genes. Relative quantification (RQ) is presented as means ± SD of 3 independent experiments. *, P < 0.05 vs. the control (0.1% DMSO).
Figure 9.
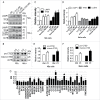
Curcumin analog C1-induced autophagy requires TFEB and BECN1. (A-E) N2a cells were transfected with nontarget siRNA (siNT, 25 nM), Atg5 siRNA (siAtg5, 25 nM), Becn1 siRNA (siBecn1, 25 nM) and Tfeb siRNA (siTfeb, 25 and 50 nM) for 48 h and then treated with C1 (1 μM) in the presence or absence of CQ (25 μM) for an additional 12 h. (A, B) Representative blots are shown. (C to E) Relative intensity of LC3B-II is normalized to that of ACTB/β-actin. Data are presented as the mean ± SD from 3 independent experiments. *, P< 0.05 vs. the control; #, P < 0.05 vs. CQ treatment alone. (F) N2a cells were transfected with Flag-tagged SQSTM1 for 24 h and then transfected with nontarget siRNA (siNT, 25 nM) or Tfeb siRNA (siTfeb, 50 nM) for another 48 h. Cells were treated with C1 (1 μM) for 12 h and the level of Flag-SQSTM1 was quantified as mean ± SD from 3 independent experiments. *, P < 0.05 vs. the control (0.1% DMSO). (G) HeLa cells were infected with lentivirus expressing nontarget shRNA (shNT) or TFEB shRNA (shTFEB) for 48 h and then treated with C1 (1 μM) in the presence or absence of CQ (25 μM) for an additional 12 h. Representative blots are shown. (H) Relative intensity of LC3B-II is normalized to that of ACTB/β-actin. Data are presented as the mean ± SD from 3 independent experiments. *, P < 0.05 vs. the control; #, P < 0.05 vs. CQ treatment alone. N.S. (not significant).
Figure 10.
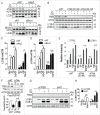
Oral administration of C1 activates TFEB and enhances autophagy and lysosome biogenesis in rat brain. SD rats (n = 6 per group) were orally administered with C1 (L, low dosage, 10 mg/kg; H, high dosage, 25 mg/kg) or vehicle (Veh., 1% CMC-Na) for 24 h. An additional dosage of C1 was given 6 h prior to sacrifice. (A) Representative blots show the levels of TFEB, autophagy and lysosome markers, p-MTOR and MTOR, as well as p-RPS6KB1 and RPS6KB1 in the frontal cortex. (B, C) Data are presented as the mean ± SD (n = 6). *, P< 0.05 vs. the vehicle treatment. (D) Representative blots shows that C1 treatment promotes TFEB nuclear translocation in the frontal cortex (n = 4). ACTB/β-actin and H3F3A (H3 histone, family 3A) were used as loading control of cytoplasmic and nuclear fraction respectively. (E) Data are presented as the mean ± SD (n = 4). *, P < 0.05 vs. vehicle treatment. (F) Levels of autophagy and lysosome genes in the frontal cortex were analyzed by real- time PCR. Relative quantification (RQ) is presented as means ± SD (n = 4). *P < 0.05 vs. the vehicle treatment. (G) Immunoprecipitation shows that C1 treatment inhibits MTOR-TFEB interaction in the frontal cortex (n = 4). (H) The levels of immunoprecipitated MTOR were normalized to its corresponding levels in cell lysates (Input). Data are presented as the mean ± SD (n = 4). *, P < 0.05 vs. the vehicle treatment.
Figure 11.
Chronic administration of C1 activates TFEB and enhances autophagy in rat brains. SD rats (n = 6 per group) were orally administered by gavage with C1 (10 mg/kg per day) or vehicle (1% CMC-Na) for 21 d. An additional dosage of C1 was given 6 h prior to sacrifice. Representative blots show the protein levels as indicated in the frontal cortex. Data are presented as the mean ± SD (n = 6). *, P< 0.05 vs. the vehicle treatment.
Similar articles
- Curcumin targets the TFEB-lysosome pathway for induction of autophagy.
Zhang J, Wang J, Xu J, Lu Y, Jiang J, Wang L, Shen HM, Xia D. Zhang J, et al. Oncotarget. 2016 Nov 15;7(46):75659-75671. doi: 10.18632/oncotarget.12318. Oncotarget. 2016. PMID: 27689333 Free PMC article. - A Curcumin Derivative Activates TFEB and Protects Against Parkinsonian Neurotoxicity in Vitro.
Wang Z, Yang C, Liu J, Chun-Kit Tong B, Zhu Z, Malampati S, Gopalkrishnashetty Sreenivasmurthy S, Cheung KH, Iyaswamy A, Su C, Lu J, Song J, Li M. Wang Z, et al. Int J Mol Sci. 2020 Feb 22;21(4):1515. doi: 10.3390/ijms21041515. Int J Mol Sci. 2020. PMID: 32098449 Free PMC article. - Impaired TFEB-mediated lysosomal biogenesis promotes the development of pancreatitis in mice and is associated with human pancreatitis.
Wang S, Ni HM, Chao X, Wang H, Bridges B, Kumer S, Schmitt T, Mareninova O, Gukovskaya A, De Lisle RC, Ballabio A, Pacher P, Ding WX. Wang S, et al. Autophagy. 2019 Nov;15(11):1954-1969. doi: 10.1080/15548627.2019.1596486. Epub 2019 Mar 30. Autophagy. 2019. PMID: 30894069 Free PMC article. - TFEB at a glance.
Napolitano G, Ballabio A. Napolitano G, et al. J Cell Sci. 2016 Jul 1;129(13):2475-81. doi: 10.1242/jcs.146365. Epub 2016 Jun 1. J Cell Sci. 2016. PMID: 27252382 Free PMC article. Review. - TFEB Biology and Agonists at a Glance.
Chen M, Dai Y, Liu S, Fan Y, Ding Z, Li D. Chen M, et al. Cells. 2021 Feb 5;10(2):333. doi: 10.3390/cells10020333. Cells. 2021. PMID: 33562649 Free PMC article. Review.
Cited by
- Neuroprotective Effects of Curcumin in Methamphetamine-Induced Toxicity.
Ryskalin L, Puglisi-Allegra S, Lazzeri G, Biagioni F, Busceti CL, Balestrini L, Fornasiero A, Leone S, Pompili E, Ferrucci M, Fornai F. Ryskalin L, et al. Molecules. 2021 Apr 24;26(9):2493. doi: 10.3390/molecules26092493. Molecules. 2021. PMID: 33923340 Free PMC article. - Age-Related Lysosomal Dysfunctions.
Guerrero-Navarro L, Jansen-Dürr P, Cavinato M. Guerrero-Navarro L, et al. Cells. 2022 Jun 20;11(12):1977. doi: 10.3390/cells11121977. Cells. 2022. PMID: 35741106 Free PMC article. Review. - [Protective effect of curcumin on dopamine neurons in Parkinson's disease and its mechanism].
Wu Y, Liang S, Xu B, Zhang R, Xu L. Wu Y, et al. Zhejiang Da Xue Xue Bao Yi Xue Ban. 2018 May 25;47(5):480-486. doi: 10.3785/j.issn.1008-9292.2018.10.06. Zhejiang Da Xue Xue Bao Yi Xue Ban. 2018. PMID: 30693689 Free PMC article. Chinese. - Insight into the Role of Extracellular Vesicles in Lysosomal Storage Disorders.
Tancini B, Buratta S, Sagini K, Costanzi E, Delo F, Urbanelli L, Emiliani C. Tancini B, et al. Genes (Basel). 2019 Jul 6;10(7):510. doi: 10.3390/genes10070510. Genes (Basel). 2019. PMID: 31284546 Free PMC article. Review. - Mitophagy Transcriptome: Mechanistic Insights into Polyphenol-Mediated Mitophagy.
Tan S, Wong E. Tan S, et al. Oxid Med Cell Longev. 2017;2017:9028435. doi: 10.1155/2017/9028435. Epub 2017 May 25. Oxid Med Cell Longev. 2017. PMID: 28626500 Free PMC article. Review.
References
- Eskelinen EL, Saftig P. Autophagy: a lysosomal degradation pathway with a central role in health and disease. Biochim Biophys Acta 2009; 1793:664-73; PMID:18706940; http://dx.doi.org/10.1016/j.bbamcr.2008.07.014 - DOI - PubMed
- Lieberman AP, Puertollano R, Raben N, Slaugenhaupt S, Walkley SU, Ballabio A. Autophagy in lysosomal storage disorders. Autophagy 2012; 8:719-30; PMID:22647656; http://dx.doi.org/10.4161/auto.19469 - DOI - PMC - PubMed
- Pan T, Kondo S, Le W, Jankovic J. The role of autophagy-lysosome pathway in neurodegeneration associated with Parkinson disease. Brain 2008; 131:1969-78; PMID:18187492; http://dx.doi.org/10.1093/brain/awm318 - DOI - PubMed
- Nixon RA. The role of autophagy in neurodegenerative disease. Nat Med 2013; 19:983-97; PMID:23921753; http://dx.doi.org/10.1038/nm.3232 - DOI - PubMed
- Settembre C, Di Malta C, Polito VA, Garcia Arencibia M, Vetrini F, Erdin S, Erdin SU, Huynh T, Medina D, Colella P, et al.. TFEB links autophagy to lysosomal biogenesis. Science 2011; 332:1429-33; PMID:21617040; http://dx.doi.org/10.1126/science.1204592 - DOI - PMC - PubMed
MeSH terms
Substances
LinkOut - more resources
Full Text Sources
Other Literature Sources
Miscellaneous
