Deacetylation of TFEB promotes fibrillar Aβ degradation by upregulating lysosomal biogenesis in microglia - PubMed (original) (raw)
doi: 10.1007/s13238-016-0269-2. Epub 2016 May 21.
Liangjun Zheng 1, Qi Zhang 1, Xinya Li 1, Xuefei Zhang 1, Zeyang Li 1, Xue Bai 1, Zhong Zhang 1, Wei Huo 1, Xuyang Zhao 2, Shujiang Shang 3, Qingsong Wang 4, Chen Zhang 5, Jianguo Ji 6
Affiliations
- PMID: 27209302
- PMCID: PMC4887328
- DOI: 10.1007/s13238-016-0269-2
Deacetylation of TFEB promotes fibrillar Aβ degradation by upregulating lysosomal biogenesis in microglia
Jintao Bao et al. Protein Cell. 2016 Jun.
Abstract
Microglia play a pivotal role in clearance of Aβ by degrading them in lysosomes, countering amyloid plaque pathogenesis in Alzheimer's disease (AD). Recent evidence suggests that lysosomal dysfunction leads to insufficient elimination of toxic protein aggregates. We tested whether enhancing lysosomal function with transcription factor EB (TFEB), an essential regulator modulating lysosomal pathways, would promote Aβ clearance in microglia. Here we show that microglial expression of TFEB facilitates fibrillar Aβ (fAβ) degradation and reduces deposited amyloid plaques, which are further enhanced by deacetylation of TFEB. Using mass spectrometry analysis, we firstly confirmed acetylation as a previously unreported modification of TFEB and found that SIRT1 directly interacted with and deacetylated TFEB at lysine residue 116. Subsequently, SIRT1 overexpression enhanced lysosomal function and fAβ degradation by upregulating transcriptional levels of TFEB downstream targets, which could be inhibited when TFEB was knocked down. Furthermore, overexpression of deacetylated TFEB at K116R mutant in microglia accelerated intracellular fAβ degradation by stimulating lysosomal biogenesis and greatly reduced the deposited amyloid plaques in the brain slices of APP/PS1 transgenic mice. Our findings reveal that deacetylation of TFEB could regulate lysosomal biogenesis and fAβ degradation, making microglial activation of TFEB a possible strategy for attenuating amyloid plaque deposition in AD.
Keywords: Alzheimer’s disease; SIRT1; TFEB; deacetylation; lysosomes; microglia.
Figures
Figure 1
TFEB enhances microglial degradation of fibrillar Aβ in lysosomes. (A and B) Microglia internalize and efficiently degrade fibrillar Aβ. BV2 cells were incubated with fAβ (500 nmol/L) at 37°C and the cells were harvested and lysed at different time points, followed by detection of intracellular Aβ levels by Western blotting analysis (A). The band intensity was measured in three independent experiments indicating relative intracellular Aβ levels and the mean ± SEM are shown in (B). (C) Fibrillar Aβ is rapidly trafficked into lysosomes. Confocal imaging of live BV2 cells 30 min after addition of Hilyte488-labeled fAβ (500 nmol/L) showed localization of fAβ (Green) within lysosomes stained with LysoTracker (Red). Scale bar, 15 μm. (D) Internalized fAβ is degraded in lysosomes. Primary microglia from wild-type mice were pretreated with DMSO, Phosphoramidon (NEP inhibitor, 10 μmol/L), Chloroquine or Leupeptin (Lysosome inhibitor, 10 μmol/L) for 18 h. The cells were then incubated with fAβ (500 nmol/L) in the presence of DMSO or inhibitors for an additional 18 h. The band intensity was measured in three independent experiments indicating relative intracellular Aβ levels. (E and G) TFEB overexpression increases fAβ degradation in microglia. GFP or human TFEB was overexpressed in BV2 cells (E) or primary microglia (G) by lentiviral system. The cells were incubated with fAβ (500 nmol/L) for 3 h or 18 h and were harvested for detection of intracellular Aβ levels by Western blotting analysis. The band intensity was measured in three independent experiments indicating relative intracellular Aβ levels and the mean ± SEM are shown in the right panel. Two-way ANOVA, comparison between different time points, **P < 0.01; ***P < 0.001. Unpaired Student’s _t_-test, comparison against the Fugw3-GFP, #P < 0.05; ###P < 0.001. (F and H) TFEB knockdown inhibits fAβ degradation in microglia. Scramble or TFEB siRNA was delivered into BV2 cells (F) or primary microglia (H) for 72 h. The cells were treated as in (E and G). Two-way ANOVA, comparison between different time points, **P < 0.01; ***P < 0.001. Unpaired Student’s _t_-test, comparison against the Scramble, ###P < 0.001
Figure 2
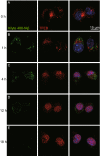
Fibrillar Aβ stimulates TFEB to translocate into nucleus. (A–E) TFEB translocates into nucleus under incubation of fibrillar Aβ. Confocal imaging of BV2 cells incubated with Hilyte488-labeled fAβ (500 nmol/L, Green) at different time points and immunostained for endogenous TFEB (Red). Scale bar, 15 μm
Figure 3
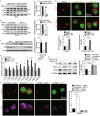
TFEB is acetylated at lysine 116. (A) Exogenous expressed TFEB is acetylated. Empty vector or Flag-tagged TFEB was transfected into HEK293T cells for 24 h treated with sirtuins inhibitor NAM (10 mmol/L) and HDAC I, II, and IV inhibitor TSA (0.5 μmol/L) and was immunoprecipitated for acetylation Western blotting analysis with the antibody against acetylated lysine. (B) Immunoprecipitated Flag-tagged TFEB for mass spectrometry analysis. Flagged-tagged TFEB was transfected into HEK293T cells for 24 h treated with or without NAM (10 mmol/L) and TSA (0.5 μmol/L) and was immunoprecipitated with anti-flag affinity agrose beads, followed by Commassie Blue R250 staining. (C) Identification of TFEB K116 acetylation using mass spectrometry analysis. Flagged-tagged TFEB was purified as depicted in (B) and then analyzed using mass spectrometry. (D) Alignment of the protein sequences of TFEB homologues in different species. The blue mark indicates the identified acetylated lysine residues of TFEB. (E) Deacetylation mimic of TFEB (K116R) counteracts NAM acetylation effects on TFEB. Flag-tagged TFEB (WT or K116R) were transfected into HEK293T cells for 24 h with or without additional 12 h treatment of NAM (10 mmol/L). Values were expressed as fold changes relative to TFEB-WT without NAM treatment and normalized to IP-Flag
Figure 4
TFEB is a deacetylation substrate of SIRT1. (A) TFEB interacts with SIRT1. Endogenous coimmunoprcipitation assay was conducted with SIRT1 antibody and endogenous TFEB was detected by its specific antibody. (B) Catalytic activity of SIRT1 is required for deacetylation of TFEB. Flag-tagged TFEB was co-transfected into HEK293T cells with wild-type SIRT1 (WT) or its catalytically inactive mutant H363Y (HY), followed by additional treatment with or without NAM before harvest. Acetylation levels of TFEB were measured by IP Western blotting analysis. Values were expressed as fold changes relative to TFEB-WT without SIRT1 overexpression and normalized to IP-Flag. (C) Deacetylation mimic of TFEB (K116R) counteracts SIRT1 knockdown effects on acetylation of TFEB. Flag-tagged TFEB (WT or K116R) were co-transfected into HEK293T cells for 24 h with Scramble or SIRT1 siRNA. Acetylation levels of TFEB were measured by IP Western blotting analysis. Values were expressed as fold changes relative to TFEB-WT with scramble siRNA transfection and normalized to IP-Flag. (D) In vitro TFEB deacetylation by SIRT1. Purified Flag-TFEB and Flag SIRT1 (WT or HY) were co-incubated at 30°C for 6 h treated with or without NAD (5 mmol/L) or NAM (10 mmol/L). Acetylation levels of purified Flag-TFEB were measured by Western blotting analysis. Values were expressed as fold changes relative to TFEB-WT with NAD treatment and without SIRT overexpression and normalized to purified Flag-TFEB. (E) NAM, not TSA, increases TFEB acetylation. Flag-tagged TFEB was transfected into HEK293T cells treated with or without NAM (10 mmol/L) or TSA (0.5 μmol/L). Acetylation levels of TFEB were measured by IP Western blotting analysis. Values were expressed as fold changes relative to TFEB-WT without NAM or TSA treatment and normalized to IP-Flag
Figure 5
SIRT1 accelerates fAβ degradation in microglia by enhancing lysosomal biogenesis. (A and B) SIRT1 accelerates fAβ degradation in microglia. GFP or human SIRT1 (SIRT1) was overexpressed in BV2 cells by lentiviral system (A). Scramble or SIRT1 siRNA was delivered into BV2 cells for 72 h (B). Then the cells were incubated with fAβ (500 nmol/L) for 3 h or 18 h and were harvested for detection of intracellular Aβ levels by Western blotting analysis. Two-way ANOVA, comparison between different time points, *P < 0.05; **P < 0.01; ***P < 0.001. Unpaired Student’s _t_-test, comparison against the Fugw3-GFP or the Scramble, #P < 0.05, ##P < 0.01. (C) Catalytic activity of SIRT1 is required for degradation of fAβ. GFP or SIRT1 (WT or H363Y) was overexpressed in BV2 cells by lentiviral system. The cells were incubated with fAβ (500 nmol/L) for 18 h and were harvested for detection of intracellular Aβ levels by Western blotting analysis. One-way ANOVA with Turkey’s test, comparison against GFP, *P < 0.05. (D) SIRT1 stimulates lysosome biogenesis in microglia. Empty vector or GFP-tagged SIRT1 (WT or HY) was overexpressed in BV2 cells, followed by staining with an antibody against LAMP1 (Red) or LysoTracker Red, respectively. The fluorescence signal of each cell was estimated by examining more than 50 cells. One-way ANOVA with Turkey’s test, **P < 0.01; (E) SIRT1 upregulates TFEB induction of its target genes. Quantitative PCR (qPCR) analysis of TFEB target genes in BV2 cells overexpressed with empty vector as control or SIRT1 (WT or HY). Values represent mean ± SEM of three independent experiments. One-way ANOVA with Turkey’s test, comparison against CTRL, *P < 0.05; **P < 0.01; ***P < 0.001. (F) TFEB is required for SIRT1’s effects on accelerating fAβ degradation. BV2 cells were infected with lentiviral FugW3-GFP or FugW3-SIRT1 and were simultaneously transfected with scramble or TFEB siRNA for 72 h. The cells were incubated with fAβ (500 nmol/L) for an additional 18 h and were harvested for detection of intracellular Aβ levels by Western blotting analysis. One-way ANOVA with Turkey’s test, comparison against GFP with scramble siRNA, **P < 0.01; ***P < 0.001. (G) TFEB is required for SIRT1’s stimulation of lysosomal biogenesis. BV2 cells were transfected with scramble or TFEB siRNA for 72 h and were transfected with empty vector or GFP-tagged SIRT1-WT, followed by staining with an antibody against LAMP1 (Red). The fluorescence signal of each cell was estimated by examining more than 50 cells. One-way ANOVA with Turkey’s test, *P < 0.05; ***P < 0.001
Figure 6
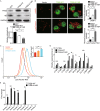
Deacetylated TFEB facilitates fAβ degradation by enhancing lysosomal biogenesis. (A) Deacetylation of TFEB at K116 futher facilitates fAβ degradation. BV2 cells were infected with lentivirally overexpressed FugW3-GFP or FugW3-TFEB (WT or K116R). The cells were incubated with fAβ (500 nmol/L) for an additional 18 h and were harvested for detection of intracellular Aβ levels by Western blotting analysis. The band intensity was measured in three independent experiments indicating relative intracellular Aβ levels and the mean ± SEM. are shown in the right panel. One-way ANOVA with Turkey’s test, *P < 0.05; **P < 0.01; ***P < 0.001. (B) Deacetylation of TFEB at K116 further stimulates lysosomal biogenesis in microglia. Empty vector or GFP-tagged TFEB (WT or K116R) was overexpressed in BV2 cells, followed by staining with an antibody against LAMP1 (Red) or LysoTracker Red, respectively. The fluorescence signal of each cell was estimated by examining more than 50 cells. One-way ANOVA with Turkey’s test, *P < 0.05; **P < 0.01; ***P < 0.001. (C) Flow cytometric analysis of lyososomes stained with LysoTracker Red in BV2 cells treated as in (B). Values of mean fluorescence were expressed as fold changes. One-way ANOVA with Turkey’s test, *P < 0.05; **P < 0.01. (D) Deacetylation status at K116 further upregulates expression of TFEB target genes. qPCR analysis of TFEB target genes in BV2 cells overexpressed with empty vector as control or TFEB (WT or K116R). Values represent mean ± SEM of three independent experiments. One-way ANOVA with Turkey’s test, comparison against CTRL, *P < 0.05; **P < 0.01. (E) ChIP-qPCR analysis for TFEB binding to its target gene CLCN7. The histogram shows the amount of immunoprecipitated DNA as detected by qPCR assay. Values were normalized to the input and displayed as relative enrichment over a mock control. Values represent mean ± SEM of three independent experiments. One-way ANOVA with Turkey’s test, **P < 0.01; ***P < 0.001
Figure 7
Microglial expression of deacetylated TFEB reduces amyloid plaques in the brain slices from APP/PS1 mice. (A) Ex vivo degradation assay. BV2 microglia were infected with lentivirally overexpressed FugW3-TFEB (WT or K116R) and co-cultured with 10 μm thick freshly cut, unfixed brain slices from aged APP/PS1 transgenic mice. After 48 h the slices were used for subsequent analysis. (B–E) Deacetylation of TFEB at K116 further reduces amyloid plaques. BV2 microglia overexpressed with vector control (CTRL) or TFEB (WT or K116R) were co-cultured with brain sections prepared as depicted in (A), followed by staining amyloid plaques with thioflavine-S (Green) (B–D) or by Western blotting analysis of fAβ levels (E and F). CTX, cortex; HPC, hippocampi. Results are mean area fraction of amyloid plaques ± SEM for 3 mice per group. The band intensity was measured in three independent experiments indicating relative fAβ levels and the mean ± SEM. One-way ANOVA with Turkey’s test, *P < 0.05; **P < 0.01. Scale bar, 200 μm
Figure 8
A schematic model of TFEB deacetylation on facilitating fAβ degradation in microglia by enhancing lysosomal biogenesis. In the presence of fAβ stimulation, microglia take up fAβ and transport them into lysosomes. Meanwhile, TFEB translocates into nucleus where it interacts with SIRT1 and is deacetylated at K116. Deacetylation of TFEB enhances its transcriptional induction of its downstream target genes closely associated with lysomomal biogenesis, which eventually upregulates microglial capability in degradation of fAβ
Similar articles
- Neuronal-Targeted TFEB Accelerates Lysosomal Degradation of APP, Reducing Aβ Generation and Amyloid Plaque Pathogenesis.
Xiao Q, Yan P, Ma X, Liu H, Perez R, Zhu A, Gonzales E, Tripoli DL, Czerniewski L, Ballabio A, Cirrito JR, Diwan A, Lee JM. Xiao Q, et al. J Neurosci. 2015 Sep 2;35(35):12137-51. doi: 10.1523/JNEUROSCI.0705-15.2015. J Neurosci. 2015. PMID: 26338325 Free PMC article. - Enhancing astrocytic lysosome biogenesis facilitates Aβ clearance and attenuates amyloid plaque pathogenesis.
Xiao Q, Yan P, Ma X, Liu H, Perez R, Zhu A, Gonzales E, Burchett JM, Schuler DR, Cirrito JR, Diwan A, Lee JM. Xiao Q, et al. J Neurosci. 2014 Jul 16;34(29):9607-20. doi: 10.1523/JNEUROSCI.3788-13.2014. J Neurosci. 2014. PMID: 25031402 Free PMC article. - Intermittent hypoxia therapy ameliorates beta-amyloid pathology via TFEB-mediated autophagy in murine Alzheimer's disease.
Wang X, Xie Y, Chen G, Lu Y, Wang D, Zhu L. Wang X, et al. J Neuroinflammation. 2023 Oct 20;20(1):240. doi: 10.1186/s12974-023-02931-6. J Neuroinflammation. 2023. PMID: 37864249 Free PMC article. - The dual and emerging role of physical exercise-induced TFEB activation in the protection against Alzheimer's disease.
Morais GP, de Sousa Neto IV, Marafon BB, Ropelle ER, Cintra DE, Pauli JR, Silva ASRD. Morais GP, et al. J Cell Physiol. 2023 May;238(5):954-965. doi: 10.1002/jcp.31005. Epub 2023 Apr 3. J Cell Physiol. 2023. PMID: 37013375 Review. - TFEB in Alzheimer's disease: From molecular mechanisms to therapeutic implications.
Gu Z, Cao H, Zuo C, Huang Y, Miao J, Song Y, Yang Y, Zhu L, Wang F. Gu Z, et al. Neurobiol Dis. 2022 Oct 15;173:105855. doi: 10.1016/j.nbd.2022.105855. Epub 2022 Aug 27. Neurobiol Dis. 2022. PMID: 36031168 Review.
Cited by
- Dietary Polyphenols: A Multifactorial Strategy to Target Alzheimer's Disease.
Dhakal S, Kushairi N, Phan CW, Adhikari B, Sabaratnam V, Macreadie I. Dhakal S, et al. Int J Mol Sci. 2019 Oct 14;20(20):5090. doi: 10.3390/ijms20205090. Int J Mol Sci. 2019. PMID: 31615073 Free PMC article. Review. - TFEB dysregulation as a driver of autophagy dysfunction in neurodegenerative disease: Molecular mechanisms, cellular processes, and emerging therapeutic opportunities.
Cortes CJ, La Spada AR. Cortes CJ, et al. Neurobiol Dis. 2019 Feb;122:83-93. doi: 10.1016/j.nbd.2018.05.012. Epub 2018 May 28. Neurobiol Dis. 2019. PMID: 29852219 Free PMC article. Review. - Nutraceutical and Dietary Strategies for Up-Regulating Macroautophagy.
McCarty MF. McCarty MF. Int J Mol Sci. 2022 Feb 12;23(4):2054. doi: 10.3390/ijms23042054. Int J Mol Sci. 2022. PMID: 35216170 Free PMC article. Review. - Role of TFEB in Autophagy and the Pathogenesis of Liver Diseases.
Yan S. Yan S. Biomolecules. 2022 May 6;12(5):672. doi: 10.3390/biom12050672. Biomolecules. 2022. PMID: 35625599 Free PMC article. Review. - Translation Inhibitors Activate Autophagy Master Regulators TFEB and TFE3.
Dang TT, Back SH. Dang TT, et al. Int J Mol Sci. 2021 Nov 8;22(21):12083. doi: 10.3390/ijms222112083. Int J Mol Sci. 2021. PMID: 34769510 Free PMC article.
References
- Bard F, Cannon C, Barbour R, Burke RL, Games D, Grajeda H, Guido T, Hu K, Huang J, Johnson-Wood K, et al. Peripherally administered antibodies against amyloid beta-peptide enter the central nervous system and reduce pathology in a mouse model of Alzheimer disease. Nat Med. 2000;6:916–919. doi: 10.1038/78682. - DOI - PubMed
Publication types
MeSH terms
Substances
LinkOut - more resources
Full Text Sources
Other Literature Sources
Molecular Biology Databases


