14-3-3γ Prevents Centrosome Amplification and Neoplastic Progression - PubMed (original) (raw)
Lalit Sehgal 1, Arunabha Bose 1, Anushree Gulvady 1, Parijat Senapati 2, Rahul Thorat 1, Srikanta Basu 1, Khyati Bhatt 1, Amol S Hosing 1, Renu Balyan 3, Lalit Borde 4, Tapas K Kundu 2, Sorab N Dalal 1
Affiliations
- PMID: 27253419
- PMCID: PMC4890593
- DOI: 10.1038/srep26580
14-3-3γ Prevents Centrosome Amplification and Neoplastic Progression
Amitabha Mukhopadhyay et al. Sci Rep. 2016.
Abstract
More than 80% of malignant tumors show centrosome amplification and clustering. Centrosome amplification results from aberrations in the centrosome duplication cycle, which is strictly coordinated with DNA-replication-cycle. However, the relationship between cell-cycle regulators and centrosome duplicating factors is not well understood. This report demonstrates that 14-3-3γ localizes to the centrosome and 14-3-3γ loss leads to centrosome amplification. Loss of 14-3-3γ results in the phosphorylation of NPM1 at Thr-199, causing early centriole disjunction and centrosome hyper-duplication. The centrosome amplification led to aneuploidy and increased tumor formation in mice. Importantly, an increase in passage of the 14-3-3γ-knockdown cells led to an increase in the number of cells containing clustered centrosomes leading to the generation of pseudo-bipolar spindles. The increase in pseudo-bipolar spindles was reversed and an increase in the number of multi-polar spindles was observed upon expression of a constitutively active 14-3-3-binding-defective-mutant of cdc25C (S216A) in the 14-3-3γ knockdown cells. The increase in multi-polar spindle formation was associated with decreased cell viability and a decrease in tumor growth. Our findings uncover the molecular basis of regulation of centrosome duplication by 14-3-3γ and inhibition of tumor growth by premature activation of the mitotic program and the disruption of centrosome clustering.
Figures
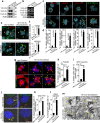
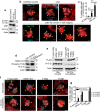
Figure 1. Loss of 14-3-3γ causes centrosome amplification in human cells.
(a–b) The protein (a) and mRNA (b) levels of the indicated gene products in 14-3-3γ-knockdown and vector-control cells were determined as described. Actin and GAPDH served as loading controls. (c–d) Centrosomes of 14-3-3γ-knockdown and vector-control cells were stained with antibodies specific to γ-Tubulin, Ninein and Cep170, or the cells were transfected with GFP-Centrin as indicated (c). Cells were co-stained with DAPI to visualize the nuclei and analyzed by confocal microscopy. Representative images are shown (c). The percentage of mitotic cells with more than 2 centrosomes or more than four centrioles was determined in three independent experiments (d). (e–f) HEK293 or U2OS cells were transfected with plasmids encoding EGFP-f (control) or EGFP-f and shRNA-14-3-3γ. Cells were stained with anti-Cep-170 antibodies, to determine centrosome number. (g–i) Multiple spindle poles associated with supernumerary centrosomes were observed by transfecting the cells with mCherry-α-tubulin and GFP-Centrin, or transfection of mCherry-α-tubulin followed by immuno-staining for γ-Tubulin (g). The number of spindle poles was determined as indicated in the materials and methods (h–i). Note that all the centrosomes anchor the mitotic spindle. (j–l) The indicated cells were stained with antibodies to Cep-170 or transfected with GFP-Centrin followed by co-staining with DAPI and the number of centrosomes determined. The images shown are merged with DIC image. (k) The number of cells with more than 1 centrosome (for Cep-170) and (l) more than 2 centrioles (for Centrin) were determined in three independent experiments. (m) Osmium tetroxide stained 14-3-3γ-knockdown and vector-control cells were visualized at 25000x magnification under scanning Electron Microscope. Centrioles are indicated by arrows. All the Western blots were run under the same experimental conditions and the full length blots are in Supplementary Fig. 6. In all the experiments the mean and standard error from at least three independent experiments were plotted, error bars denote standard error of mean and p-values are obtained using Student’s t test (2 sample unequal variance) and the asterisk (*) represents a p value <0.05. Original magnification 630X with 2X optical zoom. Scale bar indicate 10 μm, unless mentioned.
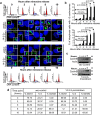
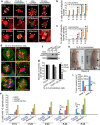
Figure 2. Depletion of 14-3-3γ leads to centrosome over-duplication during S-phase.
(a,b) 14-3-3γ-knockdown and vector-control cells were transfected with GFP-Centrin and synchronized with mimosine. Another similar set of un-transfected cells were used for staining with anti-Cep-170 antibody. At various time points post mimosine withdrawal (0 hours), cells were either processed for FACS analysis, or were stained with anti-Cep-170 antibody to visualize centrioles and co-stained with DAPI for nuclei. The cells transfected with GFP-Centrin were counter-stained with DAPI. The cell cycle histograms and associated representative confocal images are shown (a). The percentage of cells with centrosome amplification was determined at each time point in each experiment and the mean and standard error are plotted (b); Student’s t test (2 sample unequal variance) was used to determine p-value; p < 0.05 (*). (c) Protein extracts were resolved on SDS-PAGE gels followed by Western blotting for cyclinB1. Note that an increase in CyclinB1 level is coincident with an increase in centrosome number. Western blots for actin served as a loading control. (d) Table showing the percentages of cells in different cell cycle phases at each time point. All the Western blots were run under the same experimental conditions and the full length blots are in Supplementary Fig. 6.
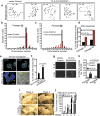
Figure 3. Centrosome amplification, resulted by depletion of 14-3-3γ, leads to higher aneuploidy and increased tumor formation.
(a–d) Chromosome counts from 14-3-3γ-knockdown cells show an increase in aneuploidy in comparison to the vector control cells. (a) Representative metaphase plates (visualized under 1000x magnification of upright fluorescence microscope) with different chromosome numbers from 14-3-3γ-knockdown and vector control cells are shown. (b,c) Chromosome numbers from one hundred 14-3-3γ-knockdown and vector control cells were counted at early (15) or late (55) passage. Aneuploidy increases with loss of 14-3-3γ and rise in cellular passage. (d) Difference in overall aneuploidy (total number of cells with more or less than 46 chromosomes) between knockdown and control line, at passage-15 and 55, is plotted. (e) Micronuclei were observed by DAPI staining or transfection with GFP-Lamin-A. Scale bar is 10 μm unless mentioned. (f) The number of cells showing micronuclei formation was determined in the 14-3-3γ-knockdown and vector control cells. 100 cells were counted in three independent experiments and the mean and standard error are plotted. (g,h) Early and late passage 14-3-3γ-knockdown and vector control cells were plated in soft agar and colonies counted formed after 2-3 weeks from 20 fields (at 10X magnification) and the mean and standard deviation from three independent experiments is plotted. (i) 5 NOD-SCID mice were subcutaneously injected with 106 cells of 14-3-3γ-knockdown and control line, and tumor size determined every week as described. (J) Tumor volume is plotted on the Y-axis and the time in weeks on the X-axis. The corresponding mean tumor volumes in mm3 are: Week 2 vec-Control 0, 14-3-3γ knockdown 58.8; Week 3 vec-Control 33.5, 14-3-3γ knockdown 492.5; Week 4 vec-Control 293, 14-3-3γ knockdown 3510; Week 5 vec-Control 1,519, 14-3-3γ knockdown 6,497. An asterisk (*) indicates a p value <0.05. p-values were determined using a Students t-test (2 sample unequal variance).
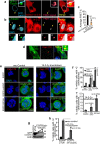
Figure 4. Cdc25C activity stimulates centrosome over-duplication in 14-3-3γ-knockdown cells.
(a–c) HCT116 cells were transfected with CFP-Lamin-A (cyan), GFP-γ-Tubulin (donor) and dsRed-14-3-3γ (acceptor) (a) or stained with antibodies to γ-Tubulin (green) and 14-3-3γ (red) (b) and counter-stained with DAPI (blue) followed by sensitized emission FRET analysis. The FRET images are shown in the third panel from the left, while the fourth image from the left shows the merged image as indicated. The smaller panels show a magnified image of the boxed region. (c) A comparison of FRET signal intensities obtained from antibody based FRET was performed in 14-3-3γ-knockdown and control line. The graph shows the mean and standard deviation for percentage FRET efficiency from ten different cells. p values indicated were obtained using a student’s t-test (2 sample unequal variance) and the asterisk indicates p < 0.05. (d) Co-localization of cdc25C at centrosome is determined by transfecting HCT116 cells with EGFP-cdc25C (green) and staining with anti Cep-170 (red) antibody. (e–g) 14-3-3γ-knockdown cells were transfected with the vector control (EGFP), EGFP-cdc25C or EGFP-S216A and stained with antibodies to Cep-170 (red) (e). (f,g) Centrosome number was determined and the mean and standard error from three different experiments is plotted (h) 14-3-3γ-knockdown and control cells were co-transfected with GFP-cdc25C and increasing concentration of EGFPf-sh-cdc25C. Western blot is showing the reduction in GFP-cdc25C upon expression of sh-cdc25C. (i) Vector control and 14-3-3γ knockdown cells were transfected with the vector control (EGFPf-pTU6) or EGFP-f-shcdc25C. The transfected cells were stained with antibodies to Cep170 and centrosome number was determined in a 100 transfected cells (identified by GFP expression) in three independent experiments. In all cases p values were obtained using a student’s t-test. Scale bars are 10 μm unless mentioned. All the Western blots were run under the same experimental conditions and the full length blots are in Supplementary Fig. 6.
Figure 5. Increased NPM1 phosphorylation at T199 leads to centrosome duplication in 14-3-3γknockdown cells.
(a) Protein extracts from vector control or 14-3-3γ knockdown cells were resolved on SDS-PAGE followed by immuno-blotting with the indicated antibodies. Actin served as loading control. (b,c) HCT116 cells were transfected with mCherry-α-tubulin and co-transfected with either the control plasmid (pCDNA3) or plasmids encoding wild type cdk1 (cdk1) or constitutively active cdk1 (cdk1AF). Post-transfection the cells were stained with antibodies to Cep170 (green) and DAPI (blue) (b). The percentage of mitotic cells with >2 centrosomes was determined in three independent experiments (c). (d) Protein extracts from the vector control and 14-3-3γ knockdown cells were resolved by SDS-PAGE, followed by Western blotting with the indicated antibodies. Note that NPM1 is phosphorylated on T199 to a greater degree in the 14-3-3γ knockdown cells. Actin served as loading control. (e) The 14-3-3γ -knockdown and vector control cells were transfected with either the vector control or FLAG-epitope tagged versions of WT NPM1 or the NPM1 mutants (T199A and T199D). Post transfections, protein extracts prepared from these cells were resolved by SDS-PAGE followed by Western blotting with the indicated antibodies. Western blots for actin serves as loading controls. (f,g) 14-3-3γ-knockdown and vector-control cells, transfected with mCherry-α-tubulin and FLAG-NPM1 constructs, were stained with antibodies to Cep-170, co-stained with DAPI and followed by confocal microscopy (f) to determine the percentage of cells containing >2 centrosomes. The mean and standard deviation of three independent cells is plotted (g) p values were determined using a Student’s t-test (2 sample unequal variance) with p < 0.05. Scale bars indicate 5 μm. All the Western blots were run under the same experimental conditions and the full length blots are in Supplementary Fig. 6.
Figure 6. Over-expression of cdc25C-S216A leads to an increase in multipolar mitoses and a decrease in neoplastic progression.
(a) 14-3-3γ-knockdown and vector control cells at different passages (P) were fixed and stained with antibodies to α-tubulin and Cep-170 and co-stained with DAPI. Arrows indicate centrosome poles. (b,c) The percentage of cells with multi-polar spindles and pseudo bi-polar spindles was determined in three independent experiments and the mean and standard error plotted. (d) 14-3-3γ-knockdown cells were transfected with EGFP, EGFP-cdc25C or EGFP-S216A constructs. Cells were fixed and stained with anti-α-Tubulin antibody and co-stained with DAPI. Arrows indicate spindle poles. (e) The percentage of cells with multi-polar spindles and pseudo bi-polar spindles was determined in three independent experiments and the mean and standard deviation plotted. A significant increase in the number of cells with multi-polar spindles and a corresponding decrease in the number of cells with pseudo-bipolar spindles was observed in cells expressing the two cdc25C constructs at all passages. (f,g) 14-3-3γ-knockdown cells were transfected with doxycycline (Dox) inducible constructs expressing either GFP or EGFP-cdc25C or EGFP-cdc25C-S216A. Post transfection the cells were selected in puromycin to select transfected cells. Transfected cells were grown in the presence or absence of doxycycline and protein extracts were resolved on SDS-PAGE gels followed by Western blotting with the indicated antibodies (f) or the cells were embedded in soft agar in the presence or absence of doxycycline and colony formation determined in three independent experiments. The mean and standard deviation are plotted (g). (h,i) 14-3-3γ-knockdown cells were transfected with doxycycline (Dox) inducible constructs expressing EGFP-cdc25C-S216A. Post selection, cells were injected subcutaneously in Nude mice. One set was given doxycycline in the drinking water (+Dox) and the other set received no doxycycline (−Dox). Tumor volume was measured and the mean and standard error are plotted from 4 × 2 sets of mice at different times post injection. p values were obtained using Student’s t test (2 sample unequal variance). p values <0.05 are indicated by asterisk. All the Western blots were run under the same experimental conditions and the full length blots are in Supplementary Fig. 6.
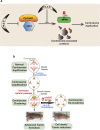
Figure 7. Model for centrosome duplication and reduced tumor formation upon activation of cdc25C.
(a) 14-3-3γ sequesters cdc25C in cytoplasm during S phase and thus cdk1 remains inactive due to the inhibitory phosphorylation at Thr-14 and Tyr-15. As a consequence, NPM1 is not phosphorylated at T199 and remains associated with inter-centriolar linker. (b) Loss of 14-3-3γ causes activation of cdc25C resulting in dephosphorylation and activation of cdk1. Active cdk1 phosphorylates T199 of NPM1. T199 phosphorylation of NPM1 results in its dissociation from centriolar linker. Dissociation of NPM1 from centriolar linker leads to centriole separation (disjunction) and thus provides steric permission for procentriole nucleation and maturation. (c) Expression of active-cdc25C (cdc25C-S216A), in 14-3-3γ-knockdown cells prematurely activates cdk1, which leads to centrosome hyper-duplication through increased phosphorylation of residue T199 in NPM1. (d) Centrosomes cluster with the increase in passage in the 14-3-3γ knockdown cells leading to increased transformation. A decrease in centrosome clustering is observed upon premature activation of cdc25C, resulting in a decrease in tumor growth.
Similar articles
- Deregulation of the centrosome cycle and the origin of chromosomal instability in cancer.
Lingle WL, Lukasiewicz K, Salisbury JL. Lingle WL, et al. Adv Exp Med Biol. 2005;570:393-421. doi: 10.1007/1-4020-3764-3_14. Adv Exp Med Biol. 2005. PMID: 18727509 Review. - 14-3-3γ prevents centrosome duplication by inhibiting NPM1 function.
Bose A, Modi K, Dey S, Dalvi S, Nadkarni P, Sudarshan M, Kundu TK, Venkatraman P, Dalal SN. Bose A, et al. Genes Cells. 2021 Jun;26(6):426-446. doi: 10.1111/gtc.12848. Epub 2021 Apr 14. Genes Cells. 2021. PMID: 33813791 - Disruption of desmosome function leads to increased centrosome clustering in 14-3-3γ-knockout cells with supernumerary centrosomes.
Tilwani S, Gandhi K, Narayan S, Ainavarapu SRK, Dalal SN. Tilwani S, et al. FEBS Lett. 2021 Nov;595(21):2675-2690. doi: 10.1002/1873-3468.14204. Epub 2021 Oct 23. FEBS Lett. 2021. PMID: 34626438 - 14-3-3 proteins mediate the localization of Centrin2 to centrosome.
Bose A, Dalal SN. Bose A, et al. J Biosci. 2019 Jun;44(2):42. J Biosci. 2019. PMID: 31180055 - Centrosome amplification and the origin of chromosomal instability in breast cancer.
Salisbury JL, D'Assoro AB, Lingle WL. Salisbury JL, et al. J Mammary Gland Biol Neoplasia. 2004 Jul;9(3):275-83. doi: 10.1023/B:JOMG.0000048774.27697.30. J Mammary Gland Biol Neoplasia. 2004. PMID: 15557800 Review.
Cited by
- Screening for the Key Proteins Associated with Rete Testis Invasion in Clinical Stage I Seminoma via Label-Free Quantitative Mass Spectrometry.
Borszéková Pulzová L, Roška J, Kalman M, Kliment J, Slávik P, Smolková B, Goffa E, Jurkovičová D, Kulcsár Ľ, Lešková K, Bujdák P, Mego M, Bhide MR, Plank L, Chovanec M. Borszéková Pulzová L, et al. Cancers (Basel). 2021 Nov 8;13(21):5573. doi: 10.3390/cancers13215573. Cancers (Basel). 2021. PMID: 34771736 Free PMC article. - Centrosome amplification: a quantifiable cancer cell trait with prognostic value in solid malignancies.
Mittal K, Kaur J, Jaczko M, Wei G, Toss MS, Rakha EA, Janssen EAM, Søiland H, Kucuk O, Reid MD, Gupta MV, Aneja R. Mittal K, et al. Cancer Metastasis Rev. 2021 Mar;40(1):319-339. doi: 10.1007/s10555-020-09937-z. Epub 2020 Oct 26. Cancer Metastasis Rev. 2021. PMID: 33106971 Free PMC article. Review. - New insights into the biology of acute myeloid leukemia with mutated NPM1.
Brunetti L, Gundry MC, Goodell MA. Brunetti L, et al. Int J Hematol. 2019 Aug;110(2):150-160. doi: 10.1007/s12185-018-02578-7. Epub 2019 Jan 10. Int J Hematol. 2019. PMID: 30632059 Review. - Deep-proteome mapping of WM-266-4 human metastatic melanoma cells: From oncogenic addiction to druggable targets.
Konstantakou EG, Velentzas AD, Anagnostopoulos AK, Litou ZI, Konstandi OA, Giannopoulou AF, Anastasiadou E, Voutsinas GE, Tsangaris GT, Stravopodis DJ. Konstantakou EG, et al. PLoS One. 2017 Feb 3;12(2):e0171512. doi: 10.1371/journal.pone.0171512. eCollection 2017. PLoS One. 2017. PMID: 28158294 Free PMC article. - Differential Subcellular Distribution and Translocation of Seven 14-3-3 Isoforms in Response to EGF and During the Cell Cycle.
Abdrabou A, Brandwein D, Wang Z. Abdrabou A, et al. Int J Mol Sci. 2020 Jan 2;21(1):318. doi: 10.3390/ijms21010318. Int J Mol Sci. 2020. PMID: 31906564 Free PMC article.
References
Publication types
MeSH terms
Substances
LinkOut - more resources
Full Text Sources
Other Literature Sources
Research Materials
Miscellaneous
