β1-C121W Is Down But Not Out: Epilepsy-Associated Scn1b-C121W Results in a Deleterious Gain-of-Function - PubMed (original) (raw)
β1-C121W Is Down But Not Out: Epilepsy-Associated Scn1b-C121W Results in a Deleterious Gain-of-Function
Larisa C Kruger et al. J Neurosci. 2016.
Abstract
Voltage-gated sodium channel (VGSC) β subunits signal through multiple pathways on multiple time scales. In addition to modulating sodium and potassium currents, β subunits play nonconducting roles as cell adhesion molecules, which allow them to function in cell-cell communication, neuronal migration, neurite outgrowth, neuronal pathfinding, and axonal fasciculation. Mutations in SCN1B, encoding VGSC β1 and β1B, are associated with epilepsy. Autosomal-dominant SCN1B-C121W, the first epilepsy-associated VGSC mutation identified, results in genetic epilepsy with febrile seizures plus (GEFS+). This mutation has been shown to disrupt both the sodium-current-modulatory and cell-adhesive functions of β1 subunits expressed in heterologous systems. The goal of this study was to compare mice heterozygous for Scn1b-C121W (Scn1b(+/W)) with mice heterozygous for the Scn1b-null allele (Scn1b(+/-)) to determine whether the C121W mutation results in loss-of-function in vivo We found that Scn1b(+/W) mice were more susceptible than Scn1b(+/-) and Scn1b(+/+) mice to hyperthermia-induced convulsions, a model of pediatric febrile seizures. β1-C121W subunits are expressed at the neuronal cell surface in vivo However, despite this, β1-C121W polypeptides are incompletely glycosylated and do not associate with VGSC α subunits in the brain. β1-C121W subcellular localization is restricted to neuronal cell bodies and is not detected at axon initial segments in the cortex or cerebellum or at optic nerve nodes of Ranvier of Scn1b(W/W) mice. These data, together with our previous results showing that β1-C121W cannot participate in trans-homophilic cell adhesion, lead to the hypothesis that SCN1B-C121W confers a deleterious gain-of-function in human GEFS+ patients.
Significance statement: The mechanisms underlying genetic epilepsy syndromes are poorly understood. Closing this gap in knowledge is essential to the development of new medicines to treat epilepsy. We have used mouse models to understand the mechanism of a mutation in the sodium channel gene SCN1B linked to genetic epilepsy with febrile seizures plus. We report that sodium channel β1 subunit proteins encoded by this mutant gene are expressed at the surface of neuronal cell bodies; however, they do not associate with the ion channel complex nor are they transported to areas of the axon that are critical for proper neuronal firing. We conclude that this disease-causing mutation is not simply a loss-of-function, but instead results in a deleterious gain-of-function in the brain.
Keywords: axon; beta subunit; cell adhesion; epilepsy; febrile seizure; sodium channel.
Copyright © 2016 the authors 0270-6474/16/366213-12$15.00/0.
Figures
Figure 1.
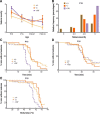
Scn1b+/W GEFS+ mice are more susceptible to heat-induced seizures than are Scn1b+/− and Scn1b+/+ mice. Behavioral seizures were observed and Racine scores recorded by an investigator blinded to genotype. Seizures were induced as described in Materials and Methods. A, Seizure severity recorded for each animal measured according to the modified Racine scale (mean ± SEM). Genotypes were compared at the same age. (Kruskal–Wallis, p < 0.001, Scn1b+/W vs Scn1b+/+; p < 0.05 Scn1b+/W vs Scn1b+/−). B, Histogram of the most severe seizures at P15 showing that 75% of Scn1b+/W GEFS+ mice experienced a seizure of Racine score 6, compared with 25% or 50% of Scn1b+/+ or Scn1b+/−, respectively. C–E, Survival curves to first observed seizure for P15 (C, E) and P16 (D) mice in relation to time (C, D) or BT (E). C, At P15, Scn1b+/W GEFS+ mice experienced seizures sooner in the observation period than the other genotypes (Mantel–Cox, p < 0.0001, Scn1b+/W vs Scn1b+/+; p < 0.0001, Scn1b+/W vs Scn1b+/− mice). D, Difference shown in C was not observed at P16. E, Scn1b+/W GEFS+ mice seized at lower BTs than Scn1b+/+ or Scn1b+/− mice (Mantel–Cox; p < 0.0001, p < 0.01, respectively). Number of animals for the P15, P16, P20–P21, and P30–P33 groups were as follows: Scn1b+/+, n = 22, 24, 20, 25; Scn1b+/−, n = 16, 16, 18, 23; and Scn1b+/W, n = 6, 11, 11, 17, respectively.
Figure 2.
Comparison of β1-C121W and WT β1 protein expression. A, Representative Western blots comparing anti-β1 immunoreactivity in Scn1b+/+ and _Scn1b_W/W mouse brain membrane preparations. β1-C121W polypeptides migrate at a lower apparent molecular weight than WT β1 separated on a 10% SDS-PAGE gel. Immunoreactive bands were quantified using densitometry. Each band density was first normalized to its corresponding α-tubulin signal and β1 levels in _Scn1b_W/W mice were expressed as a percentage of β1 in Scn1b+/+ mice. _Scn1b_W/W mice had 45 ± 10% of Scn1b+/+ β1 expression (2-way ANOVA; p = 0.0001; 3 replicate experiments with 4 animals of each genotype). B, Representative Western blots showing mock-digested, PNGaseF-digested, and control brain membrane inputs from Scn1b+/+ and _Scn1b_W/W brains separated on a 12% SDS-PAGE gel. WT β1 and β1-C121W polypeptides migrate at similar molecular weights after removal of _N_-linked glycosylation by PNGaseF (n = 3). C, Representative Western blots, separated on a 15% SDS-PAGE gel, comparing levels of WT β1 and β1-C121W polypeptides in P14–P15, P17, and >20-week-old Scn1b+/+, Scn1b+/W, and _Scn1b_W/W mice. α-tubulin is shown as a loading control. Every _Scn1b_W/W mouse tested showed the lower molecular band only (P14–P15, n = 5; P17, n = 5). Every Scn1b+/W sample tested showed both bands (P14–P15, n = 11; P17, n = 6; >20 weeks, n = 4).
Figure 3.
WT β1 and β1-C121W polypeptides are expressed at the neuronal cell surface in cultured mouse cortical neurons. Primary cortical neurons were cultured from Scn1b+/+ and _Scn1b_W/W mice. At 16 DIV, surface proteins were labeled with biotin as described in the Materials and Methods. An aliquot of total cell lysate was reserved before performing immunoprecipitation with streptavidin beads to enrich for cell surface proteins. Total cell lysate for Scn1b+/+ and _Scn1b_W/W, along with control brain membrane samples, were separated on a 10% SDS-PAGE gel and immunoblotted with anti-β1 and anti-HSP90 antibodies. Anti-HSP90 immunoreactivity was used as an internal control to ensure enrichment of surface proteins in the biotinylated fraction. n = 2.
Figure 4.
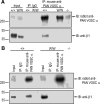
β1-C121W association with VGSC α-subunits is not detectable. Brain membrane proteins from P15 Scn1b+/+ and _Scn1b_W/W animals were immunoprecipitated (IP) with either mouse IgG or mouse antibody against PAN VGSC α subunits. Input samples, IP samples for each genotype, and a control _Scn1b_−/− membrane sample were separated on a 4–15% SDS-PAGE gel and immunoblotted with rabbit anti-PAN VGSC and anti-β1 antibodies. A, Representative Western blot of anti-PAN VGSC and anti-β1 coimmunoprecipitation using equivalent amounts of membrane proteins for each genotype. n = 3. B, Western blot of anti-PAN VGSC and anti-β1 coimmunoprecipitation using twice as much _Scn1b_W/W as Scn1b+/+ membrane protein to have equivalent amounts of β1 protein in the samples (see Fig. 2). Input samples were loaded in the same ratio to reflect the difference in starting protein. n = 1.
Figure 5.
β1-C121W is not expressed at optic nerve nodes of Ranvier. A, Representative images showing that Scn1b+/W and Scn1b+/− mice have decreased anti-β1 immunofluorescence compared with WT. Anti-β1 immunofluorescence in _Scn1b_W/W optic nerve sections is not significantly different from _Scn1b_−/−. B, Quantification, as described in Materials and Methods, of anti-β1 immunofluorescence at optic nerve nodes of Ranvier. Data represent four independent immunohistochemistry experiments, with four to six animals per genotype in total. Each animal was tested in at least three experiments. Linear mixed-model analysis was used to make comparisons between genotypes; see the Materials and Methods for further details. Scale bar, 2 μm.
Figure 6.
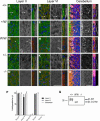
β1-C121W is not expressed at cerebellar or cortical axon initial segments. Representative confocal images of cortical layers II (A, D, G, J, M) and VI (B, E, H, K, N) and Purkinje cells in the cerebellum (C, F, I, L, O) of Scn1b+/+ (A–C), Scn1b+/W (D–F), _Scn1b_W/W (G–I), Scn1b+/− (J–L), and _Scn1b_−/− (M–O) mice. For each genotype and cortical region, the left panel is a merged image of anti-ankyrinG (red), DAPI (blue), and anti-β1 (green) staining; the middle panel is anti-β1 (white) staining; and the right panel is a higher-magnification image of a single AIS with the merged image on the left and anti-β1 staining alone on the right. For cerebellum, merged images show anti-ankyrinG (red)/anti-β1 (green)/anti-calbindin (magenta)/DAPI (blue) staining. Arrows (A–C, F) indicate examples of ankyrinG-positive, β1-positive AISs. Arrowheads (F–I) indicate examples of β1-positive soma in Scn1b+/W and _Scn1b_W/W mice. _Scn1b_W/W and _Scn1b_−/− mice showed no anti-β1 immunofluorescence at the AIS. Scale bars: large, 50 μm; small,10 μm. Three mice of each genotype were tested. P, Quantification of AISs positive for anti-β1 immunofluorescence. For all regions observed, _Scn1b_W/W mice were comparable to _Scn1b_−/− mice and had a >95% reduction in β1-positive AISs compared with Scn1b+/+ mice (p < 0.0001). In layers II and VI, Scn1b+/W mice had slightly fewer β1-positive AISs compared with Scn1b+/+ and Scn1b+/− mice (layer II: 16.6 ± 2.0%, p < 0.0001, 14.0 ± 2.3%, p < 0.0001; layer VI: 3.7 ± 0.8%, p < 0.0001, 3.1 ± 0.9%, p = 0.007, respectively). Q, Western blot showing anti-β1 immunoreactivity in brain membranes from Scn1b+/+, _Scn1b_W/W, and _Scn1b_−/− mice using the D9T5B anti-β1 antibody used for immunofluorescence in Figures 6 and 7.
Figure 7.
β1-C121W is localized at the soma of layer V cortical neurons. Representative confocal images of cortical layer V from Scn1b+/+ (A, B), Scn1b+/W (C, D), _Scn1b_W/W (E, F), Scn1b+/− (G, H), and _Scn1b_−/− (I, J) mice. The left panel for each genotype is a merged image of anti-Ctip2 (red) and anti-β1 (green) staining and the following two panels show anti-β1 (white) followed by anti-Ctip2 (white) staining. Arrowheads indicate examples of anti-β1-positive soma in Scn1b+/W and _Scn1b_W/W mice. Lower-magnification images (A, C, E, G, I) show the layer specificity of β1-positive soma. Higher-magnification images (B, D, F, H, J) showing Ctip2-positive layer V neurons are also presented. Scale bars: A, C, E, G, I, 100 μm; B, D, F, H, J, 20 μm. Three mice of each genotype were tested.
Similar articles
- Sodium channel β1 subunit localizes to axon initial segments of excitatory and inhibitory neurons and shows regional heterogeneity in mouse brain.
Wimmer VC, Harty RC, Richards KL, Phillips AM, Miyazaki H, Nukina N, Petrou S. Wimmer VC, et al. J Comp Neurol. 2015 Apr 1;523(5):814-30. doi: 10.1002/cne.23715. Epub 2015 Jan 14. J Comp Neurol. 2015. PMID: 25421039 - Voltage-gated Na+ channel β1B: a secreted cell adhesion molecule involved in human epilepsy.
Patino GA, Brackenbury WJ, Bao Y, Lopez-Santiago LF, O'Malley HA, Chen C, Calhoun JD, Lafrenière RG, Cossette P, Rouleau GA, Isom LL. Patino GA, et al. J Neurosci. 2011 Oct 12;31(41):14577-91. doi: 10.1523/JNEUROSCI.0361-11.2011. J Neurosci. 2011. PMID: 21994374 Free PMC article. - Differential gene expression profiles of two excitable rat cell lines after over-expression of WT- and C121W-β1 sodium channel subunits.
Baroni D, Moran O. Baroni D, et al. Neuroscience. 2015 Jun 25;297:105-17. doi: 10.1016/j.neuroscience.2015.03.052. Epub 2015 Mar 28. Neuroscience. 2015. PMID: 25827112 - The role of non-pore-forming β subunits in physiology and pathophysiology of voltage-gated sodium channels.
Calhoun JD, Isom LL. Calhoun JD, et al. Handb Exp Pharmacol. 2014;221:51-89. doi: 10.1007/978-3-642-41588-3_4. Handb Exp Pharmacol. 2014. PMID: 24737232 Review. - [Progress in molecular genetics of generalized epilepsy with febrile seizures plus].
Sun HH, Zhang YH. Sun HH, et al. Beijing Da Xue Xue Bao Yi Xue Ban. 2008 Apr;40(2):229-33. Beijing Da Xue Xue Bao Yi Xue Ban. 2008. PMID: 18458705 Review. Chinese.
Cited by
- In silico prediction and in vivo testing of promoters targeting GABAergic inhibitory neurons.
Niibori Y, Duba-Kiss R, Bruder JT, Smith JB, Hampson DR. Niibori Y, et al. Mol Ther Methods Clin Dev. 2023 Feb 4;28:330-343. doi: 10.1016/j.omtm.2023.01.007. eCollection 2023 Mar 9. Mol Ther Methods Clin Dev. 2023. PMID: 36874244 Free PMC article. - Optogenetic and chemogenetic manipulation of seizure threshold in mice.
Kravchenko JA, Goldberg EM, Mattis J. Kravchenko JA, et al. STAR Protoc. 2023 Mar 17;4(1):102019. doi: 10.1016/j.xpro.2022.102019. Epub 2023 Jan 12. STAR Protoc. 2023. PMID: 36640370 Free PMC article. - Sodium channel β1 subunits participate in regulated intramembrane proteolysis-excitation coupling.
Bouza AA, Edokobi N, Hodges SL, Pinsky AM, Offord J, Piao L, Zhao YT, Lopatin AN, Lopez-Santiago LF, Isom LL. Bouza AA, et al. JCI Insight. 2021 Feb 8;6(3):e141776. doi: 10.1172/jci.insight.141776. JCI Insight. 2021. PMID: 33411695 Free PMC article. - SCN1B Genetic Variants: A Review of the Spectrum of Clinical Phenotypes and a Report of Early Myoclonic Encephalopathy.
Zhu Z, Bolt E, Newmaster K, Osei-Bonsu W, Cohen S, Cuddapah VA, Gupta S, Paudel S, Samanta D, Dang LT, Carney PR, Naik S. Zhu Z, et al. Children (Basel). 2022 Oct 1;9(10):1507. doi: 10.3390/children9101507. Children (Basel). 2022. PMID: 36291443 Free PMC article. Review. - Voltage-Gated Sodium Channel β Subunits and Their Related Diseases.
Bouza AA, Isom LL. Bouza AA, et al. Handb Exp Pharmacol. 2018;246:423-450. doi: 10.1007/164_2017_48. Handb Exp Pharmacol. 2018. PMID: 28965169 Free PMC article. Review.
References
Publication types
MeSH terms
Substances
LinkOut - more resources
Full Text Sources
Other Literature Sources
Medical
Molecular Biology Databases
Miscellaneous


