Autophagy induction targeting mTORC1 enhances Mycobacterium tuberculosis replication in HIV co-infected human macrophages - PubMed (original) (raw)
Autophagy induction targeting mTORC1 enhances Mycobacterium tuberculosis replication in HIV co-infected human macrophages
Anna-Maria Andersson et al. Sci Rep. 2016.
Abstract
To survive and replicate in macrophages Mycobacterium tuberculosis (Mtb) has developed strategies to subvert host defence mechanisms, including autophagy. Autophagy induction has the potential to clear Mtb, but little is known about its effect during controlled tuberculosis and HIV co-infection. Mammalian target of rapamycin complex1 (mTORC1) inhibitors were used to induce autophagy in human macrophages pre-infected with HIV-1BaL and infected with a low dose of Mtb (co-infected), or single Mtb infected (single infected). The controlled Mtb infection was disrupted upon mTOR inhibition resulting in increased Mtb replication in a dose-dependent manner which was more pronounced during co-infection. The increased Mtb replication could be explained by the marked reduction in phagosome acidification upon mTOR inhibition. Autophagy stimulation targeting mTORC1 clearly induced a basal autophagy with flux that was unlinked to the subcellular environment of the Mtb vacuoles, which showed a concurrent suppression in acidification and maturation/flux. Overall our findings indicate that mTOR inhibition during Mtb or HIV/Mtb co-infection interferes with phagosomal maturation, thereby supporting mycobacterial growth during low-dose and controlled infection. Therefore pharmacological induction of autophagy through targeting of the canonical mTORC1-pathway should be handled with caution during controlled tuberculosis, since this could have serious consequences for patients with HIV/Mtb co-infection.
Figures
Figure 1. HIV/Mtb co-infection increases LC3B puncta formation and association of LC3B to Mtb phagosomes.
(a) Representative micrographs of LC3B puncta formation (arrowheads) and co-localization to Mtb phagosomes (arrows) in hMDMs infected with HIV (7 days) and/or H37Ra (MOI = 1, 2 h). Blue: DAPI, green: Mtb, red: LC3B (AlexaFluor594). (b) Percentage of LC3B positive hMDMs (3 puncta or more). (c) Percentage of LC3B positive Mtb phagosomes. (d) Percentage of hMDMs infected with the indicated number of bacteria/cell, showing no difference in Mtb infection with or without HIV. Data are mean ± SEM from 10 independent experiments in which 50–100 phagosomes were counted for each condition. *p < 0.05 using paired Student t-test.
Figure 2. mTOR inhibition using rapamycin accelerates H37Ra/H37Rv replication in both single and HIV co-infected hMDMs.
(a) hMDMs were pre-infected with/without HIV for three days before infection with H37Ra or H37Rv (MOI = 1) for 2 hours. Rapamycin (rapa; 1 μM) or 3-MA (1 mM) was added for 1, 3, and 7 days and the signal from luciferase expressing H37Ra or H37Rv in cell lysates and supernatant were measured. “Total bacteria” is the combined supernatant + intracellular pool of bacteria. (b) At the indicated time-points hMDMs (MQ) viability compared to uninfected hMDMs was measured using calcein AM uptake. Data are mean ± SEM from 6 independent experiments. *p < 0.05, **p < 0.01, ***p < 0.001 using paired Student t-test.
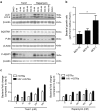
Figure 3. The efficient mTORC1 inhibitor Torin1 causes a dose-dependent increase in Mtb growth in co-infected hMDMs at low MOI.
(a) Representative immunoblots from two independent experiments showing the dose-response of Torin1 and rapamycin on the autophagy markers LC3B and SQSTM1 (p62) and phosphorylation of the mTORC1 downstream targets S6 and 4EBP1, with their respective β-actin loading controls, after 6 h treatment. Full length of the cropped blots are shown in Supplementary Fig. S3. (b) hMDMs were infected at the indicated MOI for 2 h, and then treated with/without 250 nM Torin1 for 3 days. The signal from luciferase expressing H37Rv was quantified, and the graph shows the ratio in total bacteria (lysate + supernatants) for Torin1 treated vs. untreated. Data are mean ± SEM from 6 independent experiments. *p < 0.05 using paired Student t-test. (c) hMDMs were pre-infected with/without HIV for seven days before infected with H37Ra (MOI = 0.2) for 2 hours. hMDMs were then incubated with/without rapamycin or Torin1 at increasing concentrations for 3 days. Graphs show the level of intracellular bacteria in cell lysates compared to day 0. Data are mean ± SEM from triplicate, representative of two independent experiments.
Figure 4. Same effect of early and late autophagy induction in Mtb infected hMDMs.
hMDMs were pre-infected with/without HIV for seven days before infected with H37Rv (MOI = 1) for 2 hours. hMDMs were then incubated with/without Torin1 (250 nM) for 3 days, added either directly or 3 days post infection. The graph shows the level of bacteria in cell lysates and supernatants. Data are mean ± SEM from 5 independent experiments. *p < 0.05, **p < 0.01, ***p < 0.001 were * represent the significance for lysate while (*) represents the significance for total bacteria (lysate + supernatant) using paired Student t-test. (See also Supplementary Fig. S2 for CFU confirmation of these lysates).
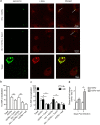
Figure 5. HIV/Mtb co-infection inhibits phagosomal fusion with lysosomes, which is further decreased upon autophagy induction.
(a) Representative micrographs of LysoTracker Deep Red (LTDR) co-localization to phagosomes in hMDMs infected with yeast (MOI = 5) or co-infected with HIV/H37Rv for 6 h (7 days pre-infection with HIV), unstimulated and stimulated with Torin1 (250 nM) the last 4 h. The arrows in the HIV/H37Rv co-infected micrographs indicate co-localization to some of the Mtb phagosomes. All yeast particles in the lower micrographs exhibited co-localization. Green: Mtb or yeast, red: LTDR, yellow: co-localization. (b) Percentage of LTDR co-localization with yeast or H37Ra (MOI = 1) phagosomes 6 h post infection. (c) Percentage of LTDR co-localization with H37Rv (MOI = 1) phagosomes 6 and 24 h post infection. (d) hMDMs were pretreated with bafilomycin (baf; 100 nM) for 1h before infection with luciferase-expressing H37Rv (MOI = 1) for 2 h. Extracellular bacteria were washed away, and baf was re-added every 12 h. The combined luminescence signal from supernatant and hMDM-lysate (=total bacteria) are shown. Data are mean ± SEM with *p < 0.05 and **p < 0.01 using paired Student t-test, of 3 independent experiment for (d) and six independent experiments for LysoTracker data at 6 h and eight independent experiments for 24 h (n = 6 for yeast) in which 100–200 phagosomes were counted for each condition.
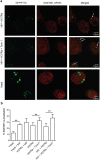
Figure 6. Mtb inhibits autophagic flux, and autophagy induction cause further build-up of SQSTM1 in Mtb phagosomes.
(a) Representative micrographs of SQSTM1 recruitment/accumulation to phagosomes in hMDMs infected with yeast (MOI = 5) or co-infected with HIV and Mtb (MOI = 1) for 6 h (7 days pre-infection with HIV), unstimulated and stimulated with Torin1 (250 nM) the last 4 h. Some cells were treated with bafilomycin (baf; 100 nM) 1 h prior to Mtb/yeast infection. The arrows indicate SQSTM1 co-localization to Mtb or yeast phagosomes. Green: Mtb or yeast, red: SQSTM1. (b) Percentage of SQSTM1 co-localization with yeast or H37Ra phagosomes. Data are mean ± SEM with **p < 0.01 using paired Student t-test, of six independent experiments (n = 3 for yeast+baf) in which 100–300 phagosomes were counted for each condition.
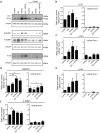
Figure 7. Torin1-induced autophagy and flux is cellular and not localized to Mtb phagosomes
. (a) Representative immunoblots from seven independent experiments showing the autophagy markers LC3B and SQSTM1 (p62) and the phosphorylation of the mTORC1 downstream targets S6 and 4EBP1, with their respective β-actin loading controls. The hMDMs were pre-infected for seven days with HIV before 6 h Mtb infection (MOI = 1), with the addition of Torin1 (250 nM) the last 4 h. Full length of the cropped blots are shown in Supplementary Fig. S6. (b–f) Densitometry measurements normalized to their respective β-actin control and presented as ratio over control without Torin1, shown as mean ± SEM with *p < 0.05 and **p < 0.01 using repeated measurement ANOVA comparing all treatments against its control (n = 7).
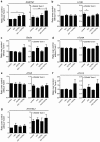
Figure 8. HIV modulated expression of essential ATG genes during co-infection.
hMDMs were pre-infected with/without HIV for seven days before 6 h Mtb infection (MOI = 1), adding Torin1 (250 nM) the last 4 h. Trizol was added to the infected and stimulated hMDMs to extract RNA. RNA was extracted from the same samples as analyzed for protein expression in Fig. 7. The gene expression were analyzed for: (a) SQSTM1, (b) LC3B, (c) Beclin1, (d) ATG4A, (e) ATG5, (f) ATG12, and (g) ATG16L2. The changes in gene expression are presented as ratios over control without Torin1, shown as mean ± SEM with *p < 0.05 and **p < 0.01 using repeated measures ANOVA (n = 5–6).
Similar articles
- The SecA2 pathway of Mycobacterium tuberculosis exports effectors that work in concert to arrest phagosome and autophagosome maturation.
Zulauf KE, Sullivan JT, Braunstein M. Zulauf KE, et al. PLoS Pathog. 2018 Apr 30;14(4):e1007011. doi: 10.1371/journal.ppat.1007011. eCollection 2018 Apr. PLoS Pathog. 2018. PMID: 29709019 Free PMC article. - Vitamin D inhibits human immunodeficiency virus type 1 and Mycobacterium tuberculosis infection in macrophages through the induction of autophagy.
Campbell GR, Spector SA. Campbell GR, et al. PLoS Pathog. 2012;8(5):e1002689. doi: 10.1371/journal.ppat.1002689. Epub 2012 May 10. PLoS Pathog. 2012. PMID: 22589721 Free PMC article. - Noncanonical Inhibition of mTORC1 by Coxiella burnetii Promotes Replication within a Phagolysosome-Like Vacuole.
Larson CL, Sandoz KM, Cockrell DC, Heinzen RA. Larson CL, et al. mBio. 2019 Feb 5;10(1):e02816-18. doi: 10.1128/mBio.02816-18. mBio. 2019. PMID: 30723133 Free PMC article. - [Protective immunity against Mycobacterium tuberculosis].
Kawamura I. Kawamura I. Kekkaku. 2006 Nov;81(11):687-91. Kekkaku. 2006. PMID: 17154048 Review. Japanese. - Tuberculosis and the art of macrophage manipulation.
Upadhyay S, Mittal E, Philips JA. Upadhyay S, et al. Pathog Dis. 2018 Jun 1;76(4):fty037. doi: 10.1093/femspd/fty037. Pathog Dis. 2018. PMID: 29762680 Free PMC article. Review.
Cited by
- The Role of mTOR in Mycobacterium tuberculosis Infection.
Patel A, Nguyen L, Shea C, Singh S, Venketaraman V. Patel A, et al. Biomedicines. 2024 Oct 1;12(10):2238. doi: 10.3390/biomedicines12102238. Biomedicines. 2024. PMID: 39457551 Free PMC article. Review. - Contextual influence of mammalian macro-autophagy in virus-bacteria coinfected cell phenotypes.
Viret C, Lavedrine A, Lamiral G, Rozières A, Faure M. Viret C, et al. PLoS Pathog. 2023 Sep 21;19(9):e1011625. doi: 10.1371/journal.ppat.1011625. eCollection 2023 Sep. PLoS Pathog. 2023. PMID: 37733691 Free PMC article. No abstract available. - Autophagy and inflammation in chronic respiratory disease.
Racanelli AC, Kikkers SA, Choi AMK, Cloonan SM. Racanelli AC, et al. Autophagy. 2018;14(2):221-232. doi: 10.1080/15548627.2017.1389823. Epub 2018 Feb 8. Autophagy. 2018. PMID: 29130366 Free PMC article. Review. - Species dependent impact of helminth-derived antigens on human macrophages infected with Mycobacterium tuberculosis: Direct effect on the innate anti-mycobacterial response.
Aira N, Andersson AM, Singh SK, McKay DM, Blomgran R. Aira N, et al. PLoS Negl Trop Dis. 2017 Feb 13;11(2):e0005390. doi: 10.1371/journal.pntd.0005390. eCollection 2017 Feb. PLoS Negl Trop Dis. 2017. PMID: 28192437 Free PMC article. - Host-Directed Therapy in Tuberculosis: Targeting Host Metabolism.
Kim JS, Kim YR, Yang CS. Kim JS, et al. Front Immunol. 2020 Aug 13;11:1790. doi: 10.3389/fimmu.2020.01790. eCollection 2020. Front Immunol. 2020. PMID: 32903583 Free PMC article. Review.
References
- World Health Organization (WHO). Global tuberculosis report 2013. (2013) Available at: http://apps.who.int/iris/bitstream/10665/91355/1/9789241564656_eng.pdf (Accessed: 10/11/2015).
- Maartens G., Decloedt E. & Cohen K. Effectiveness and safety of antiretrovirals with rifampicin: crucial issues for high-burden countries. Antivir. Ther. (Lond.) 14, 1039–43 (2009). - PubMed
- McIlleron H., Meintjes G., Burman W. & Maartens G. Complications of antiretroviral therapy in patients with tuberculosis: drug interactions, toxicity, and immune reconstitution inflammatory syndrome. J. Infect. Dis. 196 Suppl 1, S63–75 (2007). - PubMed
- Korbel D. S., Schneider B. E. & Schaible U. E. Innate immunity in tuberculosis: myths and truth. Microbes Infect. 10, 995–1004 (2008). - PubMed
- Meerak J., Wanichwecharungruang S. & Palaga T. Enhancement of immune response to a DNA vaccine against Mycobacterium tuberculosis Ag85B by incorporation of an autophagy inducing system. Vaccine 31, 784–790 (2013). - PubMed
MeSH terms
Substances
LinkOut - more resources
Full Text Sources
Other Literature Sources
Medical
Miscellaneous


