PRKAA/AMPK restricts HBV replication through promotion of autophagic degradation - PubMed (original) (raw)
. 2016 Sep;12(9):1507-20.
doi: 10.1080/15548627.2016.1191857. Epub 2016 Jun 15.
Kefei Yuan 1, Li Zhou 1 2, Kui Wang 1, Hai-Ning Chen 3, Yunlong Lei 4, Jiang Lan 1, Qinqin Pu 1, Wei Gao 1, Lu Zhang 1, Guobo Shen 1, Qifu Li 2, Hengyi Xiao 5, Hong Tang 6, Rong Xiang 7, Mingliang He 8, Pinghui Feng 9, Edouard C Nice 10, Yuquan Wei 1, Haiyuan Zhang 2, Jiayin Yang 11, Canhua Huang 1
Affiliations
- PMID: 27305174
- PMCID: PMC5082782
- DOI: 10.1080/15548627.2016.1191857
PRKAA/AMPK restricts HBV replication through promotion of autophagic degradation
Na Xie et al. Autophagy. 2016 Sep.
Abstract
Adenosine monophosphate-activated protein kinase (AMPK) is a crucial energy sensor that maintains cellular energy homeostasis. AMPK plays a critical role in macroautophagy/autophagy, and autophagy facilitates hepatitis B virus (HBV) replication. To date, the intrinsic link among AMPK, autophagy and HBV production remains to be elucidated. Here, we demonstrate that PRKAA (a catalytic subunit of AMPK) is activated in response to HBV-induced oxidative stress, which in turn decreases the production of HBV. Mechanistic studies reveal that the autophagy machinery is associated with the inhibitory effect of PRKAA/AMPK on HBV production. Activation of PRKAA/AMPK promotes autolysosome-dependent degradation through stimulation of cellular ATP levels, which then leads to the depletion of autophagic vacuoles. Taken together, our data suggest that the activation of AMPK might be a stress response of host cells to restrict virus production through promotion of autophagic degradation. These findings therefore indicate that AMPK could provide a potential therapeutic target for HBV infection.
Keywords: adenosine monophosphate-activated protein kinase; adenosine triphosphate; autophagy; hepatitis B virus; oxidative stress.
Figures
Figure 1.
PRKAA is activated in response to HBV-induced ROS accumulation. (A) HepAD38 cells were grown with tetracycline (Tet+) or without tetracycline for 10 d. Control cells (HepG2 or HepAD38 [Tet+] cells), and HBV-producing cells (HepG2.2.15 or HepAD38 cells) were lysed and analyzed by immunoblot with the indicated antibodies. Relative intensity of the band was quantified by normalization to PRKAA using ImageJ software. p-, phosphorylated. (B) The phosphorylation levels of PRKAA (Thr172) in HBV-infected (HBV+) and HBV noninfected (HBV−) liver samples were determined by immunoblot. Densitometry quantification of the band intensities in Fig. S2 was carried out using ImageJ software and was shown as a percentage of relative densitometry normalized to ACTB. The mean ± SD densities were displayed in relation to HBV noninfected (HBV−) tissues. (C) The ROS level was monitored with an oxidant-sensitive fluorescent probe, DCFH-DA. Data were shown as mean ± SD of 3 independent experiments. (D) Cells were mock-treated or treated with NAC (10 mM) for 2 h followed by immunoblot analysis. (E) Cells were treated with DMSO or STO-609 (10 μg/mL) for 2 h followed by immunoblot analysis. Relative intensity of the indicated protein bands was quantified by normalization to PRKAA using ImageJ software. *, p < 0.05; **, p < 0.01.
Figure 2.
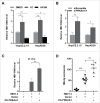
PRKAA activation restricts HBV production. (A, B) HepG2.2.15 and HepAD38 cells were incubated with DMSO, compound C (CC, 10 µM), or AICAR (1 mM) for 24 h (A), or transfected with either siScramble or si_PRKAA1/2_ for 48 h (B), respectively. HBV progeny DNA in the supernatant was quantified by real-time PCR. The values obtained from the control group were set at 1.0. *, p < 0.05; **, p < 0.01. (C, D) BALB/c mice were hydrodynamically injected with vector, HBV1.3 and vector, HBV1.3 and/or DN-PRKAA1. HBV serum titer was determined by quantitative real-time PCR at d 3 post injection (C). The expressions of HBcAg in liver tissues were determined by immunochemical analysis (D). Data are presented as mean ± SD (n = 6); **, p < 0.01; ***, p < 0.001.
Figure 3.
Autophagy is involved in PRKAA-mediated regulation of HBV production. (A) Control cells (HepAD38 [Tet+] or HepG2 cells), and HBV-producing cells (HepAD38 or HepG2.2.15 cells) were lysed and analyzed by immunoblot. Relative intensity of LC3B-II was quantified by normalization to ACTB using ImageJ software. The mean ± SD densities were displayed in relation to HepG2. (B) Immunofluorescence analysis of LC3B puncta in HepG2, HepAD38 [Tet+], HepG2.2.15 and HepAD38 cells. The fluorescent signal was visualized using a Leica DM2500 microscope. The number of LC3B puncta (mean ± SD) was quantified by ImageJ software. Scale bar: 10 μm. **, p < 0.01. (C) Cells were treated with either DMSO or CC (10 µM) for 24 h after pretreatment for 2 h with 3-MA (5 mM). (D) HepG2.2.15 and HepAD38 cells were transfected with siScramble or si_ATG5_ for 48 h, and then treated with DMSO or CC (10 µM) for 24 h. (E) HepG2.2.15 and HepAD38 cells were transfected with siScramble, si_PRKAA1/2_, or cotransfected with si_PRKAA1/2_ and si_ATG5_. HBV progeny DNA in the supernatant was quantified by real-time PCR. The values obtained from the control group were set at 1.0. Values were means ± SD, n = 3 per group. *, p < 0.05; **, p < 0.01.
Figure 4.
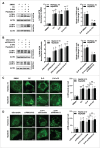
Inhibition of PRKAA contributes to autophagosome accumulation. (A) HepG2.2.15 or HepAD38 cells were treated with different concentrations of CC (0, 2.5, 5.0, 10, 20 μM) for 24 h, and cell lysates were subjected to immunoblot assay. (B) HepG2.2.15 or HepAD38 cells were treated with DMSO or 10 μM CC as indicated (0, 12, 24, 36 and 48 h) and subjected to immunoblot assay. (C) Immunofluorescence analysis of LC3B puncta in cells that were treated with DMSO or CC (10 μM) for 24 h. (D) Immunoblot analysis of total protein extracts from HepG2.2.15 and HepAD38 cells transfected with siScramble or si_PRKAA1/2_ for 48 h, respectively. Relative intensity of LC3B-II was quantified by normalization to ACTB using ImageJ software. (E) Immunofluorescence analysis of LC3B puncta in cells that were transfected with siScramble, or si_PRKAA1/2_ for 48 h. The number of LC3B puncta (mean ± SD) was quantified by ImageJ software. Values are means ± SD (n = 30). (F) Immunoblot analysis of total protein extracts from HepG2.2.15 and HepAD38 cells transfected with vector or plasmid encoding CA-PRKAA1 for 48 h. Relative intensity of LC3B-II was quantified by normalization to ACTB using ImageJ software. *, p < 0.05; **, p < 0.01; ***, p < 0.001 (in HepG2.2.15); #, p < 0.05; ##, p < 0.01; ###, p < 0.001 (in HepAD38). Scale bar: 10 μm.
Figure 5.
PRKAA activity is required for autophagic flux. (A) Immunoblot analysis of total protein extracts from cells treated with DMSO (0.1%), or CC (10 μM) in the absence or presence of E-64d (E, 10 µg/mL) and pepstatin A (P, 10 µg/mL) for 24 h. (B) HepG2.2.15 or HepAD38 cells were transfected with siScramble or si_PRKAA1/2_ for 48 h, and then treated with E-64d (E, 10 µg/mL) and pepstatin A (P, 10 µg/mL) for 24 h. The total protein extracts were subjected to immunoblot assay. Relative intensity of LC3B-II was quantified by normalization to ACTB by ImageJ software. Values were means ± SD (n = 3). (C) Immunofluorescence analysis of LC3B puncta in cells that were incubated with DMSO (0.1%), CC (10 µM), or CC in combination with E-64d and pepstatin A (E+P, 10 µg/mL each) for another 24 h. (D) Immunofluorescence analysis of LC3B puncta in cells that were transfected with siScramble or si_PRKAA1/2_, followed by incubation with E-64d and pepstatin A (E+P, 10 µg/mL each) for another 24 h. The fluorescent signal was visualized using a Leica DM2500 microscope. The number of LC3B puncta (mean ± SD) was quantified by ImageJ software. Values were means ± SD (n = 30). *, p < 0.05; **, p < 0.01; ***, p < 0.001 (in HepG2.2.15); #, p < 0.01; ##, p < 0.01; ###, p < 0.001 (in HepAD38); NS, non-significant. Scale bar: 10 μm.
Figure 6.
Active PRKAA enables the degradation of autophagosomes. (A) Colocalization analysis of LC3B (green) and SQSTM1 (red) in HepG2.2.15 or HepAD38 cells treated with DMSO (0.1%), compound C (CC, 10 μM), or transfected with siScramble or si_PRKAA1/2_ for 48 h, respectively. Scale bar: 10 μm. (B) Colocalization analysis of LC3B (green) and LAMP1 (red) in HepG2.2.15 or HepAD38 cells treated with DMSO (0.1%), compound C (CC, 10 μM), or transfected with siScramble or si_PRKAA1/2_ for 48 h, respectively. Scale bar: 10 μm. (C) Colocalization analysis of SQSTM1 (green) and LAMP1 (red) in HepG2.2.15 or HepAD38 cells treated with DMSO (0.1%), compound C (CC, 10 μM), or transfected with siScramble or si_PRKAA1/2_ for 48 h, respectively. The quantitative colocalization analysis of 2 immunoreactivities was performed with ImageJ Colocalization Finder plug-in software. Scale bar: 10 μm. (D) Autolysosomes stained with DQ-BSA in cells treated with DMSO (0.1%), compound C (CC, 10 μM), bafilomycin A1 (100 nM), cultured in medium without fetal bovine serum (Starvation), or transfected with si_PRKAA1/2_, respectively. Accumulation of fluorescent signal, indicating the autolysosomal proteolysis of DQ-BSA, was recorded by microscopy. Scale bar: 20 μm. **, p < 0.01; ***, p < 0.001 (in HepG2.2.15); ##, p < 0.01; ###, p < 0.001 (in HepAD38).
Figure 7.
ATP is required for PRKAA-mediated autophagosome degradation. (A) Immunoblot analysis for LC3B in HepAD38 cells and HepG2.2.15 cells treated with DMSO (0.1%, lane 1), compound C (CC, 10 μM, lane 2), CC plus 5′-ATP-Na2 (0.25 mM, lane 3), CC plus 5′-ATP-Na2 (0.5 mM, lane 4), 5′-ATP-Na2 (0.25 mM, lane 5), and 5′-ATP-Na2 (0.5 mM, lane 6), respectively. Quantification of the LC3B-II was quantified by normalization to ACTB by ImageJ software. (B) HepG2.2.15 and HepAD38 cells were incubated with CC (10 µM) or CC together with 5′-ATP-Na2 (ATP, 0.25 mM) for 24 h, and subjected to the immunofluorescence detection of LC3B. **, p < 0.01 (in HepG2.2.15); ##, p < 0.01 (in HepAD38). Scale bar: 10 μm. (C) HepG2.2.15 and HepAD38 cells were incubated with DMSO, CC (10 µM) or CC together with 5′-ATP-Na2 (ATP, 0.25 mM) for 24 h, and followed by the proteinase K (ProK) protection assay for SQSTM1. WCL, whole cell lysate; P, pellet fraction. (D) Autolysosomes stained with DQ-BSA in cells treated with DMSO (0.1%), compound C (CC, 10 μM), or CC together with 5′-ATP-Na2 (ATP, 0.25 mM) for 24 h, respectively. Scale bar: 20 μm. (E) HepG2.2.15 and HepAD38 cells were incubated with DMSO, CC (10 µM) or CC together with 5′-ATP-Na2 (ATP, 0.25 mM) for 24 h, and subjected to immunoblot analysis for CTSD. (F) HepG2.2.15 and HepAD38 cells were incubated with DMSO, CC (10 µM), 5′-ATP-Na2 (ATP, 0.25 mM) or CC in combination with 5′-ATP-Na2 for 24 h. HBV titer in the supernatant was quantified by real-time PCR. The values obtained from DMSO-treated samples were set at 1.0. Values were means ± standard error. n = 3 per group. *, p < 0.05; **, p <0.01; NS, non-significant.
Figure 8.
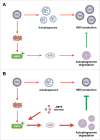
Diagram showing the proposed mechanism by which PRKAA/AMPK inhibits HBV production through promotion of autophagosome degradation. (A) Under normal conditions, AMPK is activated in response to HBV replication-induced production of cellular ROS. The activated AMPK promotes autophagic degradation and restricts the production of HBV. (B) Upon treatment with AMPK activator, increased activity of AMPK elevates the cellular ATP levels, leading to the promotion of autophagic degradation and elimination of HBV production.
Similar articles
- DNA-dependent protein kinase regulates lysosomal AMP-dependent protein kinase activation and autophagy.
Puustinen P, Keldsbo A, Corcelle-Termeau E, Ngoei K, Sønder SL, Farkas T, Kaae Andersen K, Oakhill JS, Jäättelä M. Puustinen P, et al. Autophagy. 2020 Oct;16(10):1871-1888. doi: 10.1080/15548627.2019.1710430. Epub 2020 Jan 26. Autophagy. 2020. PMID: 31983282 Free PMC article. - Glucosamine promotes hepatitis B virus replication through its dual effects in suppressing autophagic degradation and inhibiting MTORC1 signaling.
Lin Y, Wu C, Wang X, Liu S, Zhao K, Kemper T, Yu H, Li M, Zhang J, Chen M, Zhu Y, Chen X, Lu M. Lin Y, et al. Autophagy. 2020 Mar;16(3):548-561. doi: 10.1080/15548627.2019.1632104. Epub 2019 Jun 23. Autophagy. 2020. PMID: 31204557 Free PMC article. - Cisplatin induces autophagy to enhance hepatitis B virus replication via activation of ROS/JNK and inhibition of the Akt/mTOR pathway.
Chen X, Hu Y, Zhang W, Chen K, Hu J, Li X, Liang L, Cai X, Hu J, Wang K, Huang A, Tang N. Chen X, et al. Free Radic Biol Med. 2019 Feb 1;131:225-236. doi: 10.1016/j.freeradbiomed.2018.12.008. Epub 2018 Dec 11. Free Radic Biol Med. 2019. PMID: 30550853 - 5'-Adenosine monophosphate-activated protein kinase--mammalian target of rapamycin axis as therapeutic target for age-related macular degeneration.
Hyttinen JM, Petrovski G, Salminen A, Kaarniranta K. Hyttinen JM, et al. Rejuvenation Res. 2011 Dec;14(6):651-60. doi: 10.1089/rej.2011.1220. Epub 2011 Oct 18. Rejuvenation Res. 2011. PMID: 22007913 Review. - The lysosome: a crucial hub for AMPK and mTORC1 signalling.
Carroll B, Dunlop EA. Carroll B, et al. Biochem J. 2017 Apr 13;474(9):1453-1466. doi: 10.1042/BCJ20160780. Biochem J. 2017. PMID: 28408430 Review.
Cited by
- Sequential activation of ERα-AMPKα signaling by the flavonoid baicalin down-regulates viral HNF-dependent HBV replication.
Niu YJ, Xia CJ, Ai X, Xu WM, Lin XT, Zhu YQ, Zhu HY, Zeng X, Cao ZL, Zhou W, Huang H, Shi XL. Niu YJ, et al. Acta Pharmacol Sin. 2024 Oct 30. doi: 10.1038/s41401-024-01408-3. Online ahead of print. Acta Pharmacol Sin. 2024. PMID: 39478159 - NDP52 mediates an antiviral response to hepatitis B virus infection through Rab9-dependent lysosomal degradation pathway.
Cui S, Xia T, Zhao J, Ren X, Wu T, Kameni M, Guo X, He L, Guo J, Duperray-Susini A, Levillayer F, Collard JM, Zhong J, Pan L, Tangy F, Vidalain PO, Zhou D, Jiu Y, Faure M, Wei Y. Cui S, et al. Nat Commun. 2023 Dec 19;14(1):8440. doi: 10.1038/s41467-023-44201-2. Nat Commun. 2023. PMID: 38114531 Free PMC article. - Tubeimoside-I sensitizes colorectal cancer cells to chemotherapy by inducing ROS-mediated impaired autophagolysosomes accumulation.
Yan J, Dou X, Zhou J, Xiong Y, Mo L, Li L, Lei Y. Yan J, et al. J Exp Clin Cancer Res. 2019 Aug 14;38(1):353. doi: 10.1186/s13046-019-1355-0. J Exp Clin Cancer Res. 2019. PMID: 31412953 Free PMC article. - AMPK: guardian of metabolism and mitochondrial homeostasis.
Herzig S, Shaw RJ. Herzig S, et al. Nat Rev Mol Cell Biol. 2018 Feb;19(2):121-135. doi: 10.1038/nrm.2017.95. Epub 2017 Oct 4. Nat Rev Mol Cell Biol. 2018. PMID: 28974774 Free PMC article. Review. - Restoration of RNA helicase DDX5 suppresses hepatitis B virus (HBV) biosynthesis and Wnt signaling in HBV-related hepatocellular carcinoma.
Mani SKK, Yan B, Cui Z, Sun J, Utturkar S, Foca A, Fares N, Durantel D, Lanman N, Merle P, Kazemian M, Andrisani O. Mani SKK, et al. Theranostics. 2020 Sep 1;10(24):10957-10972. doi: 10.7150/thno.49629. eCollection 2020. Theranostics. 2020. PMID: 33042264 Free PMC article.
References
- Seeger C, Mason WS. Hepatitis B virus biology. Microbiol Mol Biol Rev 2000; 64:51-68; PMID:10704474; http://dx.doi.org/10.1128/MMBR.64.1.51-68.2000 - DOI - PMC - PubMed
- Yuen MF, Lai CL, Hepatitis B. in 2014: HBV research moves forward–receptors and reactivation. Nat Rev Gastroenterol Hepatol 2015; 12:70-2; PMID:25511530 - PubMed
- Geier A. Hepatitis B virus: the “metabolovirus” highjacks cholesterol and bile acid metabolism. Hepatology 2014; 60:1458-60; PMID:24829054 - PubMed
- Jones RG, Plas DR, Kubek S, Buzzai M, Mu J, Xu Y, Birnbaum MJ, Thompson CB. AMP-activated protein kinase induces a p53-dependent metabolic checkpoint. Mol Cell 2005; 18:283-93; PMID:15866171; http://dx.doi.org/10.1016/j.molcel.2005.03.027 - DOI - PubMed
- Hardie DG, Ross FA, Hawley SA. AMPK: a nutrient and energy sensor that maintains energy homeostasis. Nat Rev Mol Cell Biol 2012; 13:251-62; PMID:22436748; http://dx.doi.org/10.1038/nrm3311 - DOI - PMC - PubMed
MeSH terms
Substances
LinkOut - more resources
Full Text Sources
Other Literature Sources
Miscellaneous


