Iron overload causes endolysosomal deficits modulated by NAADP-regulated 2-pore channels and RAB7A - PubMed (original) (raw)
Iron overload causes endolysosomal deficits modulated by NAADP-regulated 2-pore channels and RAB7A
Belén Fernández et al. Autophagy. 2016 Sep.
Abstract
Various neurodegenerative disorders are associated with increased brain iron content. Iron is known to cause oxidative stress, which concomitantly promotes cell death. Whereas endolysosomes are known to serve as intracellular iron storage organelles, the consequences of increased iron on endolysosomal functioning, and effects on cell viability upon modulation of endolysosomal iron release remain largely unknown. Here, we show that increasing intracellular iron causes endolysosomal alterations associated with impaired autophagic clearance of intracellular protein aggregates, increased cytosolic oxidative stress and increased cell death. These effects are subject to regulation by NAADP, a potent second messenger reported to target endolysosomal TPCNs (2-pore channels). Consistent with endolysosomal iron storage, cytosolic iron levels are modulated by NAADP, and increased cytosolic iron is detected when overexpressing active, but not inactive TPCNs, indicating that these channels can modulate endolysosomal iron release. Cell death triggered by altered intralysosomal iron handling is abrogated in the presence of an NAADP antagonist or when inhibiting RAB7A activity. Taken together, our results suggest that increased endolysosomal iron causes cell death associated with increased cytosolic oxidative stress as well as autophagic impairments, and these effects are subject to modulation by endolysosomal ion channel activity in a RAB7A-dependent manner. These data highlight alternative therapeutic strategies for neurodegenerative disorders associated with increased intracellular iron load.
Keywords: NAADP; RAB7A; TPCN1; TPCN2; iron; lysosome; neurodegeneration.
Figures
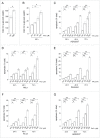
Figure 1.
Increased iron is associated with neurodegeneration in vivo and mediates cytotoxicity in vitro. (A) Total iron levels (normalized to tissue wet weight) of substantia nigra samples from age-matched control and Lewy-body disease patients (LBD) as analyzed by atomic absorption spectroscopy. Graph represents mean ± SEM (n = 5; *, P < 0.05). (B) Total iron levels as analyzed by atomic absorption spectroscopy from HEK293T cells left either untreated (ctrl), or treated with the indicated concentrations of FAC for 48 h. Graph represents mean ± SEM (n = 3; *, P < 0.05). FAC treatment causes a time- and dose-dependent increase in apoptosis in HEK293T cells (C), HeLa cells (D), primary dermal fibroblasts (E) or dopaminergic PC12 cells (F). (G) FeCl2 treatment causes a time- and dose-dependent increase in apoptosis in HEK293T cells. Graphs represent mean ± SEM (n = 3; *, P < 0.05, **, P < 0.005).
Figure 2.
Increased iron load causes oxidative damage. (A) Oxyblot assay performed on HEK293T cells in the absence (ctrl) or presence of FAC treatment as indicated. DNPH, 2,4-dinitrophenylhydrazine. (B) Oxyblot levels were quantified (fold change as compared to control), and bars represent mean ± SEM (n = 3; **, P < 0.005). (C) Representative experiment detecting oxidation in HEK293T cells upon addition of hydrogen peroxide, and reversal by DTT. Images were taken using an emission wavelength of 535 nm and 400 nm and 480 nm excitation wavelengths. Images were taken at 1 min intervals, and ratiometric values are depicted in pseudocolor calibrated using the color scale on the right. Concentration of chemicals and times of addition are indicated by arrows. Scale bar: 10 μm. (D) Quantification of oxidation induced by either hydrogen peroxide or increasing concentrations of FAC applied during 48 h, respectively. Bars represent mean ± SEM (n = 3; *, P < 0.05, **, P < 0.005).
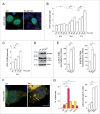
Figure 3.
Iron overload impairs autophagic flux. (A) Representative examples of HEK293T cells transfected with GFP-LC3B either in the absence (ctrl) or presence of FAC for 48 h. Scale bar: 10 μm. Quantification of the number of GFP-LC3B dots per cell in the absence (ctrl) or presence of the indicated amounts and times of FAC (B) or FeCl2 application (C). Bars represent mean ± SEM (n = 3; *, P < 0.05; **, P < 0.001). (D) Cells were either left untreated (ctrl) or treated as indicated, and extracts analyzed for endogenous LC3B-I/-II, SQSTM1 and TUBA. (E) Quantification of LC3B-II:TUBA or SQSTM1:TUBA from experiments of the type described in (D). Bars represent mean ± SEM (n = 3; *, P < 0.05; **, P < 0.005). (F) Representative examples of HEK293T cells transfected with td-tag-LC3B either in the absence (ctrl) or presence of FAC for 48 h. Scale bar: 10 μm. (G) Left: Quantification of the number of yellow and red td-tag-LC3B dots per cell either in the absence (ctrl) or presence of torin 1, FAC or FeCl2 as indicated. Right: Quantification of the percentage of yellow td-tag-LC3B dots per cell either in the absence (ctrl) or presence of torin 1, FAC or FeCl2 as indicated. Bars represent mean ± SEM (n = 3; ***, P < 0.001).
Figure 4.
Increased intracellular iron causes deficits in clearance of aggregate-prone protein associated with increased cell death. (A) Representative examples of HEK293T cells transfected with HTTQ74-HA either in the absence (ctrl) or presence of FAC for 48 h. Arrows point to aggregates. Scale bar: 10 μm. (B) Quantification of the percentage of cells displaying HTTQ74-HA aggregates in the absence (ctrl) or presence of the indicated amounts of FAC applied during 48 h. Bars represent mean ± SEM (n = 3; *, P < 0.005; **, P < 0.001). (C) Quantification of the percentage of apoptosis in untransfected or HTTQ74-HA expressing cells either in the absence (ctrl) or presence of the indicated amounts of FAC applied during 48 h. Bars represent mean ± SEM (n = 3; *, P < 0.05). (D) Cells were pretreated in the presence or absence of 50 μM FAC during 24 h before transfection as indicated, followed by quantification of the percentage of cells displaying aggregates (left) and apoptosis (right). Bars represent mean ± SEM (n = 3; *, P < 0.05; **, P < 0.005). (E) Cells were transfected as indicated, and either left untreated, or treated with 50 μM FAC during the last 24 h as indicated, followed by quantification of the percentage of cells displaying aggregates (left) and apoptosis (right). Bars represent mean ± SEM (n = 3; ***, P < 0.001).
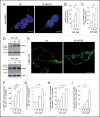
Figure 5.
Increasing intracellular iron causes endolysosomal alterations. (A) Representative images of HEK293T cells stained with LAMP2 either in the absence (ctrl) or presence of FAC incubation for 48 h. Scale bar: 10 μm. (B) Quantification of the number of LAMP2-positive structures per cell in the absence or presence of FAC treatment. Bars represent mean ± SEM (n = 3; *, P < 0.05; **, P < 0.005). (C) Quantification of the size of LAMP2-positive structures in the absence or presence of the indicated concentrations of FAC. Bars represent mean ± SEM (n = 3; *, P < 0.05; **, P < 0.005). (D) Cells were treated with FAC for 48 h, and extracts analyzed for levels of LAMP2 (top) or LAMP1 (bottom), with TUBA as loading control. (E) Representative images of live HEK293T cells transfected with LAMP1-GFP and either left untreated (ctrl) or incubated with FAC for 48 h. Scale bar: 10 μm. (F) Quantification of the number of LAMP1-GFP-positive structures per cell equal or smaller than 1 μm in diameter, in the absence or presence of the indicated concentrations of FAC for 48 h. Bars represent mean ± SEM (n = 3; **, P < 0.005). (G) Quantification of the number of LAMP1-GFP-positive structures per cell bigger than 1 μm in diameter, in the absence or presence of the indicated concentrations of FAC for 48 h. Bars represent mean ± SEM (n = 3; *, P < 0.05; **, P < 0.001). (H) Quantification of the percentage of transfected cells with at least one LAMP1-GFP-positive structure with a diameter of between 1 to 3 μm. Bars represent mean ± SEM (n = 3; *, P < 0.05). (I) Quantification of the percentage of transfected cells with at least one LAMP1-GFP-positive structure with a diameter larger than 3 μm. Bars represent mean ± SEM (n = 3; *, P < 0.05).
Figure 6.
Increasing intracellular iron causes alterations in endolysosomal pH. (A) Representative images of live HEK293T cells either left untreated (ctrl), or treated with BAF, FAC or FeCl2 as indicated, followed by staining with acridine orange. Scale bar: 10 μm. (B) Quantification of the number of acridine orange-positive structures per cell in the absence (ctrl) or presence of treatments as indicated. Bars represent mean ± SEM (n = 3; **, P < 0.005; ***, P < 0.001).
Figure 7.
NAADP-mediated modulation of effects associated with increased iron load. Dose-dependent increase in FAC-mediated (A) or FeCl2-mediated (B) apoptosis in HEK293T cells is potentiated upon 12 h incubation with 100 nM NAADP-AM, and abolished upon 12 h incubation with 1 μM Ned-19. Graphs represent mean ± SEM (n = 3; *, P < 0.05; **, P < 0.005). (C) Quantification of oxidation induced by either hydrogen peroxide or increasing concentrations of FAC (48 h) in the absence or presence of NAADP-AM or Ned-19, respectively. NAADP-AM slightly potentiates, and Ned-19 potently inhibits FAC-mediated oxidation. Bars represent mean ± SEM (n = 3; *, P < 0.05, **, P < 0.005). FAC-mediated (D) or FeCl2-mediated (E) increase in autophagosome numbers is potentiated by NAADP-AM and reverted by Ned-19. Quantification of the number of GFP-LC3B dots per cell in the absence or presence of FAC, and in the absence or presence of NAADP-AM or Ned-19, respectively. Bars represent mean ± SEM (n = 3; *, P < 0.05; **, P < 0.005). (F) Quantification of the percentage of cells displaying HTTQ74-HA aggregates (left) or apoptosis (right) in the absence or presence of FAC, and in the absence or presence of NAADP-AM. Bars represent mean ± SEM (n = 3; *, P < 0.05; **, P < 0.005). (G) Quantification of the percentage of cells displaying HTTQ74-HA aggregates (left) or apoptosis (right) in the absence or presence of FAC, and in the absence or presence of Ned-19. Bars represent mean ± SEM (n = 3; *, P < 0.05; **, P < 0.005).
Figure 8.
Expression of TPCN channels potentiates FAC-mediated cell death in a NAADP- and Ned-19-sensitive manner. Quantification of apoptosis mediated by FAC (A) or FeCl2 (B) in HEK293T cells expressing either wild-type or dominant-negative TPCN1 or TPCN2 channels, respectively, in either the absence or presence of 100 nM NAADP-AM. Bars represent mean ± SEM (n = 3; *, P < 0.05). Quantification of apoptosis mediated by FAC (C) or FeCl2 (D) in cells expressing either wild-type or dominant-negative TPCN1 or TPCN2 channels, respectively, in either the absence or presence of 1 μM Ned-19. Bars represent mean ± SEM (n = 3; *, P < 0.05).
Figure 9.
TPCN2 and MCOLN1 function independently from each other to mediate iron-induced cytotoxicity. Cells were cotransfected with the indicated constructs, and cell death analyzed in either the absence or presence of 50 μM FAC for 48 h. Bars represent mean ± SEM (n = 3; *, P < 0.05; **, P < 0.005).
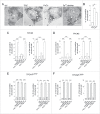
Figure 10.
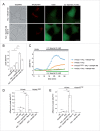
NAADP-mediated alterations in endolysosomal iron levels in control and TPCN-expressing cells. (A) Representative images of HEK293T cells either left untreated (ctrl), treated with FAC, FeCl2 or Fe3+-dextran as indicated, and stained for intracellular iron using the sulphide-silver method. Scale bar: 10 μm. (B) Quantification of the number of iron-positive structures per cell in the absence (ctrl) or presence of 48 h treatment with 50 μM FAC or 50 μM FeCl2 as indicated. Bars represent mean ± SEM (n = 3; **, P < 0.005). Quantification of the number of iron-positive structures in cells expressing TPCN1 (C) or TPCN2 (D) in the absence (ctrl) or presence of 48 h treatment with 50 μM FAC or 50 μM FeCl2, respectively, and in the presence or absence of 100 nM NAADP-AM or 1 μM Ned-19 for the last 12 h as indicated. Bars represent mean ± SEM (n = 3; ***, P < 0.001). Quantification of the number of iron-positive structures in cells expressing dominant-negative mutants of TPCN1 (E) or TPCN2 (F) in the absence (ctrl) or presence of 48 h treatment with 50 μM FAC or 50 μM FeCl2, respectively, and in the presence or absence of 100 nM NAADP-AM or 1 μM Ned-19 for the last 12 h as indicated. Bars represent mean ± SEM (n = 3; ***, P < 0.001).
Figure 11.
TPCN channel-expressing cells have increased free iron levels modulated in an NAADP-mediated fashion. (A) Representative examples of dequenching of TPCN2-RFP-transfected HEK293T cells upon incubation with FAC and either 100 nM NAADP-AM (top row), or 100 nM NAADP-AM and 1 μM Ned-19 (bottom row). Transfected cells show more dequenching of the iron-sensitive fluorescence as compared to untransfected cells, and dequencing is abolished in the presence of 1 μM Ned-19. Dequenching was achieved by preloading the cells with an iron-sensitive dye (Phen Green SK), followed by addition of the membrane-permeable transition metal chelator, 2,2´-bipyridyl, which chelates free cellular iron, causing a concomitant increase in Phen Green SK fluorescence. Scale bar: 10 μm. (B) Quantification of the 2,2´-bipyridyl-induced normalized change of peak fluorescence (peak deltaF:F0) in the absence or presence of FAC, NAADP-AM or Ned-19 as indicated. Bars represent mean ± SEM (n = 3; *, P < 0.05; **, P < 0.005). (C) Example of 2,2´-bipyridyl-induced normalized changes in fluorescence (deltaF:F0) in either wild-type or mutant TPCN2-expressing cells (average of 30 to 40 cells each) in the presence of FAC and NAADP-AM as indicated. Green trace indicates absence of fluorescence dequenching upon addition of 4,4´-bipyridyl, a 2,2´-bipyridyl analog which cannot bind iron. (D) Quantification of the 2,2´-bipyridyl-induced normalized change of peak fluorescence (peak deltaF:F0) in either wild-type or mutant TPCN2-expressing cells, in the absence or presence of FAC, NAADP-AM or Ned-19 as indicated. Bars represent mean ± SEM (n = 3; *, P < 0.05; **, P < 0.005). (E) Quantification of iron dequenching as described above in either wild-type or mutant TPCN1-expressing cells. Bars represent mean ± SEM (n = 3; *, P < 0.05).
Figure 12.
RAB7A expression modulates iron-mediated cytotoxicity in TPCN-channel-expressing cells. (A) Quantification of apoptosis in HEK293T cells coexpressing either wild-type or mutant TPCN2, and either empty control vector (pCMV), RAB7A, GTP-locked RAB7AQ67L or GTP binding-defective RAB7AT22N, respectively, in the absence or presence of FAC. Bars represent mean ± SEM (n = 3; *, P < 0.05). (B) Quantification of apoptosis in cells coexpressing the indicated constructs, and either in the absence or presence of FAC and NAADP-AM as indicated. Bars represent mean ± SEM (n = 3; *, P < 0.05). (C) Quantification of apoptosis in cells coexpressing the indicated constructs, and either in the absence or presence of FAC and Ned-19 as indicated. Bars represent mean ± SEM (n = 3; *, P < 0.05). (D) Quantification of apoptosis in the absence or presence of FAC in cells coexpressing either wild-type or mutant TPCN1, and either empty vector or various RAB7A constructs as described above. Bars represent mean ± SEM (n = 3; *, P < 0.05).
Figure 13.
TPCN2-mediated modulation of iron-induced cytotoxicity is dependent on RAB7A activity. (A) Quantification of apoptosis in HEK293T cells expressing TPCN2, a TPCN2 mutant defective in RAB7A binding (TPCN2[3A]) or a dominant-negative pore mutant (TPCN2L265P), in the absence or presence of FAC, respectively. Bars represent mean ± SEM (n = 3; **, P < 0.005). (B) Quantification of apoptosis in cells coexpressing wild-type or RAB7A binding-deficient TPCN2 (TPCN2[3A]) and either empty vector (pCMV), wild-type RAB7A, GTP-locked RAB7A (RAB7AQ67L) or GTP binding-defective RAB7A (RAB7AT22N) in the absence or presence of FAC. Bars represent mean ± SEM (n = 3; **, P < 0.005). (C) Quantification of apoptosis in cells cotransfected with TPCN2 and either empty vector (pCMV), or various RAB7A constructs as indicated, in the absence or presence of FAC and 5 μM CID1067700 for 4 h as indicated. Bars represent mean ± SEM (n = 3; **, P < 0.005).
Similar articles
- Purified TPC isoforms form NAADP receptors with distinct roles for Ca(2+) signaling and endolysosomal trafficking.
Ruas M, Rietdorf K, Arredouani A, Davis LC, Lloyd-Evans E, Koegel H, Funnell TM, Morgan AJ, Ward JA, Watanabe K, Cheng X, Churchill GC, Zhu MX, Platt FM, Wessel GM, Parrington J, Galione A. Ruas M, et al. Curr Biol. 2010 Apr 27;20(8):703-9. doi: 10.1016/j.cub.2010.02.049. Epub 2010 Mar 25. Curr Biol. 2010. PMID: 20346675 Free PMC article. - NAADP as an intracellular messenger regulating lysosomal calcium-release channels.
Galione A, Morgan AJ, Arredouani A, Davis LC, Rietdorf K, Ruas M, Parrington J. Galione A, et al. Biochem Soc Trans. 2010 Dec;38(6):1424-31. doi: 10.1042/BST0381424. Biochem Soc Trans. 2010. PMID: 21118101 - Two-pore channels at the intersection of endolysosomal membrane traffic.
Marchant JS, Patel S. Marchant JS, et al. Biochem Soc Trans. 2015 Jun;43(3):434-41. doi: 10.1042/BST20140303. Biochem Soc Trans. 2015. PMID: 26009187 Free PMC article. Review. - The Two-pore channel (TPC) interactome unmasks isoform-specific roles for TPCs in endolysosomal morphology and cell pigmentation.
Lin-Moshier Y, Keebler MV, Hooper R, Boulware MJ, Liu X, Churamani D, Abood ME, Walseth TF, Brailoiu E, Patel S, Marchant JS. Lin-Moshier Y, et al. Proc Natl Acad Sci U S A. 2014 Sep 9;111(36):13087-92. doi: 10.1073/pnas.1407004111. Epub 2014 Aug 25. Proc Natl Acad Sci U S A. 2014. PMID: 25157141 Free PMC article. - TPCs: Endolysosomal channels for Ca2+ mobilization from acidic organelles triggered by NAADP.
Zhu MX, Ma J, Parrington J, Galione A, Evans AM. Zhu MX, et al. FEBS Lett. 2010 May 17;584(10):1966-74. doi: 10.1016/j.febslet.2010.02.028. Epub 2010 Feb 14. FEBS Lett. 2010. PMID: 20159015 Free PMC article. Review.
Cited by
- Role of Divalent Cations in HIV-1 Replication and Pathogenicity.
Khan N, Chen X, Geiger JD. Khan N, et al. Viruses. 2020 Apr 21;12(4):471. doi: 10.3390/v12040471. Viruses. 2020. PMID: 32326317 Free PMC article. Review. - Structural mechanisms of phospholipid activation of the human TPC2 channel.
She J, Zeng W, Guo J, Chen Q, Bai XC, Jiang Y. She J, et al. Elife. 2019 Mar 12;8:e45222. doi: 10.7554/eLife.45222. Elife. 2019. PMID: 30860481 Free PMC article. - MPSI Manifestations and Treatment Outcome: Skeletal Focus.
De Ponti G, Donsante S, Frigeni M, Pievani A, Corsi A, Bernardo ME, Riminucci M, Serafini M. De Ponti G, et al. Int J Mol Sci. 2022 Sep 22;23(19):11168. doi: 10.3390/ijms231911168. Int J Mol Sci. 2022. PMID: 36232472 Free PMC article. Review. - Two-Pore Channels and Parkinson's Disease: Where's the Link?
Rivero-Ríos P, Fernández B, Madero-Pérez J, Lozano MR, Hilfiker S. Rivero-Ríos P, et al. Messenger (Los Angel). 2016 Jun 1;5(1-2):67-75. doi: 10.1166/msr.2016.1051. Messenger (Los Angel). 2016. PMID: 28529828 Free PMC article. - Imbalance of Essential Metals in Traumatic Brain Injury and Its Possible Link with Disorders of Consciousness.
Squitti R, Reale G, Tondolo V, Crescenti D, Bellini S, Moci M, Caliandro P, Padua L, Rongioletti M. Squitti R, et al. Int J Mol Sci. 2023 Apr 6;24(7):6867. doi: 10.3390/ijms24076867. Int J Mol Sci. 2023. PMID: 37047843 Free PMC article. Review.
References
- Ward RJ, Zucca FA, Duyn JH, Crichton RR, Zecca L. The role of iron in brain ageing and neurodegenerative disorders. Lancet Neurol 2014; 13:1045-60; PMID:25231526; http://dx.doi.org/10.1016/S1474-4422(14)70117-6 - DOI - PMC - PubMed
- Dusek P, Jankovic J, Le W. Iron dysregulation in movement disorders. Neurobiol Dis 2012; 46:1-18; PMID:22266337; http://dx.doi.org/10.1016/j.nbd.2011.12.054 - DOI - PubMed
- Hentze MW, Muckenthaler MU, Galy B, Camaschella C. Two to tango: regulation of Mammalian iron metabolism. Cell 2010; 142:24-38; PMID:20603012; http://dx.doi.org/10.1016/j.cell.2010.06.028 - DOI - PubMed
- Blaby-Haas CE, Merchant SS. Lysosome-related organelles as mediators of metal homeostasis. J Biol Chem 2014; 289:28129-36; PMID:25160625; http://dx.doi.org/10.1074/jbc.R114.592618 - DOI - PMC - PubMed
- Nixon RA, Yang DS, Lee JH. Neurodegenerative lysosomal disorders: a continuum from development to late age. Autophagy 2008; 4:590-9; PMID:18497567; http://dx.doi.org/10.4161/auto.6259 - DOI - PubMed
MeSH terms
Substances
Grants and funding
- BB/G013721/1/BB_/Biotechnology and Biological Sciences Research Council/United Kingdom
- H-1202/PUK_/Parkinson's UK/United Kingdom
- K-1107/PUK_/Parkinson's UK/United Kingdom
- K-1412/PUK_/Parkinson's UK/United Kingdom
LinkOut - more resources
Full Text Sources
Other Literature Sources
Research Materials
