Protective responses to sublytic complement in the retinal pigment epithelium - PubMed (original) (raw)
Protective responses to sublytic complement in the retinal pigment epithelium
Li Xuan Tan et al. Proc Natl Acad Sci U S A. 2016.
Abstract
The retinal pigment epithelium (RPE) is a key site of injury in inherited and age-related macular degenerations. Abnormal activation of the complement system is a feature of these blinding diseases, yet how the RPE combats complement attack is poorly understood. The complement cascade terminates in the cell-surface assembly of membrane attack complexes (MACs), which promote inflammation by causing aberrant signal transduction. Here, we investigated mechanisms crucial for limiting MAC assembly and preserving cellular integrity in the RPE and asked how these are compromised in models of macular degeneration. Using polarized primary RPE and the pigmented Abca4(-/-) Stargardt disease mouse model, we provide evidence for two protective responses occurring within minutes of complement attack, which are essential for maintaining mitochondrial health in the RPE. First, accelerated recycling of the membrane-bound complement regulator CD59 to the RPE cell surface inhibits MAC formation. Second, fusion of lysosomes with the RPE plasma membrane immediately after complement attack limits sustained elevations in intracellular calcium and prevents mitochondrial injury. Cholesterol accumulation in the RPE, induced by vitamin A dimers or oxidized LDL, inhibits these defense mechanisms by activating acid sphingomyelinase (ASMase), which increases tubulin acetylation and derails organelle traffic. Defective CD59 recycling and lysosome exocytosis after complement attack lead to mitochondrial fragmentation and oxidative stress in the RPE. Drugs that stimulate cholesterol efflux or inhibit ASMase restore both these critical safeguards in the RPE and avert complement-induced mitochondrial injury in vitro and in Abca4(-/-) mice, indicating that they could be effective therapeutic approaches for macular degenerations.
Keywords: cholesterol; drug targets; inflammation; macular degeneration; mitochondria.
Conflict of interest statement
Conflict of interest statement: L.X.T., K.A.T., and A.L. are listed on a patent application filed by the Wisconsin Alumni Research Foundation at the University of Wisconsin–Madison on the use of acid sphingomyelinase inhibitors to treat macular degenerations. This patent has not yet been issued.
Figures
Fig. 1.
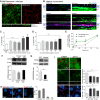
CD59 recycling and MAC deposition after complement attack. (A) Single-plane en face and x-z images of CD59 immunostaining (blue) in mouse RPE flatmounts. Apical and middle slices are shown. LAMP1 (red) labels lysosomes. (B) Immunofluorescence images of surface CD59 (green) in polarized primary RPE ± A2E. In the x-z images, ZO-1 (red) demarcates apical (Ap) and basolateral (Bl) cell membranes. (C) Recovery of surface CD59 fluorescence after PI-PLC treatment in control RPE (Baseline, gray squares), after complement (NHS, green circles), and cells with A2E alone (blue asterisks) or exposed to complement (A2E + NHS, red triangles). Mean ± SEM, n ≥ 60 cells per condition. *P < 0.05; **P < 0.001, and ***P < 0.0001 relative to baseline values. (D) MAC immunostaining (red) on the RPE surface after 10% NHS for 10 min. ZO-1 is in purple. (E) Quantification of MAC deposition. *P < 0.05, mean ± SEM, n ≥ 150 cells per condition.
Fig. S1.
(A) Single-plane en face and x-z confocal images of CD59 immunofluorescence (green) in flatmounts of mouse RPE. Top (at the apical surface) and middle (through the center of the cell) slices are shown. α-Catenin (red) was used to label the basolateral membrane of the RPE. (B) Immunostaining (green) of wild-type and Abca4 −/− retinal cryosections. Left images show nonspecific signal with mouse IgG. Images on the right show CD59 immunofluorescence (green) using a mouse monoclonal antibody. White arrows: apical surface of the RPE. AF, lipofuscin autofluorescence (pink); CC, choriocapillaris; nuclear marker DAPI (blue). (C and D) Cytotoxicity as a function of lactate dehydrogenase release after exposure to increasing concentrations of NHS (C) or purified C9 in 10% C9-depleted serum (D). Mean ± SEM, n = 3. **P < 0.001 relative to 50% heat-inactivated NHS. n.s., not significant. (E) Recovery of CD59 fluorescence at the cell surface after PI-PLC treatment in RPE exposed to 10% C9-depleted serum (gray squares) or to 60 µg/mL C9 in C9-depleted serum for 10 min (green circles). Experiments were performed in the presence of cycloheximide to prevent new protein synthesis. For each condition, values are normalized to surface CD59 levels at t = 0 after PI-PLC treatment. Mean ± SEM, n ≥ 240 cells per condition. *P < 0.05. (F) Representative immunoblot and quantification of CD59 protein levels in primary porcine RPE monolayers treated or not with A2E. Chronic: 50 nM A2E for 3 wk; acute: 10 µM A2E for 6 h followed by a 48-h chase (20). Mean ± SEM, n = 3. *P < 0.05. (G) Representative immunoblot and quantification of CD59 protein levels in RPE from wild-type and Abca4 −/− mice. RPE65 is the loading control. Mean ± SEM, n = 3. *P < 0.05. (H) Images of MACs (red) on the RPE surface after exposure to 10% C9-depleted serum or 60 µg/mL C9 in 10% C9-depleted serum for 10 min. ZO-1 is in purple, and DAPI is in blue. Graph shows quantification of MAC deposition on cells exposed to 60 µg/mL C9 in C9-depleted serum. A total of 206 cells were analyzed. The image on the Right shows mouse IgG staining as a negative control. (I) Immunofluorescence images of acetylated tubulin (green, Top), CD59 (green, Middle), and C5b-9 (red, Bottom) in primary RPE treated with 2.5 µM U18666A or 500 nM tubacin for 16 h. For CD59 quantification, Mean ± SEM of ≥ 180 cells per condition. *P < 0.01. For MAC quantification, cells with ≥10 MACs per cell are presented as mean ± SEM, n ≥ 150 cells per condition. *P < 0.005 relative to control cells exposed to NHS.
Fig. S2.
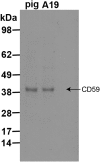
Validation of the CD59 antibody (clone MEM43) in porcine RPE. Representative immunoblot comparing primary porcine RPE and human ARPE-19 cell lysates is shown. The MEM43 clone recognizes an epitope in CD59 (specific residues W40, L53) that is conserved in both pig and humans.
Fig. 2.
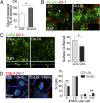
Excess RPE cholesterol increases susceptibility to complement. (A) Total cholesterol in polarized primary RPE treated with LDL or OxLDL. Mean ± SEM, n = 4 independent experiments. *P < 0.01. Immunostaining of acetylated tubulin (B) and CD59 (C), both green, in RPE treated with LDL or OxLDL. ZO-1 is in red. For quantification in C, mean ± SEM, ≥ 120 cells per condition. *P < 0.01. (D) MAC immunostaining and quantification (red) on the RPE surface after exposure to 10% NHS for 10 min. ZO-1 is in purple. Mean ± SEM, n ≥ 150 cells per condition. **P < 0.001.
Fig. 3.
Exposure to complement stimulates lysosome exocytosis. (A) Stills from TIRF imaging of pHluorin-Syt7 (green) in RPE exposed to 10% NHS. Images shown were captured immediately after NHS was added (t = 0 s) and 300 s later. See Movie S1 (control cells) and Movie S2 (cells with A2E). Arrowheads and dashed ellipses denote areas with increased pHluorin signal indicating lysosome fusion. Cumulative number of events (B) and event frequency in control RPE and RPE with A2E (C). Mean ± SEM, ***P < 0.0001. (D) Surface LAMP2 immunolabeling (green) after 10% NHS for 10 min. ZO-1 is in red. (E) β-Hex activity in apical and basal media from cells exposed to 10% NHS or heat-inactivated NHS (HI-NHS). Mean ± SEM, n = 5. **P < 0.001 relative to all other conditions, one-way ANOVA with Bonferroni's post hoc test. (F) Number of lysosomes within 500 nm of the plasma membrane in primary RPE, n = 30 cells per group. **P < 0.005.
Fig. S3.
(A) Immunofluorescence images of surface LAMP2 labeling (green) on the surface of live cells after exposure to either 10% C9-depleted serum or 60 µg/mL C9 in 10% C9-depleted serum for 10 min. Phalloidin is in red. (B) Stills from live imaging of Lysosensor (green) labeling of lysosomes in control RPE monolayers or after lysosome ablation. The vacuolar ATPase inhibitor bafilomycin A1 was used as a positive control. (C) Stills from live imaging and quantitation of recycling endosomes labeled with Alexa488-Transferrin (green) in control RPE or after lysosome ablation; n.s., not significant. In B and C, CellMask (red) was used to label the plasma membrane. (D) Immunofluorescence images of surface LAMP2 labeling (green) after exposure to 60 µg/mL C9 in control cells and after lysosome ablation. Phalloidin (red) was used to demarcate cell boundaries. (E) Stills from live imaging of Fluo-4 NW to measure calcium influx in control and lysosome-ablated cells after addition of 10% NHS.
Fig. 4.
Persistent sublytic MAC causes mitochondrial damage in the RPE. (A) Surface LAMP2 labeling (green) after exposure to 10% NHS in control cells and after lysosome ablation. Phalloidin (red) labels the actin cytoskeleton and demarcates cell boundaries. (B) Representative single-cell recording of intracellular calcium measured by Fluo-4 NW fluorescence in control (green curve) and lysosome-ablated (red curve) cells immediately after addition of 10% NHS. (C) Surface rendering of mitochondrial volume in RPE-expressing mito-RFP. Control and lysosome-ablated cells were exposed to 10% NHS. Color bar shows decreasing mitochondrial volume from red to violet (indicating increasing mitochondrial fragmentation). (D) Quantification of the number of mitochondrial fragments after NHS exposure. **P < 0.005, 25 cells per condition. (E) Surface rendering of mitochondrial volume as in C. (F) Quantification of the number of mitochondrial fragments after NHS exposure. *P < 0.05, n ≥ 31 cells. (G) Representative immunoblot and quantification of OPA1 protein levels normalized to β-tubulin in primary polarized RPE after complement attack. Mean ± SEM, n = 3. **P < 0.005. (H) Representative immunoblot and quantification of OPA1 protein levels normalized to RPE65 in RPE from wild-type and Abca4 −/− mice. Mean ± SEM, n = 3. *P < 0.05. (I) Stills from live imaging of CellROX labeling to monitor reactive oxygen species (green) in polarized primary RPE after exposure to 10% NHS for 10 min. (J) Quantitation of CellROX fluorescence. Mean ± SEM, n = 3 independent experiments. *P < 0.05.
Fig. S4.
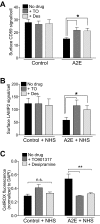
(A) Quantification of surface CD59 immunostaining in polarized primary RPE cells, untreated or treated with either the LXR agonist TO901317 (TO) or the ASMase inhibitor desipramine (Des). Mean fluorescence ± SEM, n = 100 cells per condition. *P < 0.05. (B) Quantification of surface LAMP2 fluorescence after exposure to 10% NHS alone or after treatment with TO or Des. Mean ± SEM, n = 150 cells per condition. *P < 0.05. (C) Quantification of ROS using CellRox before and after exposure to NHS ± TO or Des. Mean ± SEM, n = 3. **P < 0.005, one-way ANOVA with Bonferroni's post hoc test.
Fig. 5.
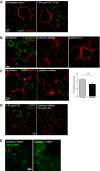
Cholesterol removal or ASMase inhibition restores protective responses in the RPE. (A) Representative x-z scans of surface CD59 immunostaining (green) in polarized primary RPE cells (±A2E) untreated, or treated with either TO901317 (TO) or desipramine (Des). ZO-1 is in red. (B) Appearance of LAMP2 (green) on the plasma membrane after exposure to 10% NHS alone or after treatment with TO or Des. (C) Total cholesterol in the RPE of _Abca4_−/− mice administered either vehicle or TO (20 mg/kg, i.p.). Mean ± SEM, n = 4 animals per condition. *P < 0.05. (D) Single-plane en face and x-z confocal images of CD59 (blue) immunostaining in RPE flatmounts at the apical (Ap) surface in vehicle- or TO-treated Abca4 −/− mice. (E) Representative immunoblot and quantification of OPA1 protein levels normalized to RPE65 in RPE from _Abca4_−/− mice administered either vehicle or TO. Mean ± SEM, n = 4 animals per condition. *P < 0.05.
Similar articles
- Complement system dysregulation and inflammation in the retinal pigment epithelium of a mouse model for Stargardt macular degeneration.
Radu RA, Hu J, Yuan Q, Welch DL, Makshanoff J, Lloyd M, McMullen S, Travis GH, Bok D. Radu RA, et al. J Biol Chem. 2011 May 27;286(21):18593-601. doi: 10.1074/jbc.M110.191866. Epub 2011 Apr 4. J Biol Chem. 2011. PMID: 21464132 Free PMC article. - Aberrant early endosome biogenesis mediates complement activation in the retinal pigment epithelium in models of macular degeneration.
Kaur G, Tan LX, Rathnasamy G, La Cunza N, Germer CJ, Toops KA, Fernandes M, Blenkinsop TA, Lakkaraju A. Kaur G, et al. Proc Natl Acad Sci U S A. 2018 Sep 4;115(36):9014-9019. doi: 10.1073/pnas.1805039115. Epub 2018 Aug 20. Proc Natl Acad Sci U S A. 2018. PMID: 30126999 Free PMC article. - Membrane Attack Complex Mediates Retinal Pigment Epithelium Cell Death in Stargardt Macular Degeneration.
Ng ESY, Kady N, Hu J, Dave A, Jiang Z, Pei J, Gorin MB, Matynia A, Radu RA. Ng ESY, et al. Cells. 2022 Nov 2;11(21):3462. doi: 10.3390/cells11213462. Cells. 2022. PMID: 36359858 Free PMC article. - Should I stay or should I go? Trafficking of sub-lytic MAC in the retinal pigment epithelium.
Lakkaraju A, Toops KA, Xu J. Lakkaraju A, et al. Adv Exp Med Biol. 2014;801:267-74. doi: 10.1007/978-1-4614-3209-8_34. Adv Exp Med Biol. 2014. PMID: 24664707 Review. - Mechanisms of mitochondrial dysfunction and their impact on age-related macular degeneration.
Kaarniranta K, Uusitalo H, Blasiak J, Felszeghy S, Kannan R, Kauppinen A, Salminen A, Sinha D, Ferrington D. Kaarniranta K, et al. Prog Retin Eye Res. 2020 Nov;79:100858. doi: 10.1016/j.preteyeres.2020.100858. Epub 2020 Apr 13. Prog Retin Eye Res. 2020. PMID: 32298788 Free PMC article. Review.
Cited by
- Osmotic and hypoxic induction of the complement factor C9 in cultured human retinal pigment epithelial cells: Regulation of VEGF and NLRP3 expression.
Hollborn M, Ackmann C, Kuhrt H, Doktor F, Kohen L, Wiedemann P, Bringmann A. Hollborn M, et al. Mol Vis. 2018 Jul 28;24:518-535. eCollection 2018. Mol Vis. 2018. PMID: 30090015 Free PMC article. - Atlas of Human Retinal Pigment Epithelium Organelles Significant for Clinical Imaging.
Pollreisz A, Neschi M, Sloan KR, Pircher M, Mittermueller T, Dacey DM, Schmidt-Erfurth U, Curcio CA. Pollreisz A, et al. Invest Ophthalmol Vis Sci. 2020 Jul 1;61(8):13. doi: 10.1167/iovs.61.8.13. Invest Ophthalmol Vis Sci. 2020. PMID: 32648890 Free PMC article. - Action of the Terminal Complement Pathway on Cell Membranes.
Ho BHT, Spicer BA, Dunstone MA. Ho BHT, et al. J Membr Biol. 2025 Mar 23. doi: 10.1007/s00232-025-00343-6. Online ahead of print. J Membr Biol. 2025. PMID: 40122920 Review. - Apolipoprotein ε in Brain and Retinal Neurodegenerative Diseases.
Abyadeh M, Gupta V, Paulo JA, Sheriff S, Shadfar S, Fitzhenry M, Amirkhani A, Gupta V, Salekdeh GH, Haynes PA, Graham SL, Mirzaei M. Abyadeh M, et al. Aging Dis. 2023 Aug 1;14(4):1311-1330. doi: 10.14336/AD.2023.0312-1. Aging Dis. 2023. PMID: 37199411 Free PMC article. Review. - Kaposi's Sarcoma-Associated Herpesvirus and Host Interaction by the Complement System.
Yoo SM, Lee MS. Yoo SM, et al. Pathogens. 2020 Apr 3;9(4):260. doi: 10.3390/pathogens9040260. Pathogens. 2020. PMID: 32260199 Free PMC article. Review.
References
- McHarg S, Clark SJ, Day AJ, Bishop PN. Age-related macular degeneration and the role of the complement system. Mol Immunol. 2015;67(1):43–50. - PubMed
Publication types
MeSH terms
Substances
LinkOut - more resources
Full Text Sources
Other Literature Sources
Medical
Molecular Biology Databases
Miscellaneous

