The novel monoclonal antibody 9F5 reveals expression of a fragment of GPNMB/osteoactivin processed by furin-like protease(s) in a subpopulation of microglia in neonatal rat brain - PubMed (original) (raw)
The novel monoclonal antibody 9F5 reveals expression of a fragment of GPNMB/osteoactivin processed by furin-like protease(s) in a subpopulation of microglia in neonatal rat brain
Kohichi Kawahara et al. Glia. 2016 Nov.
Abstract
To differentiate subtypes of microglia (MG), we developed a novel monoclonal antibody, 9F5, against one subtype (type 1) of rat primary MG. The 9F5 showed high selectivity for this cell type in Western blot and immunocytochemical analyses and no cross-reaction with rat peritoneal macrophages (Mφ). We identified the antigen molecule for 9F5: the 50- to 70-kDa fragments of rat glycoprotein nonmetastatic melanoma protein B (GPNMB)/osteoactivin, which started at Lys(170) . In addition, 9F5 immunoreactivity with GPNMB depended on the activity of furin-like protease(s). More important, rat type 1 MG expressed the GPNMB fragments, but type 2 MG and Mφ did not, although all these cells expressed mRNA and the full-length protein for GPNMB. These results suggest that 9F5 reactivity with MG depends greatly on cleavage of GPNMB and that type 1 MG, in contrast to type 2 MG and Mφ, may have furin-like protease(s) for GPNMB cleavage. In neonatal rat brain, amoeboid 9F5+ MG were observed in specific brain areas including forebrain subventricular zone, corpus callosum, and retina. Double-immunοstaining with 9F5 antibody and anti-Iba1 antibody, which reacts with MG throughout the CNS, revealed that 9F5+ MG were a portion of Iba1+ MG, suggesting that MG subtype(s) exist in vivo. We propose that 9F5 is a useful tool to discriminate between rat type 1 MG and other subtypes of MG/Mφ and to reveal the role of the GPNMB fragments during developing brain. GLIA 2016;64:1938-1961.
Keywords: GPNMB/osteoactivin; development; microglial heterogeneity; retinal pigment epithelium.
© 2016 The Authors. Glia Published by Wiley Periodicals, Inc.
Figures
Figure 1
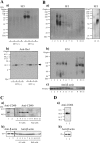
Analysis of 9F5 selectivity for rat type 1 microglia (MG) by Western blot (WB) analysis. A: WB analyses with 9F5 (a) and anti‐Iba1 antibody (b) under DTT (+) (lanes 1–4) and DTT (−) (lanes 5–8) conditions. Cell extracts (20 µg) were from rat type 1 MG (lanes 1, 5), lipopolysaccharide (LPS)‐stimulated rat type 1 MG (lanes 2, 6), rat type 2 MG (lanes 3, 7), and interleukin (IL)−4‐stimulated rat type 2 MG (lanes 4, 8). B: WB analyses with 9F5(a), ED1 (b), and anti‐β‐actin (c) antibodies under DTT (−) conditions. Extracts (20 µg) were from mouse 6‐3 MG (lane 1), mouse Ra2 MG (lane 2), rat type 1 MG (lanes 3, 13), LPS‐stimulated rat type 1 MG (lane 4), rat type 2 MG (lane 5), IL‐4‐stimulated rat type 2 MG (lane 6), rat neurons (lane 7), astrocytes (lane 8), peritoneal rat macrophages (Mφ) (lane 9), LPS‐stimulated peritoneal rat Mφ (lane 10), thioglycolate‐elicited rat Mφ (lane 11), and rat neuroepithelial cells (lane 12). C, D: WB analyses with anti‐CD40 (Ca), anti‐CD86 (Da), or anti‐β‐actin (Cb, Db) antibodies. Extracts (40 µg) were from rat type 1 MG (lane 1) or rat type 2 MG (lane 2).Cell extracts from 6‐3 and Ra2 were used as positive and negative controls for immunoblotting with anti‐CD40 antibody. The 6–3 and Ra2 cells were treated with LPS [0 µg ml−1 (lane 3, 8), 0.01 µg ml−1 (lane 4, 9), 0.1 µg ml−1 (lane 5, 10), 1 µg ml−1 (lane 6, 11), and 10 µg ml−1 (lane 7, 12)] for 12 hr.
Figure 2
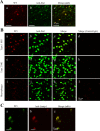
Immunocytochemical staining of rat type 1 MG with 9F5. A: Mixed glial cells (DIV10) were incubated with 9F5 (a) or anti‐Iba1 antibody (b). Fluorescence signals are shown individually (a, b) and after merging (c). B: Rat primary type 1 MG (a–d), rat type 2 MG (e–h), and peritoneal rat Mφ (i–l) were incubated with 9F5 or anti‐Iba1 antibody. Mouse IgG1 and rabbit IgG were used as negative controls (d, h, l). Fluorescence signals are shown individually and after merging. C: Rat type 1 MG were double‐stained with 9F5 (a) and anti‐lysosomal‐associated membrane protein‐1 (anti‐LAMP‐1) antibody (b). [Color figure can be viewed in the online issue, which is available at
wileyonlinelibrary.com
.]
Figure 3
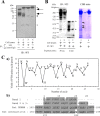
Identification of rat GPNMB protein for 9F5 antigen by using both immunoprecipitation (IP) and microsequencing. A: Lysates of rat type 1 MG were immunoprecipitated by 9F5 or control IgG and then immunoblotted with 9F5. Arrows indicate staining specific for 9F5. Asterisks indicate nonspecific staining. B: Lysates of rat type 1 MG were immunoprecipitated by 9F5, subjected to SDS‐PAGE, and then transferred to PVDF membranes. Membranes were evaluated via immunoblotting (lanes 1, 2) or staining with Coomassie Brilliant Blue R250 (CBB) (lanes 3, 4), and the major bands with estimated mol wt 50–70 kDa (lane 3, bands 1–3) were extracted and analyzed by using a microsequencer (C). Asterisks indicate nonspecific staining. Ca: Yield of phenylthiohydantoin (PTH)‐amino acid per cycle number (bands 2, 3). b: Amino acid sequence comparison of the N‐terminal amino acid sequence of bands 1–3 with rat GPNMB (AAH61725) and rat osteoactivin (NP_579832). Shading indicates the residues matched with rat GPNMB. [Color figure can be viewed in the online issue, which is available at
wileyonlinelibrary.com
.]
Figure 4
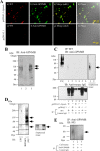
Recognition by 9F5 of GPNMB protein in rat Gpnmb_cDNA‐transfected COS‐7 cells. A–C: COS‐7 cells were transfected with pcDNA3.1‐_Gpnmb or a pcDNA3.1 empty vector for 72 hr. A: Cells were double‐stained with 9F5 and a commercially available goat anti‐mouse GPNMB polyclonal antibody. d, h: Phase‐contrast images. B: Cell lysates were from COS‐7 cells transfected with pcDNA3.1‐Gpnmb (lane 1) or pcDNA3.1 empty vector (lane 2) or were from type 1 MG (lane 3). Rat GPNMB proteins were cross‐reacted with a goat anti‐mouse GPNMB antibody. Arrows indicate specific staining. C: Lysates of cells transfected with pcDNA3.1‐Gpnmb or pcDNA3.1 empty vector were immunoprecipitated by using 9F5 (under DTT (−) condition) and then immunoblotted (IB) with the anti‐GPNMB antibody (under DTT (+) condition). Lysates from rat type 1 MG was used as a positive control (P.C.) for immunoblotting with anti‐GPNMB antibody. Lower panel shows the IgG (9F5 or control IgG) that was eluted from Protein G column by SDS‐PAGE sampling buffer without DTT. D: WB analysis of rat type 1 MG reactions with 9F5 and anti‐GPNMB antibody. E: Lysates of rat type 1 MG were immunoprecipitated via anti‐GPNMB antibody and then immunoblotted by using 9F5. [Color figure can be viewed in the online issue, which is available at
wileyonlinelibrary.com
.]
Figure 5
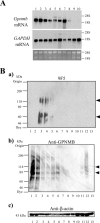
Northern and WB analyses of rat Gpnmb mRNA and proteins. A: Total RNA (2.0 µg) from rat type 1 MG (lanes 1, 2), rat type 2 MG (lanes 3, 4), peritoneal rat Mφ (lane 5), LPS‐stimulated peritoneal rat Mφ (lane 6), thioglycolate‐elicited rat Mφ (lane 7), mouse MG5 MG (lane 8), adult rat brain (lane 9), and rat C6 glioma cells (lane 10) were subjected to blot analysis. The middle and bottom panels show Northern blot analysis of glyceraldehyde‐3‐phosphate dehydrogenase (GAPDH) and ethidium bromide staining of 28S and 18S rRNA, respectively. B: WB analyses with 9F5 (a), anti‐GPNMB (b), and anti‐β‐actin antibodies (c) under DTT (−) conditions. Extracts (20 µg) were from mouse 6–3 MG (lane 1), mouse Ra2 MG (lane 2), rat type 1 MG (lane 3), LPS‐stimulated rat type 1 MG (lane 4), rat type 2 MG (lane 5), IL‐4‐stimulated rat type 2 MG (lane 6), rat neurons (lane 7), rat astrocytes (lane 8), mouse RAW 264.7 Mφ(lane 9), rat Mφ (lane 10), LPS‐stimulated rat Mφ (lane 11), thioglycolate‐elicited rat Mφ (lane 12), and rat neuroepithelial cells (lane 13).
Figure 6
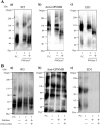
Immunoreactivity of 9F5 was not affected by deglycosylation of rat GPNMB protein. A: Extracts of rat type 1 MG were treated with or without _N_‐glycosidase F (PNGase F) overnight at 37°C, and they were then subjected to immunoblotting with 9F5 (a), anti‐GPNMB (b), or ED1 (c) antibodies. As reported previously for murine dendritic cells (Shikano et al., 2001), full‐length GPNMB (119.6 and 94.9 kDa) in type 1 MG shifted to 68.3 and 79.8 kDa after PNGase F treatment (Ab). B: Extracts of type 1 MG were treated with or without sialidase and _O_‐glycosidase overnight at 37°C, and they were then subjected to immunoblotting with 9F5 (a), anti‐GPNMB (b), or ED1 (c) antibodies. Immunoreactivity of ED1, an antibody that reacts with sialic acid on rat CD68, disappeared after sialidase treatment (Bc).
Figure 7
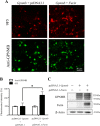
Overexpression of furin cDNA increases the expression level of 9F5 antigen. COS‐7 cells were cotransfected with pcDNA3.1‐Gpnmb/pcDNA3.1 or pcDNA3.1‐Gpnmb/pcDNA3.1‐furin vector. A: At 72 hr after transfection, cells were double‐stained with 9F5 (red) and anti‐GPNMB (green) antibodies. B: The results shown in A were quantified and are given as means ± SEM (n = 3). Fluorescence intensities (9F5 and anti‐GPNMB) in cells transfected with pcDNA3.1‐Gpnmb/pcDNA3.1were set at 100%. *P < 0.05 by Dunnett's multiple comparison test. C: Cell lysates were also subjected to immunoblot analysis for GPNMB, furin, and β‐actin. [Color figure can be viewed in the online issue, which is available at
wileyonlinelibrary.com
.]
Figure 8
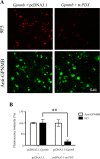
A furin inhibitor decreases the expression level of 9F5 antigen. COS‐7 cells were cotransfected with pcDNA3.1‐Gpnmb/pcDNA3.1 or pcDNA3.1‐Gpnmb/pcDNA3.1‐α1PDX vector. A: At 72 hr after transfection, cells were double‐stained with 9F5 (red) and anti‐GPNMB (green) antibodies. B: The results shown in A were quantified and are given as means ± SEM (n = 3–4). Fluorescence intensities (9F5 and anti‐GPNMB) in cells transfected with pcDNA3.1‐Gpnmb/pcDNA3.1 were set at 100%. **P < 0.01 by Dunnett's multiple comparison test. [Color figure can be viewed in the online issue, which is available at
wileyonlinelibrary.com
.]
Figure 9
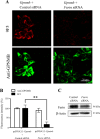
A furin siRNA inhibits the expression level of 9F5 antigen. HEK293 cells were cotransfected with pcDNA3.1‐Gpnmb/control small interfering RNA (siRNA) or pcDNA3.1‐Gpnmb/furin siRNA. A: At 72 hr after transfection, cells were double‐stained with 9F5 (red) and anti‐GPNMB (green) antibodies. B: The results shown in A were quantified and are given as means ± SEM (n = 3–4). Fluorescence intensities (9F5 and anti‐GPNMB) in cells transfected with pcDNA3.1‐Gpnmb/pcDNA3.1 were set at 100%. **P < 0.01 by Dunnett's multiple comparison test. C: Cell lysates were also subjected to immunoblot analysis for furin and β‐actin. [Color figure can be viewed in the online issue, which is available at
wileyonlinelibrary.com
.]
Figure 10
IL‐12 increases both furin and 9F5 antigen of rat type 1 MG with similar kinetics. Rat type 1 MG were treated with rat recombinant IL‐12 (10 ng ml−1) at the indicated hours, and cell lysates were subjected to immunoblot analysis for 9F5 antigen, furin, GPNMB, and β‐actin.
Figure 11
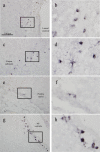
Immunohistochemical analysis with 9F5 of cryostat sections of a P5 rat brain. Sagittal sections were probed with 9F5 (diaminobenzidine‐Ni staining). Representative sections from the lateral ventricle (a, b), corpus callosum (c, d), pontine nuclei (e, f), and fourth ventricle (g, h). b, d, f, h:9F5+ cells at higher magnification. [Color figure can be viewed in the online issue, which is available at
wileyonlinelibrary.com
.]
Figure 12
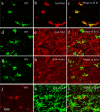
9F5 selectively immunostains MG among brain cells of a P5 rat brain. Coronal sections around the lateral ventricle were double‐stained with 9F5 and anti‐Iba1 (a–c), anti‐NG2 (d–f), anti‐nestin (g–i), or anti‐GFAP (j–l) antibodies. Fluorescence signals are shown individually and after merging. [Color figure can be viewed in the online issue, which is available at
wileyonlinelibrary.com
.]
Figure 13
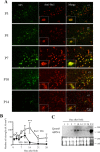
Comparative immunofluorescence analysis of cryostat sections from postnatal rat brains with 9F5 and anti‐Iba1antibodies. A: Coronal sections from P3‐P14 brains were probed with 9F5 (green) and anti‐Iba1 (red) antibodies. Fluorescencesignals are shown individually and after merging. Inset shows a higher magnification of double‐labeled cells. Labeled cells are concentrated in the white matter that constitutes the stream around the corpus callosum (CC). B: Plots of the number of Iba1+ MG and 9F5+ MG (9F5 + Iba1+ cells) in the developing brains from P1 to P28. Data are means ± SEM (n = 3). ***P < 0.001 (at day 14), determined by two‐way ANOVA with the Bonferroni post hoc test. C: Samples of total RNA (10 µg) from rat brain (P1 to P28) were subjected to blot analysis for Gpnmb mRNA. The positive control (P.C.) was total RNA (2.0 µg) from MG5 cells. The bottom panel shows ethidium bromide staining of 28S and 18S rRNA. [Color figure can be viewed in the online issue, which is available at
wileyonlinelibrary.com
.]
Figure 14
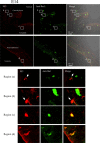
Immunofluorescence analysis of cryostat sections of E10 rat brain. Coronal sections of E10 rat brains were probed with 9F5 (red) and anti‐Iba1(green) antibodies. Fluorescence signals are shown individually and after merging. The 9F5+ cells and Iba1+ cells are shown at higher magnification (regions a, b). Iba1 + 9F5− cells (arrows) occurred inside and outside the neural tube of the E10 rat brain, whereas 9F5 + Iba1+ cells (arrowheads) were observed outside the neural tube at this stage. [Color figure can be viewed in the online issue, which is available at
wileyonlinelibrary.com
.]
Figure 15
Immunofluorescence analysis of cryostat sections of E14 rat brain. Coronal sections of E14 rat brains were probed with 9F5 (red) and anti‐Iba1 (green) antibodies. 9F5+ and Iba1+ cells are shown at higher magnification (regions a‐d). Round or amoeboid 9F5 + Iba1‐ cells were seen in brain parenchyma near the choroid plexus (arrows in regions a, b). Round‐ and rod‐shaped 9F5 + Iba1+ cells were also present in the brain parenchyma near the amygdala (region c) and around the lateral ventricle (region d), respectively. [Color figure can be viewed in the online issue, which is available at
wileyonlinelibrary.com
.]
Figure 16
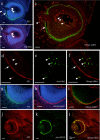
Immunofluorescence analysis of cryostat sections of E14 rat eye. a–f: Coronal sections were probed with 9F5 and anti‐Iba1antibodies and then counterstained with Hoechst 33258 (a, b). Fluorescence signals are shown individually (a, b) and after merging (c). Arrows indicate 9F5 + Iba1− retinal cells, arrowheads, some 9F5 + Iba1+ cells. d–f: 9F5+ and Iba1+ cells are also shown at higher magnification. g–i:Coronal sections were probed with 9F5 and anti‐laminin antibodies and then counterstained with Hoechst 33258 (g, h). Fluorescence signals are shown individually and after merging. j–l:Coronal sections were probed with biotin‐conjugated 9F5 and anti‐MITF antibody. Fluorescence signals are shown individually and after merging. Section j–l demonstrated cell‐type‐specific expression of 9F5 antigen on the retinal pigment epithelium (arrow in c, f) and 9F5 + Iba1+ cells comprising a portion of the Iba1+ cells (arrowheads in c, f). [Color figure can be viewed in the online issue, which is available at
wileyonlinelibrary.com
.]
Similar articles
- Truncated GPNMB, a microglial transmembrane protein, serves as a scavenger receptor for oligomeric β-amyloid peptide1-42 in primary type 1 microglia.
Kawahara K, Hasegawa T, Hasegawa N, Izumi T, Sato K, Sakamaki T, Ando M, Maeda T. Kawahara K, et al. J Neurochem. 2024 Jul;168(7):1317-1339. doi: 10.1111/jnc.16078. Epub 2024 Feb 15. J Neurochem. 2024. PMID: 38361142 - Microglia/macrophage-specific protein Iba1 binds to fimbrin and enhances its actin-bundling activity.
Ohsawa K, Imai Y, Sasaki Y, Kohsaka S. Ohsawa K, et al. J Neurochem. 2004 Feb;88(4):844-56. doi: 10.1046/j.1471-4159.2003.02213.x. J Neurochem. 2004. PMID: 14756805 - A monoclonal antibody against GPNMB.
Zhang P, Li J, Pang X, Yuan X, Li D, Li Y, Guo L, Liu W. Zhang P, et al. Monoclon Antib Immunodiagn Immunother. 2013 Aug;32(4):265-9. doi: 10.1089/mab.2013.0005. Monoclon Antib Immunodiagn Immunother. 2013. PMID: 23909420 - Gpnmb/osteoactivin, an attractive target in cancer immunotherapy.
Zhou LT, Liu FY, Li Y, Peng YM, Liu YH, Li J. Zhou LT, et al. Neoplasma. 2012;59(1):1-5. doi: 10.4149/neo_2012_001. Neoplasma. 2012. PMID: 22017590 Review. - Gpnmb/osteoactivin: an indicator and therapeutic target in tumor and nontumorous lesions.
Zhuo H, Zhou L. Zhuo H, et al. Pharmazie. 2016 Oct 1;71(10):555-561. doi: 10.1691/ph.2016.6683. Pharmazie. 2016. PMID: 29441921 Review.
Cited by
- Microglia Biomarkers in Alzheimer's Disease.
Zhang PF, Hu H, Tan L, Yu JT. Zhang PF, et al. Mol Neurobiol. 2021 Jul;58(7):3388-3404. doi: 10.1007/s12035-021-02348-3. Epub 2021 Mar 12. Mol Neurobiol. 2021. PMID: 33713018 Review. - iTRAQ-based proteomics profiling of Schwann cells before and after peripheral nerve injury.
Shi GD, Cheng X, Zhou XH, Fan BY, Ren YM, Lin W, Zhang XL, Liu S, Hao Y, Wei ZJ, Feng SQ. Shi GD, et al. Iran J Basic Med Sci. 2018 Aug;21(8):832-841. doi: 10.22038/IJBMS.2018.26944.6588. Iran J Basic Med Sci. 2018. PMID: 30186571 Free PMC article. - Histone Trimethylations and HDAC5 Regulate Spheroid Subpopulation and Differentiation Signaling of Human Adipose-Derived Stem Cells.
Chang MM, Hong YK, Hsu CK, Harn HI, Huang BM, Liu YH, Lu FI, Hsueh YY, Lin SP, Wu CC. Chang MM, et al. Stem Cells Transl Med. 2024 Mar 15;13(3):293-308. doi: 10.1093/stcltm/szad090. Stem Cells Transl Med. 2024. PMID: 38173411 Free PMC article. - Transcriptomic Analysis of Mouse Brain After Traumatic Brain Injury Reveals That the Angiotensin Receptor Blocker Candesartan Acts Through Novel Pathways.
Attilio PJ, Snapper DM, Rusnak M, Isaac A, Soltis AR, Wilkerson MD, Dalgard CL, Symes AJ. Attilio PJ, et al. Front Neurosci. 2021 Mar 22;15:636259. doi: 10.3389/fnins.2021.636259. eCollection 2021. Front Neurosci. 2021. PMID: 33828448 Free PMC article. - Glycoprotein Non-Metastatic Protein B: An Emerging Biomarker for Lysosomal Dysfunction in Macrophages.
van der Lienden MJC, Gaspar P, Boot R, Aerts JMFG, van Eijk M. van der Lienden MJC, et al. Int J Mol Sci. 2018 Dec 24;20(1):66. doi: 10.3390/ijms20010066. Int J Mol Sci. 2018. PMID: 30586924 Free PMC article. Review.
References
- Anderson MG, Smith RS, Hawes NL, Zabaleta A, Chang B, Wiggs JL, John SW. 2002. Mutations in genes encoding melanosomal proteins cause pigmentary glaucoma in DBA/2J mice. Nat Genet 30:81–85. - PubMed
- Andjelkovic AV, Nikolic B, Pachter JS, Zecevic N. 1998. Macrophages/microglial cells in human central nervous system during development: An immunohistochemical study. Brain Res 814:13–25. - PubMed
- Bächner D, Schröder D, Gross G. 2002. mRNA expression of the murine glycoprotein (transmembrane) nmb (Gpnmb) gene is linked to the developing retinal pigment epithelium and iris. Brain Res Gene Expr Patterns 1:159–165. - PubMed
MeSH terms
Substances
LinkOut - more resources
Full Text Sources
Other Literature Sources
Molecular Biology Databases
Research Materials
