Inflammatory monocytes and NK cells play a crucial role in DNAM-1-dependent control of cytomegalovirus infection - PubMed (original) (raw)
. 2016 Aug 22;213(9):1835-50.
doi: 10.1084/jem.20151899. Epub 2016 Aug 8.
Paola Kucan Brlic 1, Noa Kaynan 2, Vanda Juranic Lisnic 3, Ilija Brizic 1, Stefan Jordan 4, Adriana Tomic 5, Daria Kvestak 3, Marina Babic 3, Pinchas Tsukerman 2, Marco Colonna 6, Ulrich Koszinowski 4, Martin Messerle 7, Ofer Mandelboim 2, Astrid Krmpotic 3, Stipan Jonjic 8
Affiliations
- PMID: 27503073
- PMCID: PMC4995080
- DOI: 10.1084/jem.20151899
Inflammatory monocytes and NK cells play a crucial role in DNAM-1-dependent control of cytomegalovirus infection
Tihana Lenac Rovis et al. J Exp Med. 2016.
Abstract
The poliovirus receptor (PVR) is a ubiquitously expressed glycoprotein involved in cellular adhesion and immune response. It engages the activating receptor DNAX accessory molecule (DNAM)-1, the inhibitory receptor TIGIT, and the CD96 receptor with both activating and inhibitory functions. Human cytomegalovirus (HCMV) down-regulates PVR expression, but the significance of this viral function in vivo remains unknown. Here, we demonstrate that mouse CMV (MCMV) also down-regulates the surface PVR. The m20.1 protein of MCMV retains PVR in the endoplasmic reticulum and promotes its degradation. A MCMV mutant lacking the PVR inhibitor was attenuated in normal mice but not in mice lacking DNAM-1. This attenuation was partially reversed by NK cell depletion, whereas the simultaneous depletion of mononuclear phagocytes abolished the virus control. This effect was associated with the increased expression of DNAM-1, whereas TIGIT and CD96 were absent on these cells. An increased level of proinflammatory cytokines in sera of mice infected with the virus lacking the m20.1 and an increased production of iNOS by inflammatory monocytes was observed. Blocking of CCL2 or the inhibition of iNOS significantly increased titer of the virus lacking m20.1. In this study, we have demonstrated that inflammatory monocytes, together with NK cells, are essential in the early control of CMV through the DNAM-1-PVR pathway.
© 2016 Lenac Rovis et al.
Figures
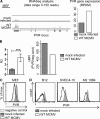
Figure 1.
MCMV up-regulates PVR transcription but down-regulates its surface expression. (A) PVR locus with aligned reads from RNASeq analysis of infected and mock-infected MEF (Juranic Lisnic et al., 2013; left). Estimation of PVR gene expression by RPKM (reads per kilobase of exon model per million mapped reads; right). (B) Level of PVR transcript was measured in mock-infected BALB/c MEF and in WT MCMV-infected cells (left) that down-regulated PVR after 18 h p.i. (right) by quantitative RT-PCR. Data are representative from two independent experiments. ***, P < 0.001. (C) WT MCMV (1 PFU/cell, 16 h) or mock-infected MEFs were analyzed for the surface PVR by anti-PVR mAb or the isotype control. (D) Indicated cell lines, WT MCMV (3 PFU/cell, 16 h) or mock infected, were analyzed for the surface PVR expression. The analysis of surface PVR expression (C and D) was independently replicated six times.
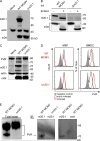
Figure 2.
MCMV blocks PVR maturation in the ER and promotes its proteasomal degradation. (A) PVR was immunoblotted from WT MCMV (1 PFU/cell, 20 h) or mock infected MEF lysates with anti-PVR mAb; actin is shown as a loading control and MCMV m04 protein as a control of infection. Immunoblotting was independently replicated six times. (B) B12 cells were infected with WT MCMV (3 PFU/cell, 16 h) or mock infected. PVR was immunoblotted from EndoH-treated or untreated lysates (top); actin is shown as a loading control and MCMV M57 protein as a control of infection (bottom). (C) B12 cells were infected with WT MCMV (3 PFU/cell) and at 4 h p.i. treated with lactacystin (10 µM), leupeptin (75 µg/µl) or left untreated. 16 h p.i. lysates were analyzed with anti-PVR mAbs; actin is shown as a loading control. (D) B12 cells were infected with the virus lacking viral Fc receptor m138, treated as indicated for C and analyzed with anti-PVR mAbs, followed by FITC-labeled secondary Abs by IF. All images were equally adjusted using FluoView software; γ adjustment, 1.8; bar, 10 µm. Experiments with lactacystin and leupeptin were independently replicated two times. (E) PVR was immunoblotted from mock or WT MCMV (3 PFU/cell, 20 h) infected lysates of indicated cells; actin is shown as a loading control. (F) PVR was immunoblotted from lysates of B12 cells infected with WT MCMV or three field isolates (2.5 PFU/cell, 16 h); actin is shown as a loading control. PVR immunoblotting (E and F) was repeated independently on each cell line at least two times.
Figure 3.
PVR is regulated by a gene located in the m20 gene region. (A) B12 cells were infected with WT, Δ8 (Δ_m01-m22_) or Δ1 (Δ_m01-m17_) MCMV (3 PFU/cell) and immunoblotted with anti-PVR mAbs; actin is shown as a loading control. (A and B) White boxes represent deleted gene regions in recombinant viruses. (B) Previously annotated ORFs are shown as white arrows. The black arrow represents the RNA probe used for the Northern blot analysis in D. (C) PVR was immunoblotted from lysates of B12 cells infected with indicated mutants (3 PFU/cell, 16 h); actin is shown as a loading control. (D) MEF was infected with indicated viruses (0.3 PFU/cell, 48 h) or left uninfected. Transcripts were identified using the RNA probe (B). WT MCMV lane is from different gel, whereas Δ_m19.1_, Δ_m20.0_ and Δ_m20.1_ are parts of the same gel analyzed with the same exposure. (E) MEF was infected with indicated viruses (1 PFU/cell, 20 h). PVR was immunoblotted from cell lysates. All experiments (A–E) were independently replicated at least two times.
Figure 4.
Characterization of the viral protein m20.1 that retains PVR. (A) m20.1 was immunoblotted from MCMV (indicated viruses, 1 PFU/cell, 20 h) or mock infected MEF lysates with anti-m20.1 mAb; actin is shown as a loading control and MCMV m04 protein as a control of infection. (B) MEF was infected with indicated viruses (0.8 PFU/cell; 20 h). MCMV m20.1 and m04 proteins were immunoblotted from EndoH-treated or untreated lysates with corresponding Abs; m04 is shown as a control of infection and EndoH treatment. (C) B12 cells were infected with indicated viruses (3 PFU/cell, 20 h) or mock infected. PVR and m20.1 proteins were immunoblotted from lysates with rat anti–mouse PVR mAb and anti-MCMV m20.1 mAb, respectively. Actin is shown as a loading control and m04 as a control of viral infection. Different parts of the same gel analyzed by same exposure are shown. (D) BMDCs or MEF cells were infected with either WT MCMV or Δ_m20.1_ virus (3 or 1 PFU/cell, respectively). Infected and mock infected cells were analyzed for the surface PVR by anti-PVR mAb, or the isotype control, followed by anti–rat PE. (E) PVR was immunoblotted from MCMV-infected MEF lysates with anti-PVR mAb (left). The m20.1 was immunoprecipitated from the same lysates with the anti-m20.1 mAb or the control mAb, and PVR was subsequently immunoblotted from precipitates with anti-PVR mAb (right). All experiments (A–E) were independently replicated at least two times.
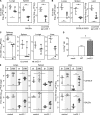
Figure 5.
Heavy attenuation of MCMV lacking PVR inhibitor is caused in part by NK cells. BALB/c mice (A) or C57BL/6 SCID mice (B) were i.v. injected with 2 × 10⁵ PFU/mouse (A) or 5 × 10⁵ PFU/mouse (B) of Δ_m20.1_ MCMV mutant generated on Δ_m157_ background and Δ_m157_ MCMV as a control virus. Titers in organs of individual mice 4 d p.i. are shown (circles); horizontal bars indicate the median values. (C) Newborn BALB/c mice were i.p. injected with 400 PFU/mouse of Δ_m20.1_ MCMV mutant generated on Δ_m157_ background or Δ_m157_ MCMV. Titers in organs of individual mice 11 d p.i. are shown (circles); horizontal bars indicate the median values. Results from one of the three independent experiments (A) and one of the two independent experiments (B and C) are shown, with minimum four animals per group. DL, detection limit. *, P < 0.05; **, P < 0.01. (D) BALB/c mice were i.v. injected with 2 × 10⁵ PFU of WT MCMV, Δ_m20.1_ MCMV, or left uninfected. IFN-γ expression by splenic NK cells was determined by intracellular FACS analysis 1.5 d p.i. n = 5 animals; mean + SD; *, P < 0.05. Data are representative from three independent experiments. (E) C57BL/6 or BALB/c mice depleted for NK cells or undepleted were i.v. injected with 5 × 10⁵ PFU/mouse or 2 × 10⁵ PFU/mouse of Δ_m157_ MCMV (control virus) or Δ_m20.1_ mutant generated on Δ_m157_ background. Titers in organs of individual mice 4 d p.i. are shown (circles); horizontal bars indicate the median values. Results from one of the two independent experiments with minimum three animals per group are shown. *, P < 0.05; **, P < 0.01.
Figure 6.
Macrophages and inflammatory monocytes in spleen selectively up-regulate PVR receptor DNAM-1 upon CMV infection. (A) BALB/c mice were i.v. injected with 2 × 10⁵ PFU of WT MCMV, Δ_m20.1_ MCMV, or left uninfected. 1.5 d p.i. percentages of DNAM-1+, CD96+, or TIGIT+ NK cells were determined from spleen by surface FACS analysis. (B) Mice were i.p. injected with 2 × 10⁵ PFU of WT MCMV, Δ_m20.1_ MCMV, or left uninfected and the expression of DNAM-1, CD96, and TIGIT determined on inflammatory monocytes by FACS analyses. (C) BALB/c mice were treated as described in B, and the expression of DNAM-1 on splenic macrophages determined by FACS analyses (RP, red pulp; MM, marginal metallophilic; MZ, marginal zone macrophages). (D) Dot blot analysis of cytokines, with capture antibodies spotted onto a membrane, in the sera of mice infected with WT MCMV or Δ_m20.1_ MCMV. Two membranes with 40 different antibodies captured (in duplicate) were tested in each experiment with the sera of either WT MCMV or Δ_m20.1_ MCMV infected mice. Experiment was repeated twice with different sera. Data selected for cytokines that were consistently up-regulated or down-regulated in both experiments and whose fold change was ≥2 in at least one of the experiments (*). Shown are mean values plus range. (E) BALB/c mice were treated as described in B. 1.5 d p.i. iNOS expression by inflammatory monocytes was determined by intracellular FACS analysis. (A and B [top] and C and E) n = 5 animals per group; mean + SD. *, P < 0.05; **, P < 0.01; ***, P < 0.001.
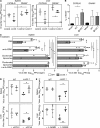
Figure 7.
DNAM-1– and iNOS-dependent control of Δ_m20.1_ MCMV by inflammatory monocytes. (A) C57BL/6 or DNAM−/− mice were i.v. injected with 5 × 10⁵ PFU of Δ_m157_ MCMV (control virus) or Δ_m20.1_ mutant generated on Δ_m157_ background. Titers in organ of individual mice 4 d p.i. are shown (circles); horizontal bars indicate the median values; Results from one of the two independent experiments with minimum four animals per group are shown. *, P < 0.05. (B) C57BL/6 or DNAM−/− mice were i.p. injected with 5 × 10⁵ PFU of Δ_m157_ MCMV (control virus), Δ_m20.1_ mutant generated on Δ_m157_ background, or left uninfected. 1.5 d p.i. iNOS expression by inflammatory monocytes was determined by intracellular FACS analysis. n = 5 animals; mean + SD; *, P < 0.05. (C) BALB/c mice were injected i.v. with 2 × 10⁵ PFU of indicated viruses. For depletion of NK cells, mononuclear phagocytes or both subsets, groups of mice were treated with anti-AGM1, clodronate liposomes, or both, and virus titers were determined 4 d p.i. Group of mice injected with PBS was used as control. Results from one of the three independent experiments with minimum four animals per group are shown. Shown are mean values plus SEM. *, P < 0.05; **, P < 0.01. (D) BALB/c mice were injected i.p. with 2 × 10⁵ PFU of indicated viruses. 1 d before infection and on the day of infection, in vivo blocking of CCL2 was performed by i.p. injection of the mAbs to CCL2. Titers in organs of individual mice 4 d p.i. are shown (circles). Results from one of the two independent experiments with four to five animals per group are shown. *, P < 0.05. (E) BALB/c mice were injected i.v. with 2 × 10⁵ PFU of indicated viruses. For blocking of NOS, mice were given sterile drinking water with or without
l
-NAME 3 d before infection and throughout the course of infection. Results from one of the two independent experiments with five animals per group are shown. *, P < 0.05; **, P < 0.01.
Similar articles
- DNAM-1 and PVR regulate monocyte migration through endothelial junctions.
Reymond N, Imbert AM, Devilard E, Fabre S, Chabannon C, Xerri L, Farnarier C, Cantoni C, Bottino C, Moretta A, Dubreuil P, Lopez M. Reymond N, et al. J Exp Med. 2004 May 17;199(10):1331-41. doi: 10.1084/jem.20032206. Epub 2004 May 10. J Exp Med. 2004. PMID: 15136589 Free PMC article. - DNAM-1 versus TIGIT: competitive roles in tumor immunity and inflammatory responses.
Shibuya A, Shibuya K. Shibuya A, et al. Int Immunol. 2021 Nov 25;33(12):687-692. doi: 10.1093/intimm/dxab085. Int Immunol. 2021. PMID: 34694361 Review. - Costimulatory molecule DNAM-1 is essential for optimal differentiation of memory natural killer cells during mouse cytomegalovirus infection.
Nabekura T, Kanaya M, Shibuya A, Fu G, Gascoigne NR, Lanier LL. Nabekura T, et al. Immunity. 2014 Feb 20;40(2):225-34. doi: 10.1016/j.immuni.2013.12.011. Epub 2014 Jan 16. Immunity. 2014. PMID: 24440149 Free PMC article. - T-cell Ig and ITIM domain regulates natural killer cell activation in murine acute viral hepatitis.
Bi J, Zhang Q, Liang D, Xiong L, Wei H, Sun R, Tian Z. Bi J, et al. Hepatology. 2014 May;59(5):1715-25. doi: 10.1002/hep.26968. Epub 2014 Mar 27. Hepatology. 2014. PMID: 24319005 - DNAM-1 Activating Receptor and Its Ligands: How Do Viruses Affect the NK Cell-Mediated Immune Surveillance during the Various Phases of Infection?
Cifaldi L, Doria M, Cotugno N, Zicari S, Cancrini C, Palma P, Rossi P. Cifaldi L, et al. Int J Mol Sci. 2019 Jul 30;20(15):3715. doi: 10.3390/ijms20153715. Int J Mol Sci. 2019. PMID: 31366013 Free PMC article. Review.
Cited by
- hCMV-Mediated Immune Escape Mechanisms Favor Pathogen Growth and Disturb the Immune Privilege of the Eye.
Spekker-Bosker K, Ufermann CM, Maywald M, Zimmermann A, Domröse A, Woite C, Däubener W, Eller SK. Spekker-Bosker K, et al. Int J Mol Sci. 2019 Feb 16;20(4):858. doi: 10.3390/ijms20040858. Int J Mol Sci. 2019. PMID: 30781494 Free PMC article. - Increased blood CD226- inflammatory monocytes with low antigen presenting potential correlate positively with severity of hemorrhagic fever with renal syndrome.
Tang K, Hou Y, Cheng L, Zhang Y, Li J, Qin Q, Zheng X, Jia X, Zhang C, Zhuang R, Zhang Y, Jin B, Chen L, Ma Y. Tang K, et al. Ann Med. 2023;55(2):2247000. doi: 10.1080/07853890.2023.2247000. Ann Med. 2023. PMID: 37585670 Free PMC article. - Poliovirus receptor (PVR)-like protein cosignaling network: new opportunities for cancer immunotherapy.
Wu B, Zhong C, Lang Q, Liang Z, Zhang Y, Zhao X, Yu Y, Zhang H, Xu F, Tian Y. Wu B, et al. J Exp Clin Cancer Res. 2021 Aug 25;40(1):267. doi: 10.1186/s13046-021-02068-5. J Exp Clin Cancer Res. 2021. PMID: 34433460 Free PMC article. Review. - Novel immune-related genes in the tumor microenvironment with prognostic value in breast cancer.
Tan W, Liu M, Wang L, Guo Y, Wei C, Zhang S, Luo C, Liu N. Tan W, et al. BMC Cancer. 2021 Feb 6;21(1):126. doi: 10.1186/s12885-021-07837-1. BMC Cancer. 2021. PMID: 33549054 Free PMC article. - The m15 Locus of Murine Cytomegalovirus Modulates Natural Killer Cell Responses to Promote Dissemination to the Salivary Glands and Viral Shedding.
Chan B, Arapović M, Masters LL, Rwandamuiye F, Jonjić S, Smith LM, Redwood AJ. Chan B, et al. Pathogens. 2021 Jul 9;10(7):866. doi: 10.3390/pathogens10070866. Pathogens. 2021. PMID: 34358016 Free PMC article.
References
- Bottino C., Castriconi R., Pende D., Rivera P., Nanni M., Carnemolla B., Cantoni C., Grassi J., Marcenaro S., Reymond N., et al. . 2003. Identification of PVR (CD155) and Nectin-2 (CD112) as cell surface ligands for the human DNAM-1 (CD226) activating molecule. J. Exp. Med. 198:557–567. 10.1084/jem.20030788 - DOI - PMC - PubMed
- Britt W.J., Cekinovic D., and Jonjic S.. 2013. Murine Model of Neonatal Cytomegalovirus Infection. In Cytomegaloviruses From Molecular Pathogenesis to Intervention. Reddehase M.J., editor. Caister Academic Press, Norfolk, UK: pp. 119–141.
Publication types
MeSH terms
Substances
LinkOut - more resources
Full Text Sources
Other Literature Sources
Medical
Molecular Biology Databases
Research Materials


