Extracellular Vesicles from Metastatic Rat Prostate Tumors Prime the Normal Prostate Tissue to Facilitate Tumor Growth - PubMed (original) (raw)
Extracellular Vesicles from Metastatic Rat Prostate Tumors Prime the Normal Prostate Tissue to Facilitate Tumor Growth
Sofia Halin Bergström et al. Sci Rep. 2016.
Abstract
Accumulating data indicates that tumor-derived extracellular vesicles (EVs) are responsible for tumor-promoting effects. However, if tumor EVs also prepare the tumor-bearing organ for subsequent tumor growth, and if this effect is different in low and high malignant tumors is not thoroughly explored. Here we used orthotopic rat Dunning R-3327 prostate tumors to compare the role of EVs from fast growing and metastatic MatLyLu (MLL) tumors with EVs from more indolent and non-metastatic Dunning G (G) tumors. Prostate tissue pre-conditioned with MLL-EVs in vivo facilitated G tumor establishment compared to G-EVs. MLL-EVs increased prostate epithelial proliferation and macrophage infiltration into the prostate compared to G-EVs. Both types of EVs increased macrophage endocytosis and the mRNA expression of genes associated with M2 polarization in vitro, with MLL-EVs giving the most pronounced effects. MLL-EVs also altered the mRNA expression of growth factors and cytokines in primary rat prostate fibroblasts compared to G-EVs, suggesting fibroblast activation. Our findings propose that EVs from metastatic tumors have the ability to prime the prostate tissue and enhance tumor growth to a higher extent than EVs from non-metastatic tumors. Identifying these differences could lead to novel therapeutic targets and potential prognostic markers for prostate cancer.
Conflict of interest statement
The authors declare no competing financial interests.
Figures
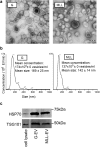
Figure 1. Characterization of tumor-derived extracellular vesicles (EVs).
(a) Representative electron microscopic (EM) images of G- and MLL-EVs. Scale bar represents 100 nm. (b) Nanoparticle tracking analysis (NTA) of isolated EVs. The calculated size distribution (n = 3) and concentration (n = 3) are shown as a mean ± SD. The graphs shown are one measurement representative for G-EVs and MLL-EVs. (c) Representative Western Blot analyses of TSG101 and HSP70 in isolated G- and MLL-EVs. G tumor cell lysate was used as a cell control. Western Blots have been run under the same experimental conditions and were cropped to improve clarity.
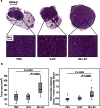
Figure 2. G tumor size.
Rat ventral prostates were injected with MLL-EVs (n = 11), G-EVs (n = 11) or PBS (n = 13) as control and G tumor cells (1 × 10⁵ cells) were injected to the preconditioned prostates 72 hours later. (a) Representative sections of hematoxylin and eosin stained tumors at 8 weeks. T; tumor (encircled in black) and N; normal prostate tissue. Higher magnification shows a similar tumor morphology between the groups. (b) The largest tumor area (mm2) and the total prostate weight (tumor + normal prostate tissue, grams) were analyzed for each tumor at 8 weeks and each group was illustrated with box plots. Outlier values (o) and far-out values (*) are indicated.
Figure 3. Immunostaining in rat prostates stimulated with tumor-derived extracellular vesicles (EVs).
Rat ventral prostates were injected with PBS (n = 6), G-EVs (n = 6), or MLL-EVs (n = 6) and the prostate tissue was analyzed after 72 hours. Sections were immunostained and quantified for (a) macrophages (CD68) and (b) epithelial proliferation (BrdU). Sections show representative staining (brown) in each group (original magnification x200). Each group was illustrated with box plots.
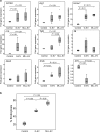
Figure 4. Phenotypic changes in EV-differentiated monocytes.
(a) Expression of M1- or M2-associated genes in cultured monocytes with or without G-EVs or MLL-EVs was analyzed by RT-PCR. Shown is the fold gene expression from two independent experiments (n = 6 in each group), with control monocytes set as 1 and illustrated with box plots. Outlier values (o) are indicated. (b) Endocytosis by monocytes differentiated for 6 days with M-CSF in the presence or absence of G- or MLL-EVs was evaluated by measuring internalization of FITC-dextran followed by flow cytometry analysis. Shown is percentage endocytosis illustrated with box plots.
Figure 5. Cell viability of G tumor cells stimulated with tumor-derived EV in vitro.
G tumor cells were cultured in serum-free medium and stimulated with PBS or different concentrations of G- or MLL-EVs and cell viability was measured at different time points using an in vitro MTT assay. Values are mean relative absorbance ± SEM compared to values at 24 hours.
Similar articles
- Effect of colorectal cancer-derived extracellular vesicles on the immunophenotype and cytokine secretion profile of monocytes and macrophages.
Popēna I, Ābols A, Saulīte L, Pleiko K, Zandberga E, Jēkabsons K, Endzeliņš E, Llorente A, Linē A, Riekstiņa U. Popēna I, et al. Cell Commun Signal. 2018 Apr 24;16(1):17. doi: 10.1186/s12964-018-0229-y. Cell Commun Signal. 2018. PMID: 29690889 Free PMC article. - Extracellular vesicles as drivers of epithelial-mesenchymal transition and carcinogenic characteristics in normal prostate cells.
Souza AG, B Silva IB, Campos-Fernández E, Marangoni K, F Bastos VA, Alves PT, Goulart LR, Alonso-Goulart V. Souza AG, et al. Mol Carcinog. 2018 Apr;57(4):503-511. doi: 10.1002/mc.22775. Epub 2018 Jan 5. Mol Carcinog. 2018. PMID: 29247548 - Cell Stress Induced Stressome Release Including Damaged Membrane Vesicles and Extracellular HSP90 by Prostate Cancer Cells.
Eguchi T, Sogawa C, Ono K, Matsumoto M, Tran MT, Okusha Y, Lang BJ, Okamoto K, Calderwood SK. Eguchi T, et al. Cells. 2020 Mar 19;9(3):755. doi: 10.3390/cells9030755. Cells. 2020. PMID: 32204513 Free PMC article. - Extracellular vesicles such as prostate cancer cell fragments as a fluid biopsy for prostate cancer.
Brett SI, Kim Y, Biggs CN, Chin JL, Leong HS. Brett SI, et al. Prostate Cancer Prostatic Dis. 2015 Sep;18(3):213-20. doi: 10.1038/pcan.2015.17. Epub 2015 May 12. Prostate Cancer Prostatic Dis. 2015. PMID: 25964141 Review. - Tumor-derived extracellular vesicles: The metastatic organotropism drivers.
Rezaie J, Ahmadi M, Ravanbakhsh R, Mojarad B, Mahbubfam S, Shaban SA, Shadi K, Berenjabad NJ, Etemadi T. Rezaie J, et al. Life Sci. 2022 Jan 15;289:120216. doi: 10.1016/j.lfs.2021.120216. Epub 2021 Dec 7. Life Sci. 2022. PMID: 34890589 Review.
Cited by
- Aggressive rat prostate tumors reprogram the benign parts of the prostate and regional lymph nodes prior to metastasis.
Strömvall K, Thysell E, Halin Bergström S, Bergh A. Strömvall K, et al. PLoS One. 2017 May 4;12(5):e0176679. doi: 10.1371/journal.pone.0176679. eCollection 2017. PLoS One. 2017. PMID: 28472073 Free PMC article. - Extracellular Vesicles: Novel Opportunities to Understand and Detect Neoplastic Diseases.
Bongiovanni L, Andriessen A, Wauben MHM, Nolte-'t Hoen ENM, de Bruin A. Bongiovanni L, et al. Vet Pathol. 2021 May;58(3):453-471. doi: 10.1177/0300985821999328. Epub 2021 Apr 5. Vet Pathol. 2021. PMID: 33813952 Free PMC article. Review. - Reduced number of CD169+ macrophages in pre-metastatic regional lymph nodes is associated with subsequent metastatic disease in an animal model and with poor outcome in prostate cancer patients.
Strömvall K, Sundkvist K, Ljungberg B, Halin Bergström S, Bergh A. Strömvall K, et al. Prostate. 2017 Nov;77(15):1468-1477. doi: 10.1002/pros.23407. Epub 2017 Sep 7. Prostate. 2017. PMID: 28880401 Free PMC article. - Glioblastoma stem-like cells secrete the pro-angiogenic VEGF-A factor in extracellular vesicles.
Treps L, Perret R, Edmond S, Ricard D, Gavard J. Treps L, et al. J Extracell Vesicles. 2017 Aug 8;6(1):1359479. doi: 10.1080/20013078.2017.1359479. eCollection 2017. J Extracell Vesicles. 2017. PMID: 28815003 Free PMC article. - The Role of Non-Immune Cell-Derived Extracellular Vesicles in Allergy.
Hovhannisyan L, Czechowska E, Gutowska-Owsiak D. Hovhannisyan L, et al. Front Immunol. 2021 Aug 19;12:702381. doi: 10.3389/fimmu.2021.702381. eCollection 2021. Front Immunol. 2021. PMID: 34489951 Free PMC article. Review.
References
- Hanahan D. & Weinberg R. A. Hallmarks of cancer: the next generation. Cell 144, 646–674 (2011). - PubMed
Publication types
MeSH terms
Substances
LinkOut - more resources
Full Text Sources
Other Literature Sources
Medical


