RNA binding protein, tristetraprolin in a murine model of recurrent pregnancy loss - PubMed (original) (raw)
RNA binding protein, tristetraprolin in a murine model of recurrent pregnancy loss
Kasra Khalaj et al. Oncotarget. 2016.
Abstract
Recurrent pregnancy loss is a major reproductive pathology affecting 1-5% of pregnant women worldwide. A distinct feature of this reproductive pathology is involvement of key inflammatory cytokines and transcription factors such as tumor necrosis factor alpha (TNF-α), interleukin 6 (IL-6) and nuclear factor kappa beta (NF-κB). Special classes of RNA-binding proteins regulate the transcripts of many of these important cytokines and regulatory factors via binding to the 3' untranslated regions (UTRs) and/or poly(A) tail and destabilizing/stabilizing the transcript. The tristetraprolin (TTP/ZFP36) family have been found to be potent destabilizers of the aforementioned inflammatory and cellular response cytokines. The aim of this study was to evaluate whether tristetraprolin is expressed in the placenta and involved in modulating inflammation in mouse model of lipopolysaccharide (LPS)-induced fetal loss. In this study, Swiss-albino mice were injected with LPS at gestational day 15.5 and placental tissues were harvested 6 hours post-LPS injection. Histopathology and immunohistochemistry analyses clearly revealed cellular stress and death in LPS treated placentas compared to controls. TTP protein was downregulated, while targets TNF-α and IL-6 were upregulated in LPS group compared to controls. We observed increased TTP nuclear immunolocalization corresponding with higher NF-κB nuclear localization in trophoblasts from LPS treated placentas. Our results suggest that RNA-binding proteins such as TTP are expressed and perhaps involved in the modulation of inflammation-induced pregnancy pathologies.
Keywords: 3’ UTR; Pathology Section; RNA; RPL; inflammation; pregnancy.
Conflict of interest statement
CONFLICTS OF INTEREST
The authors declare that they have no competing interests.
Figures
Figure 1. Placental histopathology using Haematoxylin and Eosin staining of control and LPS groups in mice at gd 15.5
Morphology was examined from both control (Panels A.-C., n = 6), and LPS post 6 h (Panels D.-F., n = 6) group placentas. Panel B illustrates labyrinth histology including giant trophoblast cells and maternal/fetal blood vessels. Panel C illustrates fusing binuclear giant trophoblast cells (red star). Disrupted blood vessels are evident in panel E (top red arrow). Additionally, disrupted trophoblasts are also evident in LPS group placentas (bottom red arrow in panel E). Panel F illustrates trophoblast cell (gtc) with evidence of vacuolization (red arrow) and nucleolar degradation (Panel A&D, 50 μm). Panels B-C, E-F (20 μm).
Figure 2. PARP and Caspase staining in placenta from LPS treated group compared to control
PARP staining in Control (Panels A.-C.) and LPS D.-F. groups. PARP staining is significantly higher in placenta from LPS treated group compared to control (Panels A-F). Caspase-3 immunofluorescence analysis reveals staining in control (Panel G.) and LPS treated (Panel H.) and indicative of trophoblast foci in damaged placental region (H; yellow arrow that are reactive in trophoblasts treated with LPS compared to control). Asterisks in G&H indicate non-specific staining marked by red blood cells from the labyrinth region. Significantly high intensity of PARP staining was detected in LPS group (Intensity quantified using pixel quantification software (panel I.)). Panel I; Histogram results are presented as mean of relative pixel quantification ± SEM. Images (panels B&C, E&F, 20 μm (panels A&D, G&H, 100 μm). * P < 0.05.
Figure 3. Immunohistochemical localization of NF-κB in placenta from LPS treated and control groups
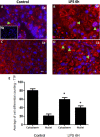
Panels A. and C. illustrate NF-κB staining in spongiotrophoblast, and panels B. and D. illustrate labyrinth region of the placenta. Similar to TTP, staining is noted in both cell cytoplasm (A; orange star) and nucleus (C&D; orange arrows), with higher cytoplasmic staining noted in control group compared to LPS group (orange star; panel A). Higher nuclear localization of NF-κB corresponded to TTP findings in figure 4; whereby significantly higher NF-κB staining was also noted in LPS group compared to control (evident in trophoblast cell in panel B; spongiotrophoblast region). Isotype negative control image is included in lower left of panel A. Panels E. and G. illustrate non-phosphorylated NF-κB staining in the cell cytoplasm, and phosphorylated NF-κB staining in the trophoblast nucleus (Panels F. and H.; panel L. black arrow at higher resolution). Similar to Panels A-B immunofluorescence findings, non-phosphorylated NF-κB are detected in similar quantities in trophoblast cytoplasm in LPS group (Panel G arrows) compared to control (Panel E star). Higher phosphorylated NF-κB nuclear localization is found in many trophoblast foci of LPS group compared to control (H&L compared to F&J). Histogram results (Panel M.) of panels A-D are presented as mean or average of differential cell counting ± SEM. * P < 0.05. Original magnification 20 μm (Panels A-D, I.-L.), 50 μm (Panels E-H)
Figure 4. Immunohistochemical localization of TTP in placenta from LPS treated and control groups
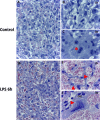
TTP staining in spongiotrophoblast (panels A. and B.), and labyrinth (panel C. and D.) region of the control (panel A and C) group and LPS challenged (panel B and D) placentas. Cytoplasmic and nuclear TTP staining was observed, especially in labyrinth area in control placenta. However, higher nuclear localization of TTP is noted in trophoblast and giant trophoblast cells residing in the spongiotrophoblast region of LPS group placentas (panel B, arrow indicate trophoblast cells). TTP is also expressed in labyrinth region of placentas in LPS treated mice (panel D, arrows emphasize nuclear staining). Isotype control image is illustrated in lower left of panel A. Panel E histogram presented as mean or average of differential cell counting ± SEM. * P < 0.05. Original magnification 20 μm.
Figure 5. Immunogold-EM analysis of TTP expression in LPS treated and control groups
Immunocytochemistry (ICC) images of TTP expression via immunocytochemistry in control (Panels A. and B.) and LPS (Panels C.-F.) group placentas reveal unique nuclear staining patterns. Cytosolic immunogold labelled TTP is evident in varying trophoblast cells from the spongiotrophoblast and labyrinth regions of both LPS and control group placentas (Panels A-D). Higher immunogold labelled TTP is bound to nuclear content within the trophoblast nuclei in the LPS group compared to control (panels C&E). Red circles indicate immunogold staining specific for TTP. Original magnification 500 nm.
Figure 6. Transmission Electron Microscopy images of TTP expression via in LPS treated and control groups Transmission electron microscopy findings in control (A and B) and LPS (Panels C-F) treated placental trophoblast cells
Ultrastructural abnormalities and defects existed in placental tissue in LPS group compared to control and also exhibited signs of dysmorphic placental tissue microarchitecture (Red arrows, panels B. and E.). Enlarged nucleoli are present in residing trophoblast nuclei from LPS treated placentas (Red arrows, panel C.). Figure 5D, red arrow indicates presence of a platelet in LPS group compared to control. Vacuolization of cytoplasm is confirmed via observed cytoplasmic vacuolization (Circled region, panel E, which also corresponds to our histopathology findings in LPS group compared to control. Additional findings included Polymorphonuclear bodies (PMN) observed in low quantities in LPS group placentas compared to control (Panel F.). TEM images were obtained at 2 μm.
Figure 7. The RNA binding protein TTP is significantly downregulated and its inflammatory targets IL-6 and TNF-α are significantly upregulated in LPS 6h treated placentas
Protein expression of other TTP-associated genes and targets IFN-γ, NF-κB while slightly lower, remain unchanged in LPS compared to control groups. All data is expressed as a ratio to corresponding ACTB expression. Expression data illustrated as mean ± SEM. * P < 0.05, and ** P < 0.005.
Figure 8. ELAV like RNA binding protein 1 (ELAVL1) mRNA expression is significantly lower in LPS 6h treated placentas compared to control
mRNA transcripts of destabilizing RNA-binding proteins ZFP36, _Z_FP36L1, ZFP36L2 (panels B-D) remain unchanged in LPS treated placentas compared to control. All data was normalized and expressed relative to GAPDH housekeeping gene. Expression data illustrated as mean +/− SEM. * P < 0.05.
Similar articles
- Inhibition of BCAT1 expression improves recurrent miscarriage by regulating cellular dysfunction and inflammation of trophoblasts.
Xu G, Tian C, Li Y, Fang L, Wang J, Jing Z, Li S, Chen P. Xu G, et al. Cell Tissue Res. 2024 Nov;398(2):111-121. doi: 10.1007/s00441-024-03921-7. Epub 2024 Oct 2. Cell Tissue Res. 2024. PMID: 39356334 - Deficiency of the placenta- and yolk sac-specific tristetraprolin family member ZFP36L3 identifies likely mRNA targets and an unexpected link to placental iron metabolism.
Stumpo DJ, Trempus CS, Tucker CJ, Huang W, Li L, Kluckman K, Bortner DM, Blackshear PJ. Stumpo DJ, et al. Development. 2016 Apr 15;143(8):1424-33. doi: 10.1242/dev.130369. Epub 2016 Mar 7. Development. 2016. PMID: 26952984 Free PMC article. - Sildenafil (Viagra®) blocks inflammatory injury in LPS-induced mouse abortion: A potential prophylactic treatment against acute pregnancy loss?
Luna RL, Nunes AK, Oliveira AG, Araujo SM, Lemos AJ, Rocha SW, Croy BA, Peixoto CA. Luna RL, et al. Placenta. 2015 Oct;36(10):1122-9. doi: 10.1016/j.placenta.2015.07.133. Epub 2015 Aug 4. Placenta. 2015. PMID: 26303758 - Tristetraprolin specifically regulates the expression and alternative splicing of immune response genes in HeLa cells.
Tu Y, Wu X, Yu F, Dang J, Wang J, Wei Y, Cai Z, Zhou Z, Liao W, Li L, Zhang Y. Tu Y, et al. BMC Immunol. 2019 May 2;20(1):13. doi: 10.1186/s12865-019-0292-1. BMC Immunol. 2019. PMID: 31046669 Free PMC article. - The Cross-talk between Tristetraprolin and Cytokines in Cancer.
Guo J, Wang H, Jiang S, Xia J, Jin S. Guo J, et al. Anticancer Agents Med Chem. 2017 Nov 24;17(11):1477-1486. doi: 10.2174/1871520617666170327155124. Anticancer Agents Med Chem. 2017. PMID: 28356023 Review.
Cited by
- ZFP36, an RNA-binding protein promotes hBMSCs osteogenic differentiation via binding with JUN.
Su H, Liang L, Wang J, Yuan X, Zhao B. Su H, et al. J Orthop Surg Res. 2024 Nov 14;19(1):758. doi: 10.1186/s13018-024-05232-7. J Orthop Surg Res. 2024. PMID: 39543732 Free PMC article. - Elevated Tristetraprolin Impairs Trophoblast Invasion in Women with Recurrent Miscarriage by Destabilization of HOTAIR.
Tian FJ, He XY, Wang J, Li X, Ma XL, Wu F, Zhang J, Liu XR, Qin XL, Zhang Y, Zeng WH, Lin Y. Tian FJ, et al. Mol Ther Nucleic Acids. 2018 Sep 7;12:600-609. doi: 10.1016/j.omtn.2018.07.001. Epub 2018 Jul 6. Mol Ther Nucleic Acids. 2018. PMID: 30195796 Free PMC article. Retracted. - Inhibition of TMUB1 blocks apoptosis and NF-κB pathway-mediated inflammation in recurrent spontaneous abortion.
Zhang X, Hu Y, Zhang Z, Zhang X, Liang L, Cui X, Wu Y, Hu F, Wu X. Zhang X, et al. Immun Inflamm Dis. 2023 May;11(5):e879. doi: 10.1002/iid3.879. Immun Inflamm Dis. 2023. PMID: 37249279 Free PMC article. - Interleukin-33 modulates inflammation in endometriosis.
Miller JE, Monsanto SP, Ahn SH, Khalaj K, Fazleabas AT, Young SL, Lessey BA, Koti M, Tayade C. Miller JE, et al. Sci Rep. 2017 Dec 20;7(1):17903. doi: 10.1038/s41598-017-18224-x. Sci Rep. 2017. PMID: 29263351 Free PMC article. - A balancing act: RNA binding protein HuR/TTP axis in endometriosis patients.
Khalaj K, Ahn SH, Bidarimath M, Nasirzadeh Y, Singh SS, Fazleabas AT, Young SL, Lessey BA, Koti M, Tayade C. Khalaj K, et al. Sci Rep. 2017 Jul 19;7(1):5883. doi: 10.1038/s41598-017-06081-7. Sci Rep. 2017. PMID: 28724967 Free PMC article.
References
- Regan L, Rai R. Epidemiology and the medical causes of miscarriage. Baillieres Best Pract Res Clin Obstet Gynaecol. 2000;14:839–54. - PubMed
- Rai R, Regan L. Recurrent miscarriage. Lancet. 2006;368:601–11. - PubMed
- Winger EE, Reed JL. Treatment with tumor necrosis factor inhibitors and intravenous immunoglobulin improves live birth rates in women with recurrent spontaneous abortion. Am J Reprod Immunol. 2008;60:8–16. - PubMed
- Middeldorp S. Thrombosis in women: what are the knowledge gaps in 2013? J Thromb Haemost. 2013;11(Suppl 1):180–91. - PubMed
MeSH terms
Substances
LinkOut - more resources
Full Text Sources
Other Literature Sources


