XRCC1 mutation is associated with PARP1 hyperactivation and cerebellar ataxia - PubMed (original) (raw)
. 2017 Jan 5;541(7635):87-91.
doi: 10.1038/nature20790. Epub 2016 Dec 21.
Hana Hanzlikova 1, Stuart L Rulten 1, Martine Tétreault 3, Emilia Komulainen 1, Limei Ju 1, Peter Hornyak 1, Zhihong Zeng 1, William Gittens 1, Stephanie A Rey 4, Kevin Staras 4, Grazia M S Mancini 5, Peter J McKinnon 6, Zhao-Qi Wang 7, Justin D Wagner 8; Care4Rare Canada Consortium; Grace Yoon 9, Keith W Caldecott 1
Collaborators, Affiliations
- PMID: 28002403
- PMCID: PMC5218588
- DOI: 10.1038/nature20790
XRCC1 mutation is associated with PARP1 hyperactivation and cerebellar ataxia
Nicolas C Hoch et al. Nature. 2017.
Abstract
XRCC1 is a molecular scaffold protein that assembles multi-protein complexes involved in DNA single-strand break repair. Here we show that biallelic mutations in the human XRCC1 gene are associated with ocular motor apraxia, axonal neuropathy, and progressive cerebellar ataxia. Cells from a patient with mutations in XRCC1 exhibited not only reduced rates of single-strand break repair but also elevated levels of protein ADP-ribosylation. This latter phenotype is recapitulated in a related syndrome caused by mutations in the XRCC1 partner protein PNKP and implicates hyperactivation of poly(ADP-ribose) polymerase/s as a cause of cerebellar ataxia. Indeed, remarkably, genetic deletion of Parp1 rescued normal cerebellar ADP-ribose levels and reduced the loss of cerebellar neurons and ataxia in Xrcc1-defective mice, identifying a molecular mechanism by which endogenous single-strand breaks trigger neuropathology. Collectively, these data establish the importance of XRCC1 protein complexes for normal neurological function and identify PARP1 as a therapeutic target in DNA strand break repair-defective disease.
Conflict of interest statement
The authors declare that there is no conflict of interest.
Figures
Extended Data Figure 1. Aberrant splicing of XRCC1 pre-mRNA in XRCC1 patient cells
a, qPCR analysis of cDNA prepared from polyA-tailed RNA from wild type (WT), unaffected sibling, and patient LCLs. Cells were mock-treated or treated with cycloheximide (CHX) to inhibit nonsense-mediated decay. Cartoons show the position of primers employed to quantify total XRCC1 mRNA (left), mRNA with correctly spliced exon11/12 junction (middle) or intron 11 retention (right). Fold change was calculated from ΔΔCt values relative to actin and untreated WT from three independent experiments (mean +/-SEM). b, Summary of splicing defects observed in sequenced XRCC1 transcripts from sibling and patient cells treated with CHX. Whole XRCC1 cDNA was amplified from oligodT-primed reverse-transcribed RNA and individual transcripts cloned and sequenced. The allelic origin of individual patient transcripts was assigned using a R399Q SNP in the Q465X allele.
Extended Data Figure 2. XRCC1 and Lig3a protein levels in XRCC1-/- RPE-1 cells and XRCC1 patient cells
Quantification of XRCC1 (a) and Lig3α (b) protein levels in the indicated cell lines by Western blotting. Data are the mean signal intensity from three independent experiments (+/-SEM) normalized to tubulin and to the respective wild type (WT) sample for each cell type. The anti-XRCC1 signal detected in XRCC1-/- RPE-1 cells reflects non-specific background.
Extended Data Figure 3. Reduced XRCC1 recruitment into damaged chromatin in XRCC1 patient cells
a, XRCC1 recruitment into chromatin was compared in the indicated cell lines by ScanR high content imaging before and 10 min after treatment with 1 mM H2O2. Cells were pre-extracted with detergent prior to fixation and immunostaining. Representative images of the ScanR (Olympus) data used for the quantification in Fig. 2d are shown. b, XRCC1 recruitment into chromatin using high resolution Zeiss microscope was compared in the indicated cell lines after treatment 45 min with 30 μM CPT. Cells were pre-extracted with detergent prior to fixation and immunostaining as above. Scale bars in images are 10 μm.
Extended Data Figure 4
Representative images from ScanR high-content imaging of gH2AX foci (green) in the nuclei (blue) of the indicated cells at the indicated times after ionising radiation (2 Gy). Quantification is shown in Fig. 3b.
Extended Data Figure 5. Elevated ADP-ribosylation in XRCC1-/- RPE-1 cells, XRCC1 patient fibroblasts, and PNKP patient fibroblasts
a, ADP-ribosylated proteins were detected in cell extracts from wild type RPE-1 cells (“WT”), XRCC1-/- RPE-1 cells, wild type 1BR fibroblasts, XRCC1 patient fibroblasts (“X1 patient”), and PNKP patient fibroblasts treated as in Fig. 4a by Western blotting and Anti-pan-ADP-ribose binding reagent. b, Levels of ADP-ribosylation in 1BR wild type, XRCC1 patient, and PNKP patient fibroblasts measured before and after CPT treatment by indirect immunofluorescence as indicated in Fig. 4b. Representative ScanR images are shown.
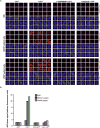
Extended Data Figure 6. Elevated ADP-ribose levels in CPT-treated XRCC1-/- RPE-1 cells are PARP1 dependent
a, Representative ScanR images of wild type (“WT”), XRCC1-/-, PARP1-/-, and XRCC1-/-/PARP1-/- RPE-1 cells before and after 30 μM CPT treatment stained by indirect immunofluorescence for XRCC1, PARP1, DAPI or ADP-ribose. b, Quantification of ADP-ribose intensity in the nucleus from >3500 cells per sample from a (data from single experiment). c, Western blot showing XRCC1 and PARP1 protein levels in the indicated RPE-1 cell lines.
Extended Data Figure 7. Elevated ADP-ribose levels in CPT-treated XRCC1 patient and PNKP patient cells are prevented by PARP inhibitors
Levels of ADP-ribose in wild type 1BR fibroblasts, XRCC1 patient fibroblasts and PNKP patient fibroblasts were measured before and after 45 min 30 μM CPT treatment, and after 45 min 30 μM CPT treatment in the presence of 10 μM of the indicated PARP inhibitor (also including 1 hour pre-treatment). Cells were pre-extracted with detergent prior to fixation and immunostaining with Anti-pan-ADP-ribose binding reagent. Representative ScanR images are shown in a and quantification from >1500 cells per sample, from a single experiment, are shown in b.
Extended Data Figure 8
Levels of ADP-ribosylation were quantified before and after CPT treatment by high content imaging in wild type 1BR fibroblasts, XRCC1 patient fibroblasts, and XRCC1 patient fibroblasts transfected by electroporation in the presence of 1 mg or 2 mg of control BSA or purified recombinant human XRCC1-His protein. Representative ScanR images are presented. Quantification of ADP-ribosylation is shown in Fig. 4d.
Extended Data Figure 9. Reduced cerebellar Purkinje cell firing frequency in Xrcc1Nes-Cre (KO) mice
a, Representative traces from cell-attached recordings. b, Summary of data. Bars and error bars indicate mean (+/-SEM) firing frequencies for Xrcc1 WT (13.35 ± 1.73, n = 14 cells) versus Xrcc1Nes-Cre mice (8.96 ± 0.82, n = 18 cells)(*p<0.05, t-test). Circles are mean firing frequencies for each cell.
Extended Data Figure 10
Chromosomal single-strand break repair rates in the indicated RPE-1 cell lines following treatment with 50 μM H2O2 in the presence/absence of 10 μM of the PARP inhibitor (PARPi) Veliparib, as measured by alkaline comet assay. Data are the mean tail moment of 100 cells per sample per experiment and are the average (-/+SEM) of three independent experiments. Two-way ANOVA analysis between relevant genotypes is presented (ns= not significant, **= p<0.01, ***= p<0.001).
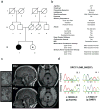
Figure 1. XRCC1 mutations are associated with cerebellar ataxia, ocular motor apraxia and axonal neuropathy
a, Pedigree of the proband (III.1; black circle) and unaffected sibling (III.2; circle/black dot). b, Proband clinical features (see Supplementary Information for full description). c, Proband MRI at 40yr and 47yr. Sagittal T1 weighted images (middle) demonstrating vermian atrophy and Axial FLAIR images (right) demonstrating atrophy of the cortex of the vermis and cerebellar hemispheres. The cerebellum is circled and insets (left) are magnifications highlighting the cerebellar atrophy. d, Sanger sequencing confirming the mutations c.1293G>C (p.K431N) and c.1393C>T (p.Q465*) in the proband (III.1) and c.1293G>C (p.K431N) in the unaffected sibling (III.2).
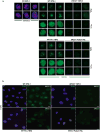
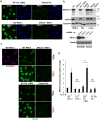
Figure 2. Patient XRCC1 mutations reduce XRCC1 levels and recruitment into chromatin
a, XRCC1 levels measured by immunofluorescence in wild type (“WT”) 1BR fibroblasts, WT RPE-1 cells, XRCC1 patient fibroblasts, and XRCC1-/- RPE-1 cells. b, Top, XRCC1 & Lig3α levels measured in the above cells by Western blotting and additionally in WT, XRCC1-patient, and sibling LCLs. The source data are included in Supplementary Figure 1. Bottom, WT or patient fibroblasts were transfected with non-targeting or XRCC1 siRNA and immunoblotted as above. c, XRCC1 chromatin binding measured by immunofluorescence in the indicated cells before and 10 min after treatment with 1 mM H2O2. d, Quantitation of XRCC1 in chromatin (excluding nucleoli) from >1000 cells per sample using ScanR software. Data are the mean (+/-1SD) of three independent experiments. Statistical analysis (two-tailed t-test) is indicated (**p<0.01; “ns”, not significant). Representative ScanR images are in Extended Data Fig. 3a. Scale bars; 10 μm.
Figure 3. Patient XRCC1 mutations reduce single-strand break repair
a, DNA strand breaks quantified in the indicated fibroblasts (left) or RPE-1 cells (right) by alkaline comet assays before and at the indicated times after H2O2 treatment. Data are the mean (+/-SEM) comet tail moments (an arbitrary unit-measure of DNA strands) of three independent experiments. Statistical analyses (two-way ANOVA) are indicated (*p<0.05; **p<0.01). b, DSBs quantified as γH2AX foci in the indicated cell lines before and at the indicated times after ionising radiation (2 Gy). Data are the mean γH2AX foci per cell (+/-1SD) from three independent experiments (∼1000 cells/sample/experiment). Statistical analysis as above. Representative images are in Extended Data Fig. 4. c, SCE frequencies per chromosome (mean +/-1SEM) quantified in control and XRCC1 patient LCLs (36 metaphases per genotype). Representative metaphases (arrows, SCEs) are shown, left. Statistical analysis; two-tailed t-test (**p<0.01; ns, not significant). Scale bars; 10 μm.
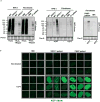
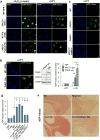
Figure 4. XRCC1 mutation elevates ADP-ribosylation in cells and cerebellum
a, ADP-ribosylation in wild type (WT) 1BR fibroblasts, WT RPE-1 cells, XRCC1-patient fibroblasts, and XRCC1-/- RPE-1 cells following H2O2 or CPT treatment. b, Left, ADP-ribosylation levels in 1BR or PNKP patient fibroblasts following CPT treatment. Middle, PNKP, XRCC1, and PARP1 levels in 1BR and PNKP patient fibroblasts. The source data are included in Supplementary Figure 1. Right, ADP-ribose levels quantified by ScanR imaging in 1BR, XRCC1-mutant patient, and PNKP patient fibroblasts before and after CPT treatment. Data are mean (+/-1SD) ADP-ribose levels (relative to untreated 1BR cells) from three independent experiments (>1000 cells/sample). Statistically significant differences (two-tailed t-test) are indicated (*p<0.05). c, ADP-ribosylation levels in the indicated RPE-1 cells following CPT treatment. d, ADP-ribosylation levels quantified by ScanR imaging before and after CPT treatment in 1BR and XRCC1 patient fibroblasts (“X1 pat.”) with or without transfection with 1 μg or 2 μg of BSA or recombinant human XRCC1 protein. Statistical analyses as above. Representative ScanR images are in Extended Data Figure 8. e, ADP-ribosylation levels measured by immunohistochemistry in cerebellar sections from WT mice or mice deleted (“KO”) of Xrcc1 and/or Parp1. Scale bars in IF images are 10 μm and in histology images are 1 mm.
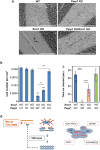
Figure 5. Parp1 deletion restores normal interneuron density and reduces cerebellar ataxia in XRCC1Nes-Cre mice
a, Representative cerebellar sections from wild type mice or mice deleted (“KO”) of Xrcc1 and/or Parp1 stained with Nissl to detect neurones. Scale bars are 200 μm. gl; granule layer; ml, molecular layer; pc, Purkinje cells. Black arrows indicate interneurons. b, Interneuron density in the molecular layer of cerebella of the indicated genotype. Data are the mean (+/-SEM) Nissl-positive cells per μm2 of 5-10 mice per genotype. T-test comparisons are indicated (**p<0.01, ***p<0.001). c, Motor coordination in mice of the indicated genotype measured on a rotarod (mouse numbers analysed indicated in/above the bars). Statistical tests as above. d, Model for PARP1 hyperactivation and neural death triggered by unrepaired SSBs. PARP1 activation at SSBs triggers auto- and trans- protein ADP-ribosylation (red wavy lines). XRCC1 binds poly(ADP-ribose) and assembles SSBR protein complexes. Mutated XRCC1 or partner proteins results in delayed SSBR and PARP1 ‘hyperactivation’, resulting in cyotoxic levels of poly(ADP-ribose) and/or NAD+ depletion. SSBR proteins and their associated cerebellar ataxias are highlighted/boxed in red. SCAN1; spinocerebellar ataxia with axonal neuropathy-1 (TDP1-mutated). AOA1; ataxia oculomotor apraxia-1 (_APTX_-mutated). AOA4; ataxia oculomotor apraxia-4 (_PNKP_-mutated). AOA-XRCC1; ataxia oculomotor apraxia-XRCC1 mutated.
Comment in
- DNA repair: A unifying mechanism in neurodegeneration.
Ross CA, Truant R. Ross CA, et al. Nature. 2017 Jan 5;541(7635):34-35. doi: 10.1038/nature21107. Epub 2016 Dec 21. Nature. 2017. PMID: 28002410 No abstract available. - Ataxia with oculomotor apraxia is associated with the DNA damage repair pathway.
Ganos C, Bras J. Ganos C, et al. Mov Disord. 2017 May;32(5):720. doi: 10.1002/mds.26971. Epub 2017 Mar 9. Mov Disord. 2017. PMID: 28276091 No abstract available.
Similar articles
- Overlapping roles for PARP1 and PARP2 in the recruitment of endogenous XRCC1 and PNKP into oxidized chromatin.
Hanzlikova H, Gittens W, Krejcikova K, Zeng Z, Caldecott KW. Hanzlikova H, et al. Nucleic Acids Res. 2017 Mar 17;45(5):2546-2557. doi: 10.1093/nar/gkw1246. Nucleic Acids Res. 2017. PMID: 27965414 Free PMC article. - The Rev1 interacting region (RIR) motif in the scaffold protein XRCC1 mediates a low-affinity interaction with polynucleotide kinase/phosphatase (PNKP) during DNA single-strand break repair.
Breslin C, Mani RS, Fanta M, Hoch N, Weinfeld M, Caldecott KW. Breslin C, et al. J Biol Chem. 2017 Sep 29;292(39):16024-16031. doi: 10.1074/jbc.M117.806638. Epub 2017 Aug 16. J Biol Chem. 2017. PMID: 28821613 Free PMC article. - Clinical and Genetic Characterization of Brazilian Patients with Ataxia and Oculomotor Apraxia.
da Costa SCG, Rezende Filho FM, de Freitas JL, de Assis Pereira Matos PCA, Della-Ripa B, França MC Jr, Marques W Junior, Santos M, Cronemberger IVB, Vale TC, Kok F, Alonso I, Pedroso JL, Barsottini OGP. da Costa SCG, et al. Mov Disord. 2022 Jun;37(6):1309-1316. doi: 10.1002/mds.29015. Epub 2022 Apr 14. Mov Disord. 2022. PMID: 35426160 - Nonsyndromic cerebellar ataxias associated with disorders of DNA single-strand break repair.
Yoon G, Caldecott KW. Yoon G, et al. Handb Clin Neurol. 2018;155:105-115. doi: 10.1016/B978-0-444-64189-2.00007-X. Handb Clin Neurol. 2018. PMID: 29891053 Review. - The structural basis of XRCC1-mediated DNA repair.
London RE. London RE. DNA Repair (Amst). 2015 Jun;30:90-103. doi: 10.1016/j.dnarep.2015.02.005. Epub 2015 Feb 16. DNA Repair (Amst). 2015. PMID: 25795425 Free PMC article. Review.
Cited by
- Nucleo-cytoplasmic transport defects and protein aggregates in neurodegeneration.
Bitetto G, Di Fonzo A. Bitetto G, et al. Transl Neurodegener. 2020 Jul 3;9(1):25. doi: 10.1186/s40035-020-00205-2. Transl Neurodegener. 2020. PMID: 32616075 Free PMC article. Review. - A high-throughput 384-well CometChip platform reveals a role for 3-methyladenine in the cellular response to etoposide-induced DNA damage.
Li J, Beiser A, Dey NB, Takeda S, Saha LK, Hirota K, Parker LL, Carter M, Arrieta MI, Sobol RW. Li J, et al. NAR Genom Bioinform. 2022 Sep 13;4(3):lqac065. doi: 10.1093/nargab/lqac065. eCollection 2022 Sep. NAR Genom Bioinform. 2022. PMID: 36110898 Free PMC article. - Epigenetics in amyotrophic lateral sclerosis: a role for histone post-translational modifications in neurodegenerative disease.
Bennett SA, Tanaz R, Cobos SN, Torrente MP. Bennett SA, et al. Transl Res. 2019 Feb;204:19-30. doi: 10.1016/j.trsl.2018.10.002. Epub 2018 Oct 12. Transl Res. 2019. PMID: 30391475 Free PMC article. Review. - XRCC1 Prevents Replication Fork Instability during Misincorporation of the DNA Demethylation Bases 5-Hydroxymethyl-2'-Deoxycytidine and 5-Hydroxymethyl-2'-Deoxyuridine.
Peña-Gómez MJ, Suárez-Pizarro M, Rosado IV. Peña-Gómez MJ, et al. Int J Mol Sci. 2022 Jan 14;23(2):893. doi: 10.3390/ijms23020893. Int J Mol Sci. 2022. PMID: 35055077 Free PMC article. - PARP1 and XRCC1 exhibit a reciprocal relationship in genotoxic stress response.
Reber JM, Božić-Petković J, Lippmann M, Mazzardo M, Dilger A, Warmers R, Bürkle A, Mangerich A. Reber JM, et al. Cell Biol Toxicol. 2023 Feb;39(1):345-364. doi: 10.1007/s10565-022-09739-9. Epub 2022 Jul 1. Cell Biol Toxicol. 2023. PMID: 35778544 Free PMC article.
References
- Caldecott KW. Single-strand break repair and genetic disease. Nat Rev Genet. 2008;9:619–631. - PubMed
- Caldecott KW. XRCC1 and DNA strand break repair. DNA Repair (Amst) 2003;2:955–969. - PubMed
Publication types
MeSH terms
Substances
Supplementary concepts
Grants and funding
- R56 NS037956/NS/NINDS NIH HHS/United States
- R01 NS037956/NS/NINDS NIH HHS/United States
- MR/J006750/1/MRC_/Medical Research Council/United Kingdom
- MR/P010121/1/MRC_/Medical Research Council/United Kingdom
- P30 CA021765/CA/NCI NIH HHS/United States
- P01 CA096832/CA/NCI NIH HHS/United States
- 16771/CRUK_/Cancer Research UK/United Kingdom
LinkOut - more resources
Full Text Sources
Other Literature Sources
Medical
Molecular Biology Databases
Research Materials
Miscellaneous


