Biliary tract instillation of a SMAC mimetic induces TRAIL-dependent acute sclerosing cholangitis-like injury in mice - PubMed (original) (raw)
Biliary tract instillation of a SMAC mimetic induces TRAIL-dependent acute sclerosing cholangitis-like injury in mice
Maria Eugenia Guicciardi et al. Cell Death Dis. 2017.
Abstract
Primary sclerosing cholangitis (PSC) is a cholestatic liver disease of unknown etiopathogenesis characterized by fibrous cholangiopathy of large and small bile ducts. Systemic administration of a murine TNF-related apoptosis-inducing ligand (TRAIL) receptor agonist induces a sclerosing cholangitis injury in C57BL/6 mice, suggesting endogenous TRAIL may contribute to sclerosing cholangitis syndromes. Cellular inhibitor of apoptosis proteins (cIAP-1 and cIAP-2) are negative regulators of inflammation and TRAIL receptor signaling. We hypothesized that if endogenous TRAIL promotes sclerosing cholangitis, then cIAP depletion should also induce this biliary tract injury. Herein, we show that cIAP protein levels are reduced in the interlobular bile ducts of human PSC livers. Downregulation of cIAPs in normal human cholangiocytes in vitro by use of a SMAC mimetic (SM) induces moderate, ripoptosome-mediated apoptosis and RIP1-independent upregulation of proinflammatory cytokines and chemokines. Cytokine and chemokine expression was mediated by the non-canonical activation of NF-κB. To investigate whether downregulation of cIAPs is linked to generation of a PSC-like phenotype, an SM was directly instilled into the mouse biliary tree. Twelve hours after biliary instillation, TUNEL-positive cholangiocytes were identified; 5 days later, PSC-like changes were observed in the SM-treated mice, including a fibrous cholangiopathy of the interlobular bile ducts, portal inflammation, significant elevation of serum markers of cholestasis and cholangiographic evidence of intrahepatic biliary tract injury. In contrast, TRAIL and TRAIL-receptor deficient mice showed no sign of cholangiopathy following SM intrabiliary injection. We conclude that in vivo antagonism of cIAPs in mouse biliary epithelial cells is sufficient to trigger cholangiocytes apoptosis and a proinflammatory response resulting in a fibrous cholangiopathy resembling human sclerosing cholangitis. Therefore, downregulation of cIAPs in PSC cholangiocytes may contribute to the development of the disease. Our results also indicate that inhibition of TRAIL signaling pathways may be beneficial in the treatment of PSC.
Conflict of interest statement
The authors declare no conflict of interest.
Figures
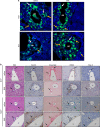
Figure 1
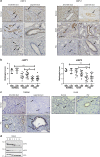
cIAP-1 and cIAP-2 are downregulated in cholangiocytes of PSC patients. (a) Representative images of liver sections stained for cIAP-1 (left panel) and cIAP-2 (right panel) in patients with normal, NASH and PSC (stage IV) liver histology. Photomicrographs of small bile ducts (SBD) and large bile ducts (LBD) taken at × 20 magnification. The arrows point to the bile ducts. (b) Histological scoring for cIAP-1 in normal (5, 31), NASH (12, 120) and PSC (16, 131) patients and for cIAP-2 in normal (5, 31), NASH (12, 118) and PSC (16, 123) patients. Numbers in parentheses indicate total number of patients and total number of small and large bile ducts evaluated, respectively. Grade 0=no protein expression; grade 3=high protein expression. **P<0.01, ***P<0.001. (c) Representative images of liver sections stained for TWEAK (left panel) and Fn14 (right panel) from patients with normal or PSC (stage IV) liver histology. Photomicrographs of small bile ducts and large bile ducts taken at × 40 and × 20 magnification, respectively. The arrows point to the bile ducts. (d) Immunoblot analysis showing expression of cIAP-1, cIAP-2 and actin (loading control) in H69 cells treated with human recombinant TWEAK (100 ng/ml) for the indicated times
Figure 2
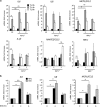
Normal human cholangiocytes are moderately sensitive to SM-induced, ripoptosome-mediated apoptosis. (a) Apoptosis assessed morphologically after DAPI staining (top panels) and by caspase 3/7 activation (bottom panels) in human cholangiocyte cell lines H69 and NHC, and the human breast cancer cell line MDA-MB-231, incubated for 24 h with or without (cnt) the SMAC mimetic TL32711 (1 μ_M), in the presence or absence of neutralizing antibodies against TNF_α (1 _μ_g/ml) or FasL (1 _μ_g/ml), or recombinant TRAIL-R2:Fc (1 _μ_g/ml). (b) TNFα and TRAIL gene expression analyzed by qPCR in H69, NHC and MDA-MB-231 cells incubated in the presence of TL32711 for the indicated times. Expression normalized to GAPDH RNA. Data are expressed as fold increase over control. Mean±s.e. are depicted from three independent experiments in H69 and NHC (c) H69 cells were treated with TL32711 and subjected to caspase 8 immunoprecipitation at the indicated time points. Affinity-purified proteins and total cell lysates (input) were analyzed by immunoblot for caspase 8, FADD and RIP1. (d) NHC cells were incubated with or without the TL32711 for 24 h, in the presence or absence of the pan-caspase inhibitor Q-VD-OPh (QVD, 10 _μ_M) or the RIP1 kinase inhibitor necrostatin 1 (nec-1, 20 _μ_M). Apoptosis was assessed morphologically after DAPI staining (left panel) and by caspase 3/7 activation (right panel). (e) H69 and _RIP1_−/− H69 (clones 1 and 2) were incubated for 24 h in the presence or absence of TL32711. Apoptosis was assessed by DAPI staining (left panel) and by caspase 3/7 activation (right panel). In (a, d and e), mean±S.E. are depicted from three independent experiments performed in triplicate. *P<0.05, **P<0.005
Figure 3
SM induces upregulation of pro-inflammatory cytokines independent of RIP1. (a) IL6, IL8, MCP1/CCL2, IL1β, RANTES/CCL5 and TNFα gene expression analyzed by qPCR in H69 and _RIP1_−/− H69 (clones 1 and 2) incubated in the presence of TL32711 for the indicated times. Expression normalized to 18S rRNA. (b) IL6, IL8 and MCP1/CCL2 gene expression analyzed by qPCR in H69 and NHC incubated in the presence of BV6 (5 _μ_M) at the indicated times. Expression normalized to GAPDH RNA. Data are expressed as fold increase over control. Mean±S.E. are depicted from three independent experiments. *P<0.05, **P<0.005; NS, not significant
Figure 4
SM-induced upregulation of pro-inflammatory cytokines is mediated by activation of the non-canonical NF-κ_B pathway. (a) Immunoblot analysis showing expression of cIAP-1, cIAP-2, NIK, I_κ_B_α, PARP, IL-6 and actin (loading control) in H69 cells treated with TL32711 for the indicated times. (b) Immunoblot analysis showing expression of RIP1, NIK, NF-κ_B2, actin (loading control), I_κ_B_α and GAPDH (loading control) in H69 and _RIP1_−/− H69 cells treated with TL32711 for the indicated times. (c) IL6, IL8 and MCP1/CCL2 gene expression analyzed by qPCR in NHC cell line transiently transfected with siRNA against NF-_κ_B2 (p100) or scrambled siRNA for 48 h and incubated in the presence or absence (cnt) of TL32711 for 4 h. Efficiency of the knockdown was evaluated by immunoblot (insert). Data are expressed as fold increase over control. Mean±S.E. are depicted from six independent experiments. *P<0.05, **P<0.005
Figure 5
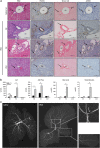
SM intrabiliary instillation in mice results in a transient PSC-like liver injury. (a) Representative images of liver sections from mice injected with a single dose of BV6 in the biliary tree and killed after 3, 5 or 21 days; and mice injected with saline and killed after 5 days. Hematoxylin–eosin (H&E)-staining, cholangiocyte staining by panCK IHC, collagen staining by picrosirius red-stain and _α_-smooth muscle actin (_α_SMA) IHC are depicted. Photomicrographs taken at × 20 magnification. The arrows point to the bile ducts; pv, portal vein. (b) Serum alanine aminotransferase (ALT), alkaline phosphatase (Alk Phos), total bile acids and total bilirubin measured in mice killed 3, 5 or 21 days after a single dose intrabiliary injection of BV6. Day 3: saline (_n_=4), BV6 (_n_=6); day 5: saline (_n_=8), BV6 (_n_=8); day 21: saline (_n_=6), BV6 (_n_=5). *P<0.05, **P<0.005. (c) Representative cholangiographic images of mouse livers 5 days after intrabiliary injection of saline or BV6. Enlargements of the indicated areas are shown next to the original picture. The arrow in the top magnification panel shows a stricture in an intrahepatic duct and adjacent dilatation. The bottom magnification panel shows damage/loss of small bile ducts. The gall bladder was resected to facilitate optimal visualization of the biliary tree during the cholangiograms
Figure 6
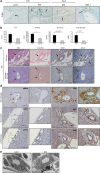
SM intrabiliary instillation in mice causes early cholangiocyte apoptosis and triggers periductal inflammation. (a) Representative images of TUNEL staining on fixed mouse liver specimens 12 h after intrabiliary injection of saline or BV6, 5 days after intrabiliary injection of BV6, or 4 days after systemic injection of MD5-1. The latter mice received two consecutive injections of MD5-1 (300 _μ_g/mouse) on day 1 and day 4 and were killed at day 8. This experimental paradigm induces cholangiocyte apoptosis and was used as positive control. The black arrows point to the bile ducts; the white arrows point to TUNEL-positive/apoptotic cholangiocytes. Photomicrographs taken at × 40 magnification. (b) Serum ALT, alkaline phosphatase, total bile acids and total bilirubin measured in mice killed 5 days after intrabiliary instillation of BV6 or BV6+IDN-7314. BV6 (_n_=7); BV6+IDN-7314 (_n_=5). **P<0.005. (c) Representative images of H&E staining, collagen staining by picrosirius red-stain and immunohistochemical staining for _α_-smooth muscle actin and Mac-2/galectin3 (marker of phagocytically active macrophages) on liver sections of mice 5 days after intrabiliary instillation of BV6 or BV6+IDN-7314. The arrows point to the bile ducts. Photomicrographs taken at × 20 magnification; pv, portal vein. (d) Representative images of immunohistochemical staining for Mac-2/Galectin 3 (macrophages, top panel), mouse neutrophil differentiation antigen (neutrophils, middle panel) and CD3 (lymphocytes, bottom panel) on fixed mouse liver specimens 5 days after intrabiliary instillation of saline or BV6. Photomicrographs taken at × 20 magnification. Enlargements of the indicated areas are shown next to the original pictures; pv, portal vein. (e) Representative transmission electron microscopy (TEM) images of mouse liver specimens 5 days after intrabiliary injection of saline or BV6. The arrow points to a macrophage adjacent to the bile duct
Figure 7
Dr5−/− and Trail−/− mice are resistant to biliary injury following SM intrabiliary instillation. (a) In situ hybridization using mRNA detection probes for Trail and Dr5 performed on liver tissue sections of saline- or BV6-treated mice at day 5. The white arrows point to cholangiocytes. The orange arrows point to surrounding infiltrating cells (inflammatory cells, fibroblasts); BD, bile duct. (b) Representative images of liver sections from Dr5 /- (top) and _Trail_−/− (bottom) mice injected with a single dose of BV6 or saline in the biliary tree and killed after 5 days. H&E staining, panCK IHC, picrosirius red-stain (collagen), _α_-smooth muscle actin IHC and Mac2 staining are depicted. Photomicrographs taken at × 20 magnification. The arrows point to the bile ducts; pv, portal vein. (c) Serum ALT, alkaline phosphatase, total bile acids and total bilirubin. _Dr5_−/−: saline (_n_=5), BV6 (_n_=5); _Trail_−/−: saline (_n_=4), BV6 (_n_=7). *P<0.05. (d) Il6, Il8, Il1β, Tnfα, Mcp-1/Ccl2, Cd68 and Coll-1α1 gene expression analyzed by qPCR in total liver lysates of wild-type, _Dr5_−/− and _Trail_−/− mice. Expression normalized to 18S rRNA. Data are expressed as fold increase over control. Mean±S.E. are depicted. *P<0.05, **P<0.005; NS, not significant
Similar articles
- Downregulation of TGR5 (GPBAR1) in biliary epithelial cells contributes to the pathogenesis of sclerosing cholangitis.
Reich M, Spomer L, Klindt C, Fuchs K, Stindt J, Deutschmann K, Höhne J, Liaskou E, Hov JR, Karlsen TH, Beuers U, Verheij J, Ferreira-Gonzalez S, Hirschfield G, Forbes SJ, Schramm C, Esposito I, Nierhoff D, Fickert P, Fuchs CD, Trauner M, García-Beccaria M, Gabernet G, Nahnsen S, Mallm JP, Vogel M, Schoonjans K, Lautwein T, Köhrer K, Häussinger D, Luedde T, Heikenwalder M, Keitel V. Reich M, et al. J Hepatol. 2021 Sep;75(3):634-646. doi: 10.1016/j.jhep.2021.03.029. Epub 2021 Apr 17. J Hepatol. 2021. PMID: 33872692 - Lysyl oxidase-like protein 2 (LOXL2) modulates barrier function in cholangiocytes in cholestasis.
Pollheimer MJ, Racedo S, Mikels-Vigdal A, Marshall D, Bowlus C, Lackner C, Madl T, Karlsen TH, Hov JR, Lyman SK, Adamkewicz J, Smith V, Moreau E, Zollner G, Eide TJ, Stojakovic T, Scharnagl H, Gruber HJ, Stauber RE, Trauner M, Fickert P. Pollheimer MJ, et al. J Hepatol. 2018 Aug;69(2):368-377. doi: 10.1016/j.jhep.2018.04.009. Epub 2018 Apr 28. J Hepatol. 2018. PMID: 29709678 - Cholangiocytes in the pathogenesis of primary sclerosing cholangitis and development of cholangiocarcinoma.
Chung BK, Karlsen TH, Folseraas T. Chung BK, et al. Biochim Biophys Acta Mol Basis Dis. 2018 Apr;1864(4 Pt B):1390-1400. doi: 10.1016/j.bbadis.2017.08.020. Epub 2017 Aug 25. Biochim Biophys Acta Mol Basis Dis. 2018. PMID: 28844951 Review. - Antagonistic effects of the cytotoxic molecules granzyme B and TRAIL in the immunopathogenesis of sclerosing cholangitis.
Kellerer M, Javed S, Casar C, Will N, Berkhout LK, Schwinge D, Krebs CF, Schramm C, Neumann K, Tiegs G. Kellerer M, et al. Hepatology. 2024 Oct 1;80(4):844-858. doi: 10.1097/HEP.0000000000000830. Epub 2024 Mar 5. Hepatology. 2024. PMID: 38441998 Free PMC article. - Autophagy and senescence in fibrosing cholangiopathies.
Nakanuma Y, Sasaki M, Harada K. Nakanuma Y, et al. J Hepatol. 2015 Apr;62(4):934-45. doi: 10.1016/j.jhep.2014.11.027. Epub 2014 Nov 27. J Hepatol. 2015. PMID: 25435435 Review.
Cited by
- Tumor Necrosis Factor-Related Apoptosis-Inducing Ligand Receptor Deficiency Promotes the Ductular Reaction, Macrophage Accumulation, and Hepatic Fibrosis in the Abcb4-/- Mouse.
Krishnan A, Katsumi T, Guicciardi ME, Azad AI, Ozturk NB, Trussoni CE, Gores GJ. Krishnan A, et al. Am J Pathol. 2020 Jun;190(6):1284-1297. doi: 10.1016/j.ajpath.2020.02.013. Epub 2020 Mar 30. Am J Pathol. 2020. PMID: 32240619 Free PMC article. - The Spectrum of Reactive Cholangiocytes in Primary Sclerosing Cholangitis.
Guicciardi ME, Trussoni CE, LaRusso NF, Gores GJ. Guicciardi ME, et al. Hepatology. 2020 Feb;71(2):741-748. doi: 10.1002/hep.31067. Hepatology. 2020. PMID: 31833071 Free PMC article. Review. - PD-L1 and IAPs co-operate to protect tumors from cytotoxic lymphocyte-derived TNF.
Kearney CJ, Lalaoui N, Freeman AJ, Ramsbottom KM, Silke J, Oliaro J. Kearney CJ, et al. Cell Death Differ. 2017 Oct;24(10):1705-1716. doi: 10.1038/cdd.2017.94. Epub 2017 Jun 30. Cell Death Differ. 2017. PMID: 28665401 Free PMC article. - TRAIL Deletion Prevents Liver, but Not Adipose Tissue, Inflammation during Murine Diet-Induced Obesity.
Hirsova P, Weng P, Salim W, Bronk SF, Griffith TS, Ibrahim SH, Gores GJ. Hirsova P, et al. Hepatol Commun. 2017 Sep;1(7):648-662. doi: 10.1002/hep4.1069. Epub 2017 Jul 20. Hepatol Commun. 2017. PMID: 29124251 Free PMC article. - Multi-omic analysis reveals divergent molecular events in scarring and regenerative wound healing.
Mascharak S, Talbott HE, Januszyk M, Griffin M, Chen K, Davitt MF, Demeter J, Henn D, Bonham CA, Foster DS, Mooney N, Cheng R, Jackson PK, Wan DC, Gurtner GC, Longaker MT. Mascharak S, et al. Cell Stem Cell. 2022 Feb 3;29(2):315-327.e6. doi: 10.1016/j.stem.2021.12.011. Epub 2022 Jan 24. Cell Stem Cell. 2022. PMID: 35077667 Free PMC article.
References
- Alabraba E, Nightingale P, Gunson B, Hubscher S, Olliff S, Mirza D et al. A re-evaluation of the risk factors for the recurrence of primary sclerosing cholangitis in liver allografts. Liver Transpl 2009; 15: 330–340. - PubMed
- Fickert P, Zollner G, Fuchsbichler A, Stumptner C, Weiglein AH, Lammert F et al. Ursodeoxycholic acid aggravates bile infarcts in bile duct-ligated and Mdr2 knockout mice via disruption of cholangioles. Gastroenterology 2002; 123: 1238–1251. - PubMed
- Pollheimer MJ, Trauner M, Fickert P. Will we ever model PSC? – ‘it's hard to be a PSC model!'. Clin Res Hepatol Gastroenterol 2011; 35: 792–804. - PubMed
Publication types
MeSH terms
Substances
LinkOut - more resources
Full Text Sources
Other Literature Sources
Molecular Biology Databases
Miscellaneous
