Polyphyllin I induces mitophagic and apoptotic cell death in human breast cancer cells by increasing mitochondrial PINK1 levels - PubMed (original) (raw)
. 2017 Feb 7;8(6):10359-10374.
doi: 10.18632/oncotarget.14413.
Ruo-Qiu Fu 1, Han-Ming Shen 3, Jing Zhou 1, Xiao-Ye Hu 1, Yan-Xia Liu 1, Yu-Nong Li 1, Hong-Wei Zhang 1, Xin Liu 1, Yan-Hao Zhang 1, Cheng Huang 4, Rong Zhang 2, Ning Gao 1
Affiliations
- PMID: 28060722
- PMCID: PMC5354664
- DOI: 10.18632/oncotarget.14413
Polyphyllin I induces mitophagic and apoptotic cell death in human breast cancer cells by increasing mitochondrial PINK1 levels
Guo-Bing Li et al. Oncotarget. 2017.
Abstract
The molecular mechanisms underlying the anti-breast cancer effects of polyphyllin I, a natural compound extracted from Paris polyphylla rhizomes, are not fully understood. In the present study, we found that polyphyllin I induces mitochondrial translocation of DRP1 by dephosphorylating DRP1 at Ser637, leading to mitochondrial fission, cytochrome c release from mitochondria into the cytosol and, ultimately apoptosis. Polyphyllin I also increased the stabilization of full-length PINK1 at the mitochondrial surface, leading to the recruitment of PARK2, P62, ubiquitin, and LC3B-II to mitochondria and culminating in mitophagy. PINK1 knockdown markedly suppressed polyphyllin I-induced mitophagy and enhanced polyphyllin I-induced, DRP1-dependent mitochondrial fission and apoptosis. Furthermore, suppression of DRP1 by mdivi-1 or shRNA inhibited PINK1 knockdown/polyphyllin I-induced mitochondrial fragmentation and apoptosis, suggesting that PINK1 depletion leads to excessive fission and, subsequently, mitochondrial fragmentation. An in vivo study confirmed that polyphyllin I greatly inhibited tumor growth and induced apoptosis in MDA-MB-231 xenografts, and these effects were enhanced by PINK1 knockdown. These data describe the mechanism by which PINK1 contributes to polyphyllin I-induced mitophagy and apoptosis and suggest that polyphyllin I may be an effective drug for breast cancer treatment.
Keywords: DRP1; PINK1; mitochondrial fission; mitophagy; polyphyllin I.
Conflict of interest statement
CONFLICTS OF INTEREST
The authors declare no conflicts of interest.
Figures
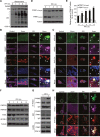
Figure 1. Polyphyllin I induces apoptosis via the mitochondrial pathway in MDA-MB-231 cells
A-B. MDA-MB-231 cells were treated with various concentrations of polyphyllin I (PPI) for 9 h or with 8 μM PPI for different periods of time as indicated. Cells were stained using an Annexin V-FITC Apoptosis Detection Kit I or rhodamine 123, apoptosis and mitochondrial (Mt) membrane potential were detected with flow cytometry. Data are presented as mean ± SD (*P< 0.05 or **P< 0.01 vs. the control). C. Whole-cell lysates (WCL), mitochondrial (Mito), and cytosolic (Cyto) fractions were prepared and subjected to western blot analysis using antibodies against cleaved-PARP (C-PARP), cleaved-CASP9 (C-CASP9), cleaved-CASP3 (C-CASP3), and cytochrome c (Cyto C). Tubulin (whole-cell lysates) and COX IV (mitochondrial fraction) were used as the loading controls. D. MDA-MB-231 cells were transfected with RFP-mito plasmids and then exposed to PPI (8 μM) for 12 h. After immunostaining with Cyto C (Alexa Fluor 488, green), cells were examined by confocal microscopy. Scale bars: 10 μm.
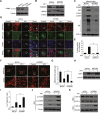
Figure 2. Polyphyllin I induces mitochondrial fission and mitophagy
A. MDA-MB-231 cells were exposed to 8 μM PPI for different periods of time as indicated or treated with 20 μM CCCP (carbonyl cyanide m-chlorophenylhydrazone) for 9 h. Mitochondria were then stained using MitoTracker Red CMXRos and observed under a confocal microscope with a live cell imaging chamber. Scale bars: 10 μm. B. Average mitochondrial length was determined for 30 cells in each experiment; 3 independent experiments are included. Data are presented as mean ± SD (*P<0.01 vs. the control; ##P< 0.01 vs. the control). C. MDA-MB-231 cells were cotransfected with RFP-mito and GFP-LC3 and treated with 8 μM PPI or 20 μM CCCP for 9 h. After immunostaining with LAMP1 (Alexa Fluor 647, blue), cells were examined by confocal microscopy. Scale bars: 10 μm. D. The percentage of cells in which mitophagy occurred was determined using 30 cells from each experiment; 3 independent experiments are included. Cells with more than five RFP-Mito, LC3, and LAMP1 colocalization puncta were designated mitophagy-positive. Data are presented as mean ± SD (*P< 0.01 vs. the control). E. MDA-MB-231 cells were treated with 8 μM PPI for 9 h and imaged using a transmission electron microscope. Scale bars: 2 μm. Mitochondria and mitophagosomes were marked by white arrows. F-G. MDA-MB-231 cells were treated with 8 μM PPI for different periods of time as indicated or with 20 μM CCCP for 9 h. Mitochondrial fractions and whole-cell lysates were then prepared and subjected to western blot analysis.
Figure 3. Polyphyllin I triggers PINK1/PARK2-dependent mitophagy
A. MDA-MB-231 cells were treated with 8 μM PPI for different periods of time as indicated, and PARK2, P62, and ubiquitin (UB) levels in mitochondrial fractions were determined by western blot. B. Cells were cotransfected with GFP-UB and RFP-mito and treated with 8 μM PPI for 9 h, after which PARK2 (Alexa Fluor 405, pink) and P62 (Alexa Fluor 647, blue) immunostaining was detected using confocal microscopy. C. Cells cotransfected with GFP-UB and RFP-LC3 were treated with 8 μM PPI for 9 h, after which PARK2 (Alexa Fluor 405, pink) and TOMM20 (Alexa Fluor 647, blue) immunostaining was detected using confocal microscopy. Scale bars: 10 μm. D-E. MDA-MB-231 cells were treated with 8 μM PPI for different periods of time as indicated; whole-cell lysates were then separated on 8% SDS-PAGE gels and analyzed by western blot using the anti-PINK1 antibody. Relative full-length (∼63 kDa) and cleaved (∼52 kDa) PINK1 levels were quantified by densitometry and normalized to Tubulin. The results were expressed as a percentage of control, which was set at 100%. Data are presented as mean ± SD (*P< 0.01 vs. the control). F. Cells were treated with 8 μM PPI for different periods of time as indicated, and whole-cell lysates were then subjected to western blot analysis. G. Cells were treated with 8 μM PPI for 9 h, after which mitochondrial fractions were prepared and subjected to immunoprecipitation using anti-PINK1 antibody; associated PARK2 was detected using immunoblotting. H. RFP-mito-expressing MDA-MB-231 cells were treated with 8 μM PPI for 9 h, and PINK1 (Alexa Fluor 488, green) and PARK2 (Alexa Fluor 405, pink) immunostaining were evaluated using confocal microscopy. Scale bars: 10 μm.
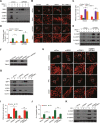
Figure 4. PINK1 knockdown combined with polyphyllin I treatment blocks mitophagy and increases mitochondrial fission and apoptosis
A. MDA-MB-231 cells stably expressing non-target shRNA (shCon) or PINK1 shRNA (shPINK1) were lysed and analyzed by western blot. B-C. shCon and shPINK1 cells were treated with or without 8 μM PPI for 6 h; whole-cell lysates and mitochondrial fractions were then prepared and subjected to western blot analysis. D-E. shCon and shPINK1 cells were cotransfected with RFP-mito and GFP-LC3, and then treated with 8 μM PPI for 6 h. LAMP1 (Alexa Fluor 647, blue) immunostaining was then detected using confocal microscopy. Scale bars: 10 μm. The percentage of cells in which mitophagy occurred was determined using 30 cells from each experiment; 3 independent experiments are included. The cells with more than five RFP-Mito, LC3, and LAMP1 colocalization puncta were designated mitophagy-positive. Data are presented as mean ± SD (*P< 0.01 compared to shCon cells treated with PPI). F-G. shCon and shPINK1 cells were transfected with RFP-mito, and then treated with 8 μM PPI for 6 h. Mitochondria were observed using confocal microscopy. Scale bars: 10 μm. The average mitochondrial length was quantified as previously described. Data are presented as mean ± SD (*P< 0.01 compared to shCon cells treated with PPI). H. shCon and shPINK1 cells were treated with 8 μM PPI for 6 h, and DRP1 levels in mitochondrial fractions were determined by immunoblotting. I. Cells were treated with or without 8 μM PPI for 6 h, and apoptosis was then measured by flow cytometry. Data are presented as mean ± SD (*P< 0.01 compared to shCon cells treatment with PPI). J-K. Whole-cell lysates, mitochondrial (Mito), and cytosolic (Cyto) fractions were prepared and subjected to western blot analysis.
Figure 5. Suppression of DRP1 by mdivi-1 or shRNA blocks PINK1 depletion- and polyphyllin I-induced alterations in mitochondrial fission, mitophagy and apoptosis
A. shCon and shPINK1 cells were pretreated with Mdivi-1 (50 μM) for 2 h, followed by treatment with 8 μM PPI for 6 h. Mitochondrial fractions (Mito) were prepared and subjected to western blot analysis. B-C. RFP-mito-expressing cells were treated as indicated in (A), and fluorescence images were evaluated by confocal microscopy. Scale bars: 10 μm. Average mitochondrial length was quantified as previously described. Data are presented as mean ± SD (*P< 0.01 compared to shCon cells treated with PPI, ##P< 0.01 compared to shPINK1 cells treated with PPI). D-E. Cells were treated as indicated in (A); apoptosis was then measured by flow cytometry, and whole-cell lysates were prepared and subjected to western blot analysis. Data are presented as mean ± SD (*P< 0.01 compared to shCon cells treated with PPI, ##P< 0.01 compared to shPINK1 cells treated with PPI). F. MDA-MB-231 cells were infected with shCon or shPINK1 and/or shDRP1 lentivirus; after selection with puromycin, cells were lysed and analyzed by western blot using the anti-DRP1 antibody. G. Cells were treated with 8 μM PPI for 6 h, and mitochondrial fractions were then prepared and subjected to western blot analysis. H-I. Cells were transfected with RFP-mito and then treated with 8 μM PPI for 6 h. Mitochondria were examined using confocal microscopy. Scale bars: 10 μm. Average mitochondrial length was quantified as previously described. Data are presented as mean ± SD (*P< 0.01 compared to shCon cells treated with PPI, ##P< 0.01 compared to shPINK1 cells treated with PPI). J-K. Apoptosis was measured by flow cytometry, and whole-cell lysates were prepared and subjected to western blot analysis. Data are presented as mean ± SD (*P< 0.01 compared to shCon cells treated with PPI, ##P< 0.01 compared to shPINK1 cells treated with PPI).
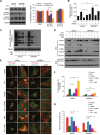
Figure 6. PINK1 depletion suppresses mitophagy and promotes mitochondrial fragmentation by dephosphorylating DRP1 at Ser637
A. shCon and shPINK1 cells were exposed to PPI (8 μM) for 6 h, after which whole-cell lysates were prepared and subjected to western blot analysis. Relative protein levels from 3 independent experiments were quantified by densitometry and normalized to Tubulin; the results are expressed as percentage of control level, which was set at 100%. Data are presented as mean ± SD (*P< 0.01 compared to shCon cells, ##P< 0.01 compared to shCon cells treated with PPI). B. Cells were pretreated with the calcineurin inhibitor FK506 (1 μM) for 2 h, followed by treatment with 8 μM PPI for 6 h; calcineurin activity was then measured as described in the Methods. Data are presented as mean ± SD (*P< 0.01 compared to shCon cells treated with PPI, ##P< 0.01 compared to shPINK1 cells treated with PPI). C. Cells were pretreated with the PKA inhibitor H89 (50 μM) for 2 h, followed by treatment with PPI (8 μM) for 6 h; whole-cell lysates were then prepared and subjected to western blot using the anti-phospho-PKA substrate (RRXS/T) antibody. D. Cells were pretreated with FK506 (1 μM) or H89 (50 μM) for 2 h and then exposed to PPI (8 μM) for 6 h, after which whole-cell lysates (WCL) and mitochondrial fractions (Mito) were prepared and subjected to western blot analysis. E-G. Cells were cotransfected with RFP-Mito and GFP-LC3 and treated as described in (D); fluorescence images were then evaluated using confocal microscopy. Scale bars: 10 μm. Percentages of mitophagy-positive cells and average mitochondrial length were measured as previously described. Data are presented as mean ± SD (*P< 0.01 compared to shCon cells treated with PPI, ##P< 0.05 or ##P< 0.01 compared to shPINK1 cells treated with PPI).
Figure 7. Polyphyllin I suppressed, and PINK1 knockdown further suppressed, tumor growth in a MDA-MB-231 xenograft model
A. Tumor volumes were measured every week and differed at the end of the treatment period (*P < 0.01 compared to shCon cells treated with PPI, ##P< 0.01 compared to shPINK1 cells treated with PPI). B. Representative image of tumors from each group. C. Body weight changes in mice during the 6 weeks of PPI treatment. There were no differences in body weights between the PPI-treated shCon and vehicle-treated shCon groups or between the PPI-treated shPINK1 group and shCon groups. D. Representative tumor tissues were sectioned and subjected to H&E staining, TUNEL assay, and immunohistochemistry staining for C-CASP3. Scale bars: 50 μm. E. Representative tumor tissues from each group were prepared and subjected to western blot using anti-DRP1, -PARK2, -LC3B, -PINK1, and -C-CASP3 antibodies.
Figure 8. A proposed model for polyphyllin I-induced mitophagic and apoptotic cell death in human breast cancer cells
Polyphyllin I induced mitochondrial translocation of DRP1 by dephosphorylating DRP1 at Ser637, which lead to mitochondrial fission and cytochrome c release from the mitochondria into the cytosol, in turn activating caspases and promoting apoptosis. Meanwhile, polyphyllin I also increased stabilization of full-length PINK1 at the mitochondrial surface, leading to recruitment of PARK2, P62, ubiquitin, and LC3B-II to the mitochondria and culminating in mitophagy. Moreover, PINK1 knockdown markedly suppressed mitophagy and enhanced polyphyllin I-induced, DRP1-dependent mitochondrial fission and apoptosis.
Similar articles
- Dynamin-related protein 1-mediated mitochondrial fission contributes to IR-783-induced apoptosis in human breast cancer cells.
Tang Q, Liu W, Zhang Q, Huang J, Hu C, Liu Y, Wang Q, Zhou M, Lai W, Sheng F, Li G, Zhang R. Tang Q, et al. J Cell Mol Med. 2018 Sep;22(9):4474-4485. doi: 10.1111/jcmm.13749. Epub 2018 Jul 11. J Cell Mol Med. 2018. PMID: 29993201 Free PMC article. - PGAM5 regulates PINK1/Parkin-mediated mitophagy via DRP1 in CCCP-induced mitochondrial dysfunction.
Park YS, Choi SE, Koh HC. Park YS, et al. Toxicol Lett. 2018 Mar 1;284:120-128. doi: 10.1016/j.toxlet.2017.12.004. Epub 2017 Dec 11. Toxicol Lett. 2018. PMID: 29241732 - Silibinin-induced mitochondria fission leads to mitophagy, which attenuates silibinin-induced apoptosis in MCF-7 and MDA-MB-231 cells.
Si L, Fu J, Liu W, Hayashi T, Mizuno K, Hattori S, Fujisaki H, Onodera S, Ikejima T. Si L, et al. Arch Biochem Biophys. 2020 May 30;685:108284. doi: 10.1016/j.abb.2020.108284. Epub 2020 Jan 31. Arch Biochem Biophys. 2020. PMID: 32014401 - Mitochondrial quality control pathways: PINK1 acts as a gatekeeper.
Leites EP, Morais VA. Leites EP, et al. Biochem Biophys Res Commun. 2018 May 27;500(1):45-50. doi: 10.1016/j.bbrc.2017.06.096. Epub 2017 Jun 21. Biochem Biophys Res Commun. 2018. PMID: 28647367 Review. - The three 'P's of mitophagy: PARKIN, PINK1, and post-translational modifications.
Durcan TM, Fon EA. Durcan TM, et al. Genes Dev. 2015 May 15;29(10):989-99. doi: 10.1101/gad.262758.115. Genes Dev. 2015. PMID: 25995186 Free PMC article. Review.
Cited by
- Targeting PINK1 Using Natural Products for the Treatment of Human Diseases.
Li YQ, Zhang F, Yu LP, Mu JK, Yang YQ, Yu J, Yang XX. Li YQ, et al. Biomed Res Int. 2021 Oct 30;2021:4045819. doi: 10.1155/2021/4045819. eCollection 2021. Biomed Res Int. 2021. PMID: 34751247 Free PMC article. Review. - NFIB promotes the migration and progression of kidney renal clear cell carcinoma by regulating PINK1 transcription.
Wang N, Yuan J, Liu F, Wei J, Liu Y, Xue M, Dong R. Wang N, et al. PeerJ. 2021 Apr 23;9:e10848. doi: 10.7717/peerj.10848. eCollection 2021. PeerJ. 2021. PMID: 33981484 Free PMC article. - The Links between Parkinson's Disease and Cancer.
Ejma M, Madetko N, Brzecka A, Guranski K, Alster P, Misiuk-Hojło M, Somasundaram SG, Kirkland CE, Aliev G. Ejma M, et al. Biomedicines. 2020 Oct 14;8(10):416. doi: 10.3390/biomedicines8100416. Biomedicines. 2020. PMID: 33066407 Free PMC article. Review. - Dynamin-related protein 1-mediated mitochondrial fission contributes to IR-783-induced apoptosis in human breast cancer cells.
Tang Q, Liu W, Zhang Q, Huang J, Hu C, Liu Y, Wang Q, Zhou M, Lai W, Sheng F, Li G, Zhang R. Tang Q, et al. J Cell Mol Med. 2018 Sep;22(9):4474-4485. doi: 10.1111/jcmm.13749. Epub 2018 Jul 11. J Cell Mol Med. 2018. PMID: 29993201 Free PMC article. - Polyphyllin I Ameliorates Collagen-Induced Arthritis by Suppressing the Inflammation Response in Macrophages Through the NF-κB Pathway.
Wang Q, Zhou X, Zhao Y, Xiao J, Lu Y, Shi Q, Wang Y, Wang H, Liang Q. Wang Q, et al. Front Immunol. 2018 Sep 27;9:2091. doi: 10.3389/fimmu.2018.02091. eCollection 2018. Front Immunol. 2018. PMID: 30319603 Free PMC article.
References
- Venditti P, Di Stefano L, Di Meo S. Mitochondrial metabolism of reactive oxygen species. Mitochondrion. 2013;13:71–82. - PubMed
- Tait SW, Green DR. Mitochondria and cell death: outer membrane permeabilization and beyond. Nat Rev Mol Cell Biol. 2010;11:621–632. - PubMed
MeSH terms
Substances
LinkOut - more resources
Full Text Sources
Other Literature Sources
Medical
Research Materials
Miscellaneous


