Bcl-xL Affects Group A Streptococcus-Induced Autophagy Directly, by Inhibiting Fusion between Autophagosomes and Lysosomes, and Indirectly, by Inhibiting Bacterial Internalization via Interaction with Beclin 1-UVRAG - PubMed (original) (raw)
Bcl-xL Affects Group A Streptococcus-Induced Autophagy Directly, by Inhibiting Fusion between Autophagosomes and Lysosomes, and Indirectly, by Inhibiting Bacterial Internalization via Interaction with Beclin 1-UVRAG
Shintaro Nakajima et al. PLoS One. 2017.
Abstract
Anti-apoptotic Bcl-2 and Bcl-xL are proposed to regulate starvation-induced autophagy by directly interacting with Beclin 1. Beclin 1 is also thought to be involved in multiple vesicle trafficking pathways such as endocytosis by binding to Atg14L and UVRAG. However, how the interaction of Bcl-2 family proteins and Beclin 1 regulates anti-bacterial autophagy (xenophagy) is still unclear. In this study, we analyzed these interactions using Group A Streptococcus (GAS; Streptococcus pyogenes) infection as a model. GAS is internalized into epithelial cells through endocytosis, while the intracellular fate of GAS is degradation by autophagy. Here, we found that Bcl-xL but not Bcl-2 regulates GAS-induced autophagy. Autophagosome-lysosome fusion and the internalization process during GAS infection were promoted in Bcl-xL knockout cells. In addition, knockout of Beclin 1 phenocopied the internalization defect of GAS. Furthermore, UVRAG interacts not only with Beclin 1 but also with Bcl-xL, and overexpression of UVRAG partially rescued the internalization defect of Beclin 1 knockout cells during GAS infection. Thus, our results indicate that Bcl-xL inhibits GAS-induced autophagy directly by suppressing autophagosome-lysosome fusion and indirectly by suppressing GAS internalization via interaction with Beclin 1-UVRAG.
Conflict of interest statement
The authors have declared that no competing interests exist.
Figures
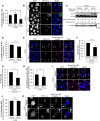
Fig 1. Bcl-xL suppresses GAS internalization.
(A) The number of cells containing GcAV were counted and presented as the percentage of the total number of GAS-infected cells. HeLa cells stably expressing GFP-LC3 were transfected with FLAG-control, -Bcl-2, or -Bcl-xL and infected with GAS (MOI = 100) for 4 h. Cellular and bacterial DNA was stained with DAPI. The data shown represents result from >200 infected cells in terms of the mean value ± SD from three independent experiments. * P < 0.05. (B) Confocal microscopic images of GcAV in cells expressing either FLAG-control, -Bcl-2, or–Bcl-xL. Insets show expansion of the boxed areas. Scale bars, 10 μm. (C) The accumulation of LC3-II during GAS infection. HeLa cells were transfected with FLAG-control, -Bcl-2, or -Bcl-xL and infected with GAS (MOI = 100) for 4 h. Expression of LC3 was analyzed by western blotting using anti-LC3 antibody. (D) Co-localization efficiencies of GcAV and lysosomes were calculated as the percentage of the total number of GcAV. HeLa cells stably expressing GFP-LC3 were transfected with FLAG-control, or -Bcl-xL and infected with GAS (MOI = 100) for 4 h. Cells were then immunostained with an anti-LAMP1 antibody. Cellular and bacterial DNA was stained with DAPI. The data shown represent results of >50 GcAVs and each percentage represents the mean value ±SD from three independent experiments. (E) Confocal microscopic images of GcAV associated with lysosomes. White arrows show autophagosomes, white arrow heads show autolysosomes. Scale bars, 10 μm. (F) Intracellular survival rate of GAS. HeLa cells were transfected with FLAG-control, or -Bcl-xL, and infected with GAS (MOI = 100). After 1 h of infection, cells were washed with PBS and further incubated for 1 h with DMEM/10% FCS with gentamicin (100 μg/ml) to kill the extracellular bacteria. Cells were disrupted with distilled water and serial dilutions of cellular extracts were plated on THY agar plates, and colony counting was performed. The data presents the survival rate as the ratio of “intracellular live GAS at 4 h post-infection” to “total intracellular GAS at 2 h post-infection”. Data are representative of ≥ three independent experiments. (G) Invasion rate of GAS. HeLa Cells were transfected and infected as in (F). The data presents the invasion rate as the ratio of “total intracellular GAS at 2 h post-infection” to “total adherent GAS at 1 h post-infection”. Data are representative of ≥ three independent experiments. * P < 0.05. (H) The number of cells containing Galectin-3-positive GAS were counted and presented as the percentage of the total number of GAS-infected cells. HeLa cells stably expressing GFP-LC3 were transfected with either FLAG-control, -Bcl-2, or–Bcl-xL and infected with GAS (MOI = 100) for 4 h. Cells were then immunostained with an anti-Galectin-3 antibody. Cellular and bacterial DNA was stained with DAPI. The data shown represent results from >200 infected cells in terms of the mean value ± SD from three independent experiments. * P < 0.05. (I) Confocal microscopic images of Galectin-3-positive GAS. White arrow heads show Galectin-3-positive GAS. Scale bars, 10 μm. (J) Co-localization efficiencies of Galectin-3-positive GAS and GcAV were calculated as the percentage of the total number of Galectin-3-positive GAS. HeLa cells stably expressing GFP-LC3 were transfected with either FLAG-control, -Bcl-2, or–Bcl-xL, and infected with GAS (MOI = 100) for 4 h. Cells were then immunostained with an anti-Galectin-3 antibody. Cellular and bacterial DNA was stained with DAPI. The data shown represent results of >50 Galectin-3-positive GAS and each percentage represents the mean value ± SD from three independent experiments. * P < 0.05. (K) Confocal microscopic images of LC3-positive GAS in Galectin-3-positive GAS. Insets show expansion of the boxed areas. Scale bars, 10 μm.
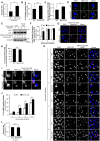
Fig 2. Endogenous Bcl-xL regulates GAS internalization and autophagosome-lysosome fusion during GAS infection.
(A) Invasion rate of GAS in Bcl-xL KO cells. Both wild-type and Bcl-xL KO cells were infected with GAS (MOI = 100). At 0.5 h post-infection, cells were disrupted with distilled water and serial dilutions of cellular extracts were plated on THY agar plates, and colony counting was performed. The data presents the invasion rate as the ratio of “total intracellular GAS at 2 h post-infection” to “total adherent GAS at 0.5 h post-infection”. Data are representative of ≥ three independent experiments. * P < 0.05. (B) The number of cells containing GcAV were counted and presented as the percentage of the total number of GAS-infected cells. Wild-type and Bcl-xL KO cells stably expressing GFP-LC3 were infected with GAS (MOI = 100) for 4 h. Cellular and bacterial DNA was stained with DAPI. The data shown represent results from >200 infected cells in terms of the mean value ± SD from three independent experiments. ** P < 0.01. (C) Quantification of the number of GcAV per GcAV-positive cell. Wild-type and Bcl-xL KO cells stably expressing GFP-LC3 were infected and treated as in (B). The data shown represent results from >50 GcAV-positive cells in terms of the mean value ± SD from three independent experiments. * P < 0.05. (D) Confocal microscopic images of GcAV in Bcl-xL KO cells. White arrowheads show GcAV. Scale bars, 10 μm. (E) The accumulation of LC3-II during GAS infection. Wild-type and Bcl-xL KO cells were cultured and infected with GAS (MOI = 100) for 4 h. Expression of LC3 was analyzed by western blotting using anti-LC3 antibody. (F) The number of cells containing Galectin-3-positive GAS were counted and presented as the percentage of the total number of GAS-infected cells. Wild-type and Bcl-xL KO cells stably expressing GFP-LC3 were infected with GAS (MOI = 100) for indicated times. Cells were then immunostained with an anti-Galectin-3 antibody. Cellular and bacterial DNA was stained with DAPI. The data shown represent results from >200 infected cells in terms of the mean value ± SD from three independent experiments. * P < 0.05. (G) Confocal microscopic images of Galectin-3-positive GAS at 1 h post-infection. White arrow heads show Galectin-3-positive GAS. Scale bars, 10 μm. (H) Co-localization efficiencies of Galectin-3-positive GAS and GcAV were calculated as the percentage of total number of Galectin-3-positive GAS. Wild-type and Bcl-xL KO cells stably expressing GFP-LC3 were infected with GAS (MOI = 100) for 4 h. Cells were then immunostained with an anti-Galectin-3 antibody. Cellular and bacterial DNA was stained with DAPI. The data shown represent results of >50 Galectin-3-positive GAS and each percentage represents the mean value ± SD from three independent experiments. (I) Confocal microscopic images of LC3-positive GAS in Galectin-3-positive GAS in Bcl-xL KO cells. Insets show expansion of the boxed areas. Scale bars, 10 μm. (J) Co-localization efficiencies of GcAV and lysosomes in Bcl-xL KO cells. Wild-type and Bcl-xL KO cells stably expressing GFP-LC3 were infected with GAS (MOI = 100) for indicated times. Cells were then immunostained with an anti-LAMP1 antibody. Cellular and bacterial DNA was stained with DAPI. Co-localization efficiencies of GcAV and LAMP1 were calculated as the percentage of total number of GcAV. The data shown represent results of >50 GcAVs and each percentage represents the mean value ± SD from three independent experiments. * P < 0.05. (K) Confocal microscopic images of GcAV associated with lysosomes in Bcl-xL KO cells. White arrows show autophagosomes, white arrow heads show autolysosomes. Scale bars, 10 μm. (L) Intracellular survival rate of GAS in Bcl-xL KO cells. Both wild-type and Bcl-xL KO cells were infected and treated as in (A). The data presents the survival rate as the ratio of “intracellular live GAS at 4 h post-infection” to “total intracellular GAS at 2 h post-infection”. Data are representative of ≥three independent experiments.
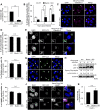
Fig 3. Knockout of Beclin 1 inhibits GAS internalization.
(A) Invasion rate of GAS in Beclin 1 KO cells. Both wild-type and Beclin 1 KO cells were infected with GAS (MOI = 100). At 1 h post-infection, cells were disrupted with distilled water and serial dilutions of cellular extracts were plated on THY agar plates, and colony counting was performed. The data presents the invasion rate as the ratio of “total intracellular GAS at 2 h post-infection” to “total adherent GAS at 1 h post-infection”. Data are representative of ≥ three independent experiments. ** P < 0.01. (B) The number of cells containing Galectin-3-positive GAS were counted and presented as the percentage of the total number of GAS-infected cells. Wild-type and Beclin 1 KO cells stably expressing GFP-LC3 were infected with GAS (MOI = 100) for the indicated times. Cells were then immunostained with an anti-Galectin-3 antibody. Cellular and bacterial DNA was stained with DAPI. The data shown represent results from >200 infected cells in terms of the mean value ± SD from three independent experiments. * P < 0.05, ** _P_ < 0.01. (C) Confocal microscopic images of Galectin-3-positive GAS at 4 h after infection. White arrow heads show Galectin-3-positive GAS. Scale bars, 10 μm. (D) Co-localization efficiencies of Galectin-3-positive GAS and GcAV were calculated as the percentage of total number of Galectin-3-positive GAS. Wild-type and Beclin 1 KO cells stably expressing GFP-LC3 were infected with GAS (MOI = 100) for 4 h. Cells were then immunostained with an anti-Galectin-3 antibody. Cellular and bacterial DNA was stained with DAPI. The data shown represent results of >50 Galectin-3-positive GAS and each percentage represents the mean value ± SD from three independent experiments. (E) Confocal microscopic images of LC3-positive GAS in Galectin-3-positive GAS in Beclin 1 KO cells. Insets show expansion of the boxed areas. Scale bars, 10 μm. (F) The number of cells containing GcAV were counted and presented as the percentage of the total number of GAS-infected cells. Wild-type and Beclin 1 KO cells stably expressing GFP-LC3 were infected with GAS (MOI = 100) for 4 h. Cellular and bacterial DNA was stained with DAPI. The data shown represent results from >200 infected cells in terms of the mean value ± SD from three independent experiments. (G) Confocal microscopic images of GcAV in Beclin 1 KO cells. White arrowheads show GcAVs. Scale bars, 10 μm. (H) The accumulation of LC3-II in Beclin 1 KO cells. Wild-type and Beclin 1 KO cells were infected with GAS (MOI = 100) for 4 h. Expression of LC3 was analyzed by western blotting using anti-LC3 antibody. (I) Co-localization efficiencies of GcAV and lysosomes in Beclin 1 KO cells. Wild-type and Beclin 1 KO cells stably expressing GFP-LC3 were infected with GAS (MOI = 100) for 4 h. Cells were then immunostained with an anti-LAMP1 antibody. Cellular and bacterial DNA was stained with DAPI. Co-localization efficiencies of GcAV and LAMP1 were calculated as the percentage of total number of GcAV. The data shown represent results of >50 GcAVs and each percentage represents the mean value ± SD from three independent experiments. (J) Confocal microscopic images of GcAV associated with lysosomes in Beclin 1 KO cells. Insets show expansion of the boxed areas. Scale bars, 10 μm. (K) Survival rate of GAS in Beclin 1 KO cells. Both wild-type and Beclin 1 KO cells were infected and treated as in (A). The data presents the survival rate as the ratio of “intracellular live GAS at 4 h post-infection” to “total intracellular GAS at 2 h post-infection”. Data are representative of ≥ three independent experiments.
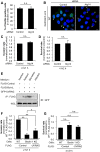
Fig 4. UVRAG but not Atg14 regulates GAS internalization.
(A) The number of cells containing GcAV were counted and presented as the percentage of the total number of GAS-infected cells. HeLa cells stably expressing GFP-LC3 were transfected with a control siRNA or Atg14 siRNA and infected with GAS (MOI = 100) for 4 h. Cellular and bacterial DNA was stained with DAPI. The data shown represent results from >200 infected cells in terms of the mean value ± SD from three independent experiments. (B) Confocal microscopic images of GcAV in Atg14L knockdown cells. White arrowheads show GcAVs. Scale bars, 10 μm. (C) Invasion rate of GAS in Atg14L knockdown cells. HeLa cells were transfected with a control siRNA or Atg14 siRNA and infected with GAS (MOI = 100). At 1 h post-infection, cells were disrupted with distilled water and serial dilutions of cellular extracts were plated on THY agar plates, and colony counting was performed. The data presents the invasion rate as the ratio of “total intracellular GAS at 2 h post-infection” to “total adherent GAS at 1 h post-infection”. Data are representative of ≥ three independent experiments. (D) Intracellular survival rate of GAS in Atg14L knockdown cells. HeLa cells were transfected and infected as in (C). The data presents the survival rate as the ratio of “intracellular live GAS at 4 h post-infection” to “total intracellular GAS at 2 h post-infection”. Data are representative of ≥ three independent experiments. (E) UVRAG interacts with Bcl-xL. HEK293T cells transfected with FLAG-control or -Bcl-xL and EmGFP-UVRAG and cultured under nutrient-rich and starvation conditions for 2 h, or were infected with GAS for 4 h, and then subjected to immunoprecipitations with an anti-FLAG antibody. The immunoprecipitated proteins and total cell lysates were analyzed by immunoblotting with anti-GFP antibody. (F) Invasion rate of GAS in UVRAG-overexpressing Beclin 1 KO cells. Wild-type HeLa cells transfected with FLAG-control and Beclin 1 KO cells transfected with FLAG-control or FLAG-UVRAG were infected with GAS (MOI = 100). At 1 h post-infection, cells were disrupted with distilled water and serial dilutions of cellular extracts were plated on THY agar plates, and colony counting was performed. The data presents the invasion rate as the ratio of “total intracellular GAS at 2 h post-infection” to “total adherent GAS at 1 h post-infection”. Data are representative of ≥ three independent experiments. * P < 0.05. ** P < 0.01. (G) Intracellular survival rate of GAS in UVRAG-overexpressing Beclin 1 KO cells. Wild-type HeLa cells and Beclin 1 KO cells were transfected and infected as in (F). The data presents the survival rate as the ratio of “intracellular live GAS at 4 h post-infection” to “total intracellular GAS at 2 h post-infection”. Data are representative of ≥ three independent experiments.
Similar articles
- NLRX1 Negatively Regulates Group A Streptococcus Invasion and Autophagy Induction by Interacting With the Beclin 1-UVRAG Complex.
Aikawa C, Nakajima S, Karimine M, Nozawa T, Minowa-Nozawa A, Toh H, Yamada S, Nakagawa I. Aikawa C, et al. Front Cell Infect Microbiol. 2018 Nov 14;8:403. doi: 10.3389/fcimb.2018.00403. eCollection 2018. Front Cell Infect Microbiol. 2018. PMID: 30488027 Free PMC article. - Targeting the potent Beclin 1-UVRAG coiled-coil interaction with designed peptides enhances autophagy and endolysosomal trafficking.
Wu S, He Y, Qiu X, Yang W, Liu W, Li X, Li Y, Shen HM, Wang R, Yue Z, Zhao Y. Wu S, et al. Proc Natl Acad Sci U S A. 2018 Jun 19;115(25):E5669-E5678. doi: 10.1073/pnas.1721173115. Epub 2018 Jun 4. Proc Natl Acad Sci U S A. 2018. PMID: 29866835 Free PMC article. - Impaired autophagy and APP processing in Alzheimer's disease: The potential role of Beclin 1 interactome.
Salminen A, Kaarniranta K, Kauppinen A, Ojala J, Haapasalo A, Soininen H, Hiltunen M. Salminen A, et al. Prog Neurobiol. 2013 Jul-Aug;106-107:33-54. doi: 10.1016/j.pneurobio.2013.06.002. Epub 2013 Jul 1. Prog Neurobiol. 2013. PMID: 23827971 Review. - Apoptosis blocks Beclin 1-dependent autophagosome synthesis: an effect rescued by Bcl-xL.
Luo S, Rubinsztein DC. Luo S, et al. Cell Death Differ. 2010 Feb;17(2):268-77. doi: 10.1038/cdd.2009.121. Epub 2009 Aug 28. Cell Death Differ. 2010. PMID: 19713971 Free PMC article. - Bcl-2 and Bcl-xL play important roles in the crosstalk between autophagy and apoptosis.
Zhou F, Yang Y, Xing D. Zhou F, et al. FEBS J. 2011 Feb;278(3):403-13. doi: 10.1111/j.1742-4658.2010.07965.x. Epub 2010 Dec 23. FEBS J. 2011. PMID: 21182587 Review.
Cited by
- The role of NEDD4 related HECT-type E3 ubiquitin ligases in defective autophagy in cancer cells: molecular mechanisms and therapeutic perspectives.
Zhang R, Shi S. Zhang R, et al. Mol Med. 2023 Mar 14;29(1):34. doi: 10.1186/s10020-023-00628-3. Mol Med. 2023. PMID: 36918822 Free PMC article. Review. - Ubiquitination of UVRAG by SMURF1 promotes autophagosome maturation and inhibits hepatocellular carcinoma growth.
Feng X, Jia Y, Zhang Y, Ma F, Zhu Y, Hong X, Zhou Q, He R, Zhang H, Jin J, Piao D, Huang H, Li Q, Qiu X, Zhang Z. Feng X, et al. Autophagy. 2019 Jul;15(7):1130-1149. doi: 10.1080/15548627.2019.1570063. Epub 2019 Jan 27. Autophagy. 2019. PMID: 30686098 Free PMC article. - ATG9B regulates bacterial internalization via actin rearrangement.
Iibushi J, Nozawa T, Toh H, Nakagawa I. Iibushi J, et al. iScience. 2024 Apr 10;27(5):109623. doi: 10.1016/j.isci.2024.109623. eCollection 2024 May 17. iScience. 2024. PMID: 38706859 Free PMC article. - Autophagy as a Target for Drug Development Of Skin Infection Caused by Mycobacteria.
Bittencourt TL, da Silva Prata RB, de Andrade Silva BJ, de Mattos Barbosa MG, Dalcolmo MP, Pinheiro RO. Bittencourt TL, et al. Front Immunol. 2021 May 25;12:674241. doi: 10.3389/fimmu.2021.674241. eCollection 2021. Front Immunol. 2021. PMID: 34113346 Free PMC article. Review. - Interplay between group A Streptococcus and host innate immune responses.
Su MS-W, Cheng Y-L, Lin Y-S, Wu J-J. Su MS-W, et al. Microbiol Mol Biol Rev. 2024 Mar 27;88(1):e0005222. doi: 10.1128/mmbr.00052-22. Epub 2024 Mar 7. Microbiol Mol Biol Rev. 2024. PMID: 38451081 Review.
References
- Nakagawa I, Nakata M, Kawabata S, Hamada S. Cytochrome c-mediated caspase-9 activation triggers apoptosis in Streptococcus pyogenes-infected epithelial cells. Cellular Microbiology. 2001;3:395–405. - PubMed
- Nakagawa I, Amano A, Mizushima N, Yamamoto A, Yamaguchi H, Kamimoto T, et al. Autophagy defends cells against invading group A Streptococcus. Science (New York, NY). 2004;306(5698):1037–40. Epub 2004/11/06. - PubMed
MeSH terms
Substances
Grants and funding
LinkOut - more resources
Full Text Sources
Other Literature Sources
Research Materials


