Inhibition of Stat3 signaling ameliorates atrophy of the soleus muscles in mice lacking the vitamin D receptor - PubMed (original) (raw)
Inhibition of Stat3 signaling ameliorates atrophy of the soleus muscles in mice lacking the vitamin D receptor
Suchitra D Gopinath. Skelet Muscle. 2017.
Abstract
Background: Although skeletal muscle wasting has long been observed as a clinical outcome of impaired vitamin D signaling, precise molecular mechanisms that mediate the loss of muscle mass in the absence of vitamin D signaling are less clear. To determine the molecular consequences of vitamin D signaling, we analyzed the role of signal transducer and activator of transcription 3 (Stat3) signaling, a known contributor to various muscle wasting pathologies, in skeletal muscles.
Methods: We isolated soleus (slow) and tibialis anterior (fast) muscles from mice lacking the vitamin D receptor (VDR-/-) and used western blot analysis, quantitative RTPCR, and pharmacological intervention to analyze muscle atrophy in VDR-/- mice.
Results: We found that slow and fast subsets of muscles of the VDR-/- mice displayed elevated levels of phosphorylated Stat3 accompanied by an increase in Myostatin expression and signaling. Consequently, we observed reduced activity of mammalian target of rapamycin (mTOR) signaling components, ribosomal S6 kinase (p70S6K) and ribosomal S6 protein (rpS6), that regulate protein synthesis and cell size, respectively. Concomitantly, we observed an increase in atrophy regulators and a block in autophagic gene expression. An examination of the upstream regulation of Stat3 levels in VDR-/- muscles revealed an increase in IL-6 protein expression in the soleus, but not in the tibialis anterior muscles. To investigate the involvement of satellite cells (SCs) in atrophy in VDR-/- mice, we found that there was no significant deficit in SC numbers in VDR-/- muscles compared to the wild type. Unlike its expression within VDR-/- fibers, Myostatin levels in VDR-/- SCs from bulk muscles were similar to those of wild type. However, VDR-/- SCs induced to differentiate in culture displayed increased p-Stat3 signaling and Myostatin expression. Finally, VDR-/- mice injected with a Stat3 inhibitor displayed reduced Myostatin expression and function and restored active p70S6K and rpS6 levels, resulting in an amelioration of loss of muscle mass in the soleus muscles.
Conclusions: The loss of muscle mass in slow muscles in the absence of vitamin D signaling is due to elevated levels of phosphorylated Stat3 that leads to an increase in Myostatin signaling, which in turn decreases protein synthesis and fiber size through the phosphorylation of p70S6K and rpS6, respectively.
Keywords: Atrophy; Myostatin; Satellite cells; Skeletal muscle; Soleus; Tibialis anterior; p-70S6K; p-Stat3; p-rpS6.
Figures
Fig. 1
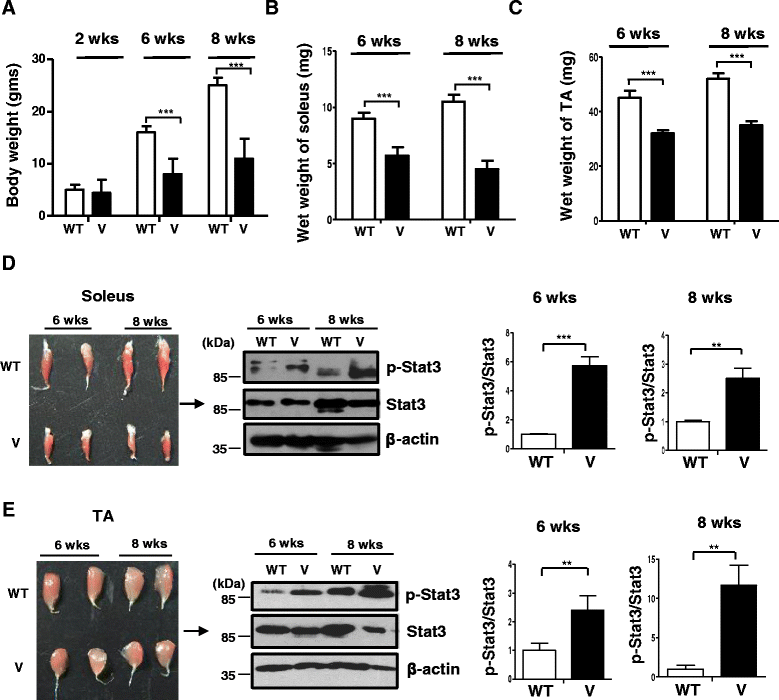
Reduced weight and elevated p-Stat3 levels displayed by VDR−/− muscles. Graph shows average weights of the whole body of wild-type (W) and VDR−/− mice (V) at 2, 6, and 8 weeks of age (a) of the soleus (b) and TA muscles (c) that were dissected out from WT and V mice at 6 and 8 weeks (n = 6) (**p < 0.01, ***p < 0.005). d Left panel shows dissected soleus muscles from wild-type (WT) (top row) and VDR−/− mice (V) (bottom row) at 6 and 8 weeks of age. Right panel shows a representative western blot analysis of the lysates from the same subset of muscles from WT and V and probed for p-Stat3 antibody (top panel) and total Stat3 (middle panel). Graphs to the right show quantitative analyses of replicative blots of the ratio of relative intensities of p-Stat3 to total Stat3 at 6 and 8 weeks, respectively, between WT and V muscles (n = 6) (**p < 0.01). e Left panel shows dissected tibialis anterior (TA) muscles from WT (top row) and V mice (bottom row) at 6 weeks and 2 months of age. Right panel shows a representative western blot analysis of lysates from the same subset of muscles from WT and V and probed with antibodies as in d. Graphs to the right show similar analyses as d of ratios of p-Stat3 to total Stat3 at 6 and 8 weeks, respectively, between WT and V muscles (n = 6) (***p < 0.005). Total Stat3 levels were first normalized to β-actin that serves as a loading control prior to normalization of p-Stat3 to total Stat3
Fig. 2
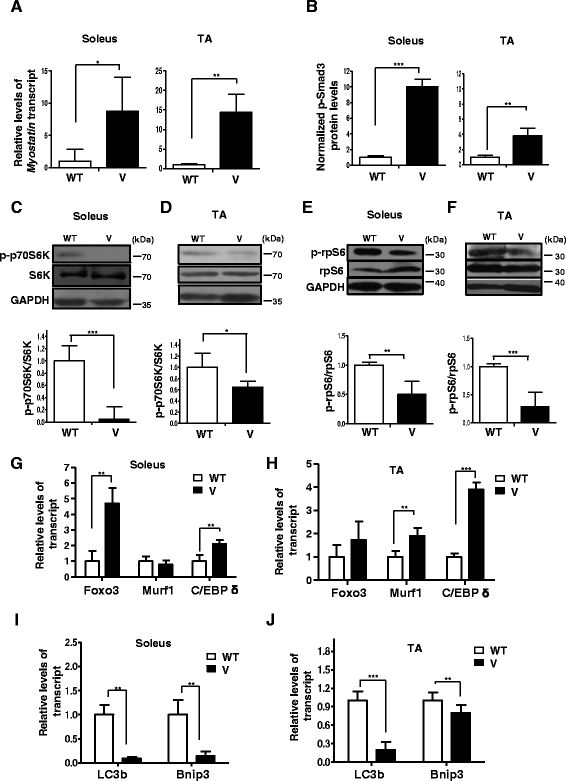
VDR−/− muscles are characterized by an increase in atrophic gene expression, a decline in mTOR pathway components, and a block in autophagic gene expression. a The soleus and TA muscles from 6-week-old WT and V mice were assessed for levels of Myostatin transcript by qRT-PCR. Myostatin transcript levels in the soleus and TA muscles of V mice are normalized to those in WT (n = 6) (*p < 0.05). Myostatin is upregulated in the soleus and TA muscles of V compared to WT. b Graph showing the quantitation of western blot analysis of lysates from dissected soleus muscles (Fig. 1b) and TA muscles (Fig. 1c) from WT and V mice at 6 weeks of age probed for p-Smad3 antibody (n = 5) (**p < 0.01, ***p < 0.005). GAPDH serves as a loading control. c–f Representative western blot analysis of lysates from dissected soleus muscles (Fig. 1b) and TA muscles (Fig. 1c) from WT and V mice at 6 weeks of age probed for p-p70S6K antibody and S6K antibody (c, d) and p-rpS6 antibody and total rpS6 (e, f). Graphs below each blot show ratios of p-p70S6K to total S6K and p-rpS6 to total rpS6, respectively (n = 5) (**p < 0.01, ***p < 0.005). GAPDH serves as a loading control. g, h Soleus and TA muscles from 6-week-old WT and TA muscles were assessed for known markers of atrophy, Foxo3, Murf1, and C/EBP δ transcripts by qRT-PCR. While C/EBP δ was upregulated in both muscles sets, Foxo3 and Murf1 showed differential fiber-type-specific expression (n = 5) (**p < 0.01, ***p < 0.005). i–j Soleus and TA muscles from 6-week-old WT and TA muscles were assessed for known markers of autophagy, LC3b and Bnip3 transcripts, by qRT-PCR. Both transcripts were downregulated in V muscles compared to WT muscles. All transcript levels in V are normalized to those in WT (n = 5) (**p < 0.01, ***p < 0.005)
Fig. 3
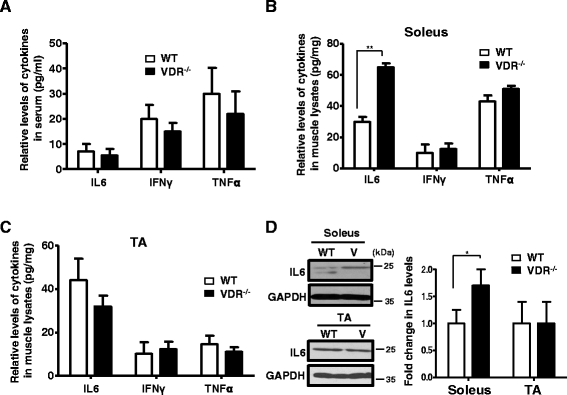
VDR−/− soleus but not TA muscles display increased IL-6 protein levels. a Serum IL-6, IFNγ, and TNFα levels were measured by ELISA in triplicate wells from 8-week-old WT and V mice. Graph shows that no significant differences in cytokine levels were observed in the serum from the two sets (n = 5). b, c Cytokine levels in a were measured in the soleus (b) and TA (c) muscle lysates isolated from 8-week-old WT and V mice. Only IL-6 levels were observed to be significantly increased in the soleus muscles of V mice (n = 5) (**p < 0.01). Cytokine levels were normalized to tissue weight (mgs). d Top and bottom panels show a representative western blot analysis of lysates from the soleus and TA muscles, respectively, of WT and V mice probed with IL-6 antibody. Graph to the right shows the quantitative differences between the two groups. IL-6 protein levels are increased in the soleus but not in the TA muscles of V compared to WT mice. GAPDH serves as the loading control (n = 6)
Fig. 4
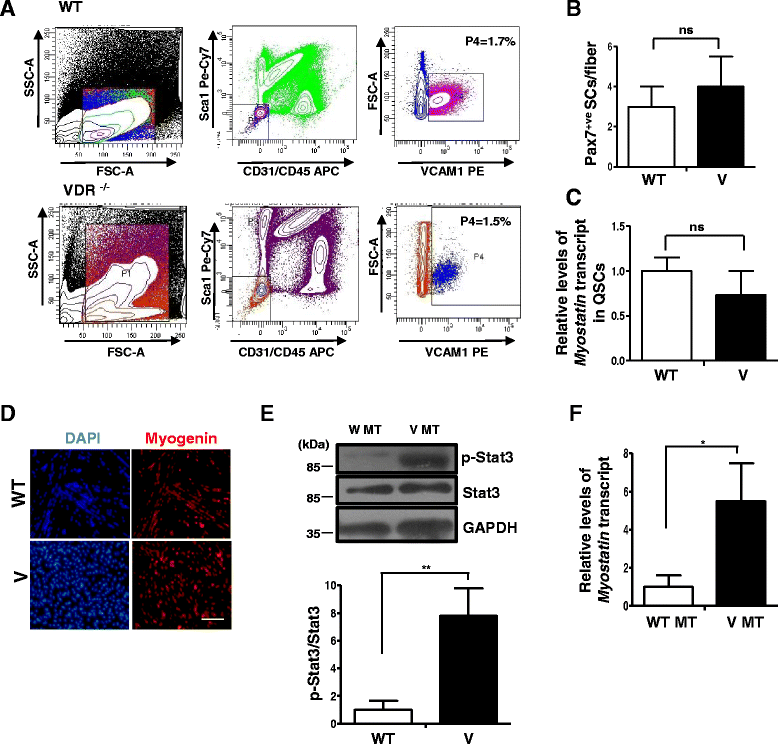
VDR−/− SCs do not differ in number or Myostatin expression from wild-type SCs but display hallmarks of atrophy upon differentiation in culture. a SC numbers were quantified by FACS analysis of mononuclear cells from hind limb muscles of WT and V mice. SCs are shown in purple (WT) and blue (V) in these representative FACS plots. In three replicates, the percentage of SCs in total mononuclear cells in V muscles was not significantly different (1.5%) compared to that in WT muscles (1.7%) (n = 3 mice per genotype were pooled per experiment, N = 3). b Single myofibers were obtained from WT and V muscles and stained for Pax7 to assess SC numbers per fiber. There were no statistically significant differences in the number of SCs per fiber between the two strains. Fibers were obtained from three mice per genotype. c FACS-purified quiescent SCs from WT and V mice muscles were assessed for levels of Myostatin expression by qRT-PCR. Myostatin transcript levels in V are normalized to WT. Quiescent SCs from each genotype represent triplicate experiments of pooled RNA from three mice for each experiment (n = 3 mice per genotype were pooled per experiment, N = 3). d FACS-sorted SCs from WT and V hind limb muscles were induced to differentiate for 2 days and stained for Myogenin. e Western blot analysis of lysates from differentiated SC cultures from WT (WT MT) and V (V MT) mice were probed with p-Stat3 and total Stat3 antibodies. Graph below shows a significant upregulation in p-Stat3 levels in V MT cultures compared to those in WT MT (n = 3 mice per genotype were pooled per experiment, N = 3). (**p < 0.01). f Myotubes from WT and V muscles were assessed for levels Myostatin expression by qRT-PCR. Myostatin is upregulated in V myotubes compared to WT myotubes (*p < 0.05)
Fig. 5
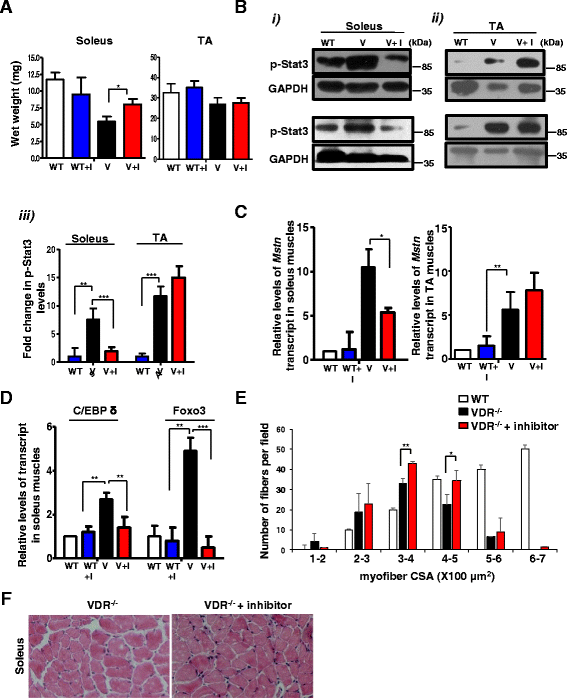
Inhibition of Stat3 activity ameliorates muscle mass loss in VDR−/− soleus muscles. a Average weights of the soleus (left graph) and TA muscles (right graph) from WT and paired V mice that were injected with either the diluent (WT and V, respectively) or C188-9 (WT + I and V + I, respectively) after 2 weeks of treatment (n = 5 mice/group, N = 3 independent experiments). Soleus muscles from V + I mice show a significant increase in weight compared to those from V mice injected with diluent (*p < 0.05). b (i) and (ii) Representative western blot analysis of lysates in duplicate from independent experiments from soleus (i), top and bottom left panels, and TA muscles (ii), top and bottom right panels, from WT, V, and V + I mice. Blots were probed with p-Stat3 antibody. Fold differences in p-Stat3 levels were calculated by normalizing intensities with respective GAPDH values (n = 5 mice/group, N = 3 independent experiments). (iii) Graph shows quantitative analyses of replicative blots of levels of p-Stat3 protein in the TA and soleus muscles after inhibitor treatment (**p < 0.01, ***p < 0.005). A detectable decrease in p-Stat3 levels were observed in soleuses of V + I mice, but not in the TA muscles. c The soleus muscles (left graph) and TA muscles (right graph) from paired V and V + I mice and WT + I mice and were assessed for Myostatin transcript levels by qRT-PCR. There was a significant decline in Myostatin expression in V + I soleus muscles compared to control V muscles, but not in the TA subset of inhibitor-treated V mice (*p < 0.05). d The soleus muscles from same group as c were assessed for C/EBP δ and Foxo3 expression by qRT-PCR. There was a reduction in C/EBP δ and Foxo3 expression in V + I soleus muscles compared to control V muscles (**p < 0.01, ***p < 0.005). e–f Cryosections of the soleus muscles isolated from V (top panel) and V + I (bottom panel) mice were stained for hematoxylin and eosin. Individual fibers were evaluated for cross-sectional area (CSA) in both groups. A minimum of 800 fibers were counted per section from soleuses in three independent experiments for each genotype. V + I soleus fibers show reduced number of smaller fibers of sizes 100–200 μm and a greater homogeneity in fibers with sizes 300–400 μm (S.D = 1.414 for V + I compared to 5.2 for V) (*p < 0.05). There was also a significant increase in fibers with sizes from 400 to 500 μm. Scale bars represent 100 μm
Fig. 6
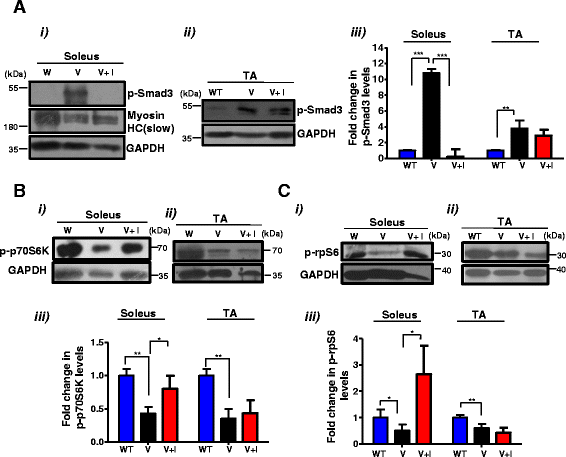
Inhibition of Stat3 activity ameliorates the changes in levels of mTOR components observed in VDR−/− soleus muscles. a–c (i) and (ii) Representative western blot analysis of lysates from b were probed with p-Smad3 (a), p-p70S6K (b), and p-rpS6 (c) antibodies. The p-Smad3 blot was also probed with MHC (slow) as a representative example to mark the identity of the lanes. a–c, (iii) Graphs show fold differences in p-Smad3, p-p70S6K, and p-rpS6, respectively, that were calculated by normalizing intensities with respective GAPDH values (n = 5 mice/group, N = 3 independent experiments) (*p < 0.05, **p < 0.01). While p-Smad3 levels were reduced in the soleus muscles of inhibitor-treated V mice, p-p70S6K and p-rpS6 levels were increased
Fig. 7
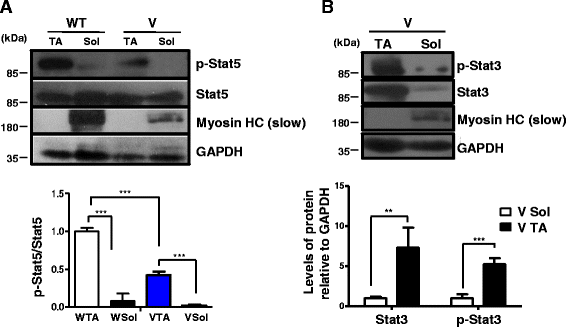
Different levels of Stat3 expression and activity in VDR−/− muscle subsets amenable to pharmacological inhibition could be linked to preferential fiber type expression of p-Stat5 and its dependence on vitamin D signaling. a Representative western blot analysis of lysates from the soleus and TA muscles isolated from 6-week-old WT and V mice were probed with p-Stat5 and total Stat5 antibodies. Graph below show the fold differences in levels of p-Stat5 to total Stat5 protein that was calculated after normalizing band intensities with respective GAPDH values (n = 5 mice/group, ***p < 0.005). Levels of p-Stat5 are significantly higher in the TA muscles than those in the soleus muscles and are downregulated in the absence of VDR signaling. b Western blot analysis of lysates from the soleus and TA muscles of V mice were probed with p-Stat3 and total Stat3 antibodies. Graph below shows the fold differences in levels of p-Stat3 and total Stat3 after normalizing band intensities with respective GAPDH values (n = 5, ***p < 0.005, **p < 0.01). Blots were probed with MHC (slow) to mark the identity of the lanes. The TA muscles express significantly higher levels of p-Stat3 and total Stat3 compared to the soleus muscles from V mice
Fig. 8
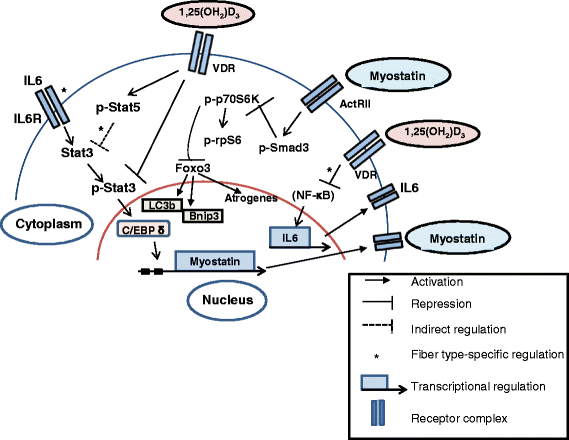
Working model representing the proposed signaling pathways induced by vitamin D signaling in regulating skeletal muscle mass. Active vitamin D bound to vitamin D receptors maintains proteostasis by inhibiting p-Stat3 signaling and downstream C/EBP δ activity, thereby inhibiting the production of Myostatin. In fast muscles, active vitamin D additionally promotes p-Stat5 expression that could function to inhibit Stat3 expression and function. In the absence of vitamin D signaling, increased levels of Myostatin induces p-Smad3 signaling, which in turn inhibits components of the mTOR pathway, p-p70S6 kinase, and p-rpS6. Translocation of active FOXO3 into the nucleus due to reduced mTOR pathway signaling can upregulate the expression of various atrogenes. Paradoxically, autophagy regulators and targets of FOXO3 signaling, LC3b and Bnip3, display decreased expression, suggesting a block in the autophagic process and possibly an inhibition of recruitment of FOXO3 to the promoters of these genes. Additionally, active vitamin D reduces IL-6 production in slow muscles, possibly through the inhibition of the NF-kb complex that further attenuates p-Stat3 signaling
Similar articles
- Chronic paraplegia-induced muscle atrophy downregulates the mTOR/S6K1 signaling pathway.
Dreyer HC, Glynn EL, Lujan HL, Fry CS, DiCarlo SE, Rasmussen BB. Dreyer HC, et al. J Appl Physiol (1985). 2008 Jan;104(1):27-33. doi: 10.1152/japplphysiol.00736.2007. Epub 2007 Sep 20. J Appl Physiol (1985). 2008. PMID: 17885021 Free PMC article. - Rheb, an activator of target of rapamycin, in the blackback land crab, Gecarcinus lateralis: cloning and effects of molting and unweighting on expression in skeletal muscle.
MacLea KS, Abuhagr AM, Pitts NL, Covi JA, Bader BD, Chang ES, Mykles DL. MacLea KS, et al. J Exp Biol. 2012 Feb 15;215(Pt 4):590-604. doi: 10.1242/jeb.062869. J Exp Biol. 2012. PMID: 22279066 - Altered REDD1, myostatin, and Akt/mTOR/FoxO/MAPK signaling in streptozotocin-induced diabetic muscle atrophy.
Hulmi JJ, Silvennoinen M, Lehti M, Kivelä R, Kainulainen H. Hulmi JJ, et al. Am J Physiol Endocrinol Metab. 2012 Feb 1;302(3):E307-15. doi: 10.1152/ajpendo.00398.2011. Epub 2011 Nov 8. Am J Physiol Endocrinol Metab. 2012. PMID: 22068602 - PI3 kinase regulation of skeletal muscle hypertrophy and atrophy.
Glass DJ. Glass DJ. Curr Top Microbiol Immunol. 2010;346:267-78. doi: 10.1007/82_2010_78. Curr Top Microbiol Immunol. 2010. PMID: 20593312 Review. - Signaling pathways weigh in on decisions to make or break skeletal muscle.
Guttridge DC. Guttridge DC. Curr Opin Clin Nutr Metab Care. 2004 Jul;7(4):443-50. doi: 10.1097/01.mco.0000134364.61406.26. Curr Opin Clin Nutr Metab Care. 2004. PMID: 15192448 Review.
Cited by
- Distinct human skeletal muscle-derived CD90 progenitor subsets for myo-fibro-adipogenic disease modeling and treatment in multiplexed conditions.
Li A, Anbuchelvan M, Fathi A, Abu-Zahra M, Evseenko D, Petrigliano FA, Dar A. Li A, et al. Front Cell Dev Biol. 2023 Apr 18;11:1173794. doi: 10.3389/fcell.2023.1173794. eCollection 2023. Front Cell Dev Biol. 2023. PMID: 37143896 Free PMC article. - 'Psoriasis 1' reduces T‑lymphocyte‑mediated inflammation in patients with psoriasis by inhibiting vitamin D receptor‑mediated STAT4 inactivation.
Gao Y, Sun W, Cha X, Wang H. Gao Y, et al. Int J Mol Med. 2020 Oct;46(4):1538-1550. doi: 10.3892/ijmm.2020.4695. Epub 2020 Aug 6. Int J Mol Med. 2020. PMID: 32945358 Free PMC article. - Advances in sarcopenia: mechanisms, therapeutic targets, and intervention strategies.
Zheng Y, Feng J, Yu Y, Ling M, Wang X. Zheng Y, et al. Arch Pharm Res. 2024 Apr;47(4):301-324. doi: 10.1007/s12272-024-01493-2. Epub 2024 Apr 9. Arch Pharm Res. 2024. PMID: 38592582 Review. - Phosphodiesterase-4 Inhibition Reduces Cutaneous Inflammation and IL-1β Expression in a Psoriasiform Mouse Model but Does Not Inhibit Inflammasome Activation.
Meier-Schiesser B, Mellett M, Ramirez-Fort MK, Maul JT, Klug A, Winkelbeiner N, Fenini G, Schafer P, Contassot E, French LE. Meier-Schiesser B, et al. Int J Mol Sci. 2021 Nov 28;22(23):12878. doi: 10.3390/ijms222312878. Int J Mol Sci. 2021. PMID: 34884681 Free PMC article. - STAT3 in Skeletal Muscle Function and Disorders.
Guadagnin E, Mázala D, Chen YW. Guadagnin E, et al. Int J Mol Sci. 2018 Aug 2;19(8):2265. doi: 10.3390/ijms19082265. Int J Mol Sci. 2018. PMID: 30072615 Free PMC article. Review.
References
- Holick MF, Chen TC. Vitamin D deficiency: a worldwide problem with health. Am J Clin Nutr. 2008;87:1080–1086. - PubMed
- Kato S, Yoshizazawa T, Kitanaka S, Murayama A, Takeyama K. Molecular genetics of vitamin D-dependent hereditary rickets. Horm Res. 2002;57:73–78. - PubMed
MeSH terms
Substances
LinkOut - more resources
Full Text Sources
Other Literature Sources
Miscellaneous
