Roles of programmed death protein 1/programmed death-ligand 1 in secondary brain injury after intracerebral hemorrhage in rats: selective modulation of microglia polarization to anti-inflammatory phenotype - PubMed (original) (raw)
Roles of programmed death protein 1/programmed death-ligand 1 in secondary brain injury after intracerebral hemorrhage in rats: selective modulation of microglia polarization to anti-inflammatory phenotype
Jie Wu et al. J Neuroinflammation. 2017.
Abstract
Background: Microglia and its polarization play critical roles in intracerebral hemorrhage-induced secondary brain injury. Programmed death protein 1/programmed death-ligand 1 has been reported to regulate neuroimmune cell functions. Signal transducers and activators of transcription 1 participate in microglia polarization, and programmed death protein 1/programmed death-ligand 1 could regulate the activation of signal transducers and activators of transcription 1. We herein show the critical role of programmed death protein 1/programmed death-ligand 1 in the polarization of microglia during intracerebral hemorrhage-induced secondary brain injury in rat models.
Methods: An autologous blood intracerebral hemorrhage model was established in Sprague Dawley rats (weighing 250-300 g), and primary cultured microglia was exposed to oxyhemoglobin to mimic intracerebral hemorrhage in vitro. Specific siRNAs and pDNA for programmed death protein 1 and programmed death-ligand 1 were exploited both in vivo and in vitro.
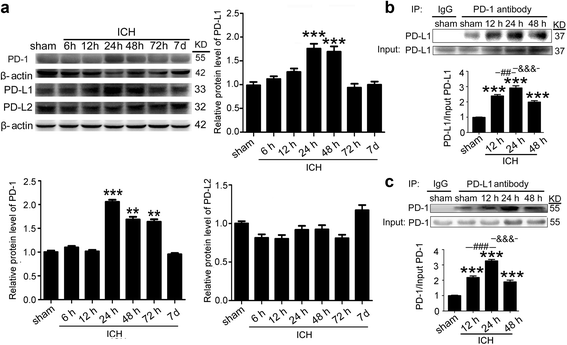
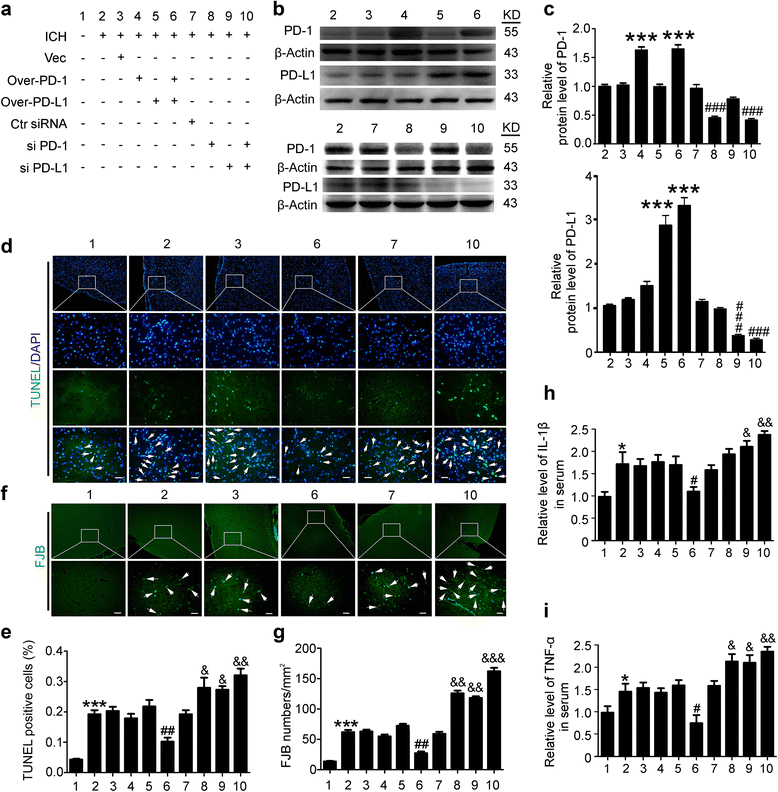
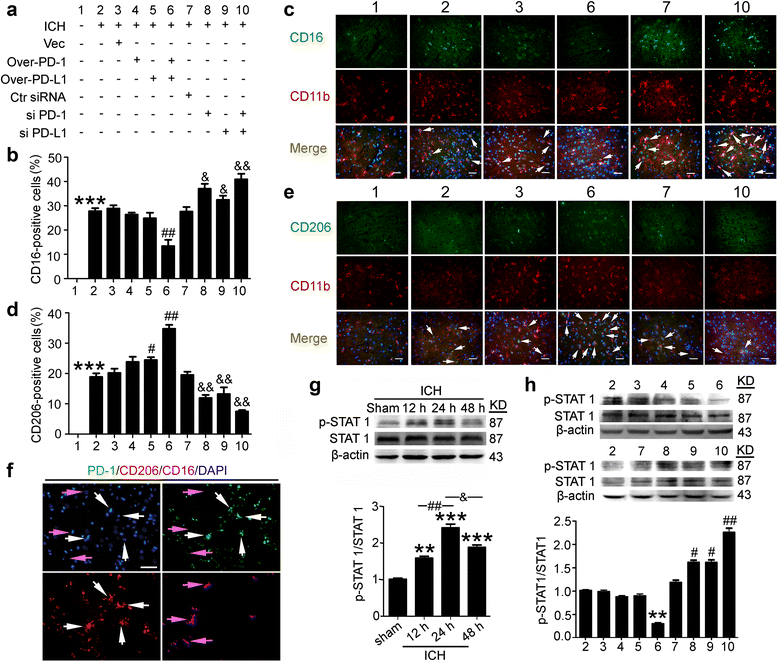
Results: In the brain tissue around hematoma, the protein levels of programmed death protein 1 and programmed death-ligand 1 and the interaction between them, as well as the phosphorylation of signal transducers and activators of transcription 1, were higher than that of the sham group and collectively peaked at 24 h after intracerebral hemorrhage. Overexpression of programmed death protein 1 and programmed death-ligand 1 ameliorated intracerebral hemorrhage-induced secondary brain injury, including brain cell death, neuronal degeneration, and inflammation, while their knockdown induced an opposite effect. In addition, overexpression of programmed death protein 1 and programmed death-ligand 1 selectively promoted microglia polarization to anti-inflammation phenotype after intracerebral hemorrhage and inhibited the phosphorylation of signal transducers and activators of transcription 1, suggesting that intracerebral hemorrhage-induced increases in programmed death protein 1 and programmed death-ligand 1 maybe a self-help.
Conclusions: Enhancing the expressions of programmed death protein 1 and programmed death-ligand 1 may induce a selective modulation of microglia polarization to anti-inflammation phenotype for intracerebral hemorrhage treatment.
Keywords: Intracerebral hemorrhage; Microglia polarization; Programmed death protein 1; Programmed death-ligand 1; Secondary brain injury.
Figures
Fig. 1
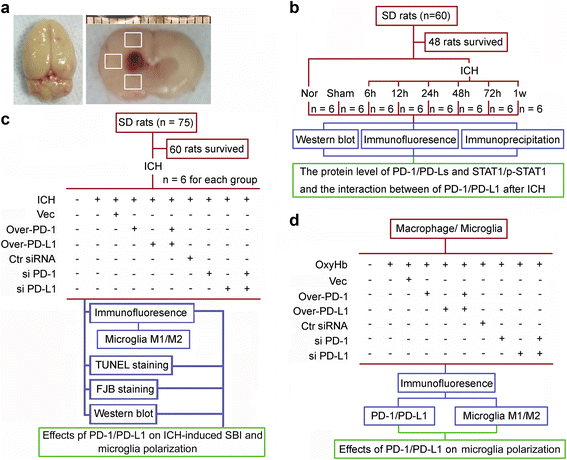
Flow chart showing rat brain tissue after ICH modeling and experimental design. a Left panel: representative image of completed isolation of rat brain tissue after cardiac perfusion. Right panel: brain section from a rat after ICH modeling. The boxed areas represent the brain regions used for western blot analysis and immunofluorescence staining. b, c Experimental design for in vivo experiment. d Experimental design for in vitro experiment
Fig. 2
ICH increased the protein levels of PD-1/PD-Ls and the interaction between PD-1 and PD-L1. a Time course of the protein levels of PD-1, PD-L1, and PD-L2 in the brain tissue around hematoma after ICH. Representative western blot bands of PD-1, PD-L1, and PD-L2 and quantitative analysis of the relative protein level were shown. The mean value of sham group was normalized to 1.0. Data are expressed as mean ± SEM, n = 6. Double asterisks indicate p < 0.01, triple asterisks indicate p < 0.001 vs. sham group. b, c Immunoprecipitation analysis of the interaction between PD-1 and PD-L1 at indicated times after ICH. All values are means ± SEM, n = 6. triple asterisks indicate p < 0.001 vs. sham group, triple pound signs indicate p < 0.001
Fig. 3
Effects of PD-1/PD-L1 overexpression and knockdown on brain cell death and neuronal degeneration after ICH. a ICH rats accepted intracerebroventricular injection of pDNA or siRNAs as indicated. b Western blot analysis of the efficiency of PD-1 and PD-L1 overexpression or knockdown in brain of ICH rats. Quantification of relative protein levels of PD-1 and PD-L1 was shown in c. c Data are expressed as mean ± SEM, n = 6. Triple asterisks indicate p < 0.001 vs. ICH + vector group; triple pound signs indicate p < 0.001 vs. ICH + control siRNA group. d Terminal deoxynucleotidyl transferase dUTP nick end labeling (TUNEL) staining. Sections were labeled by TUNEL (green) to detect apoptotic brain cells and counterstained with DAPI (blue) to detect nuclei. Arrows point to TUNEL-positive cells. Scale bar = 64 μm. e Percentage of TUNEL-positive cells. Data are expressed as mean ± SEM, n = 6. Triple asterisks indicate p < 0.001 vs. sham group; double pound signs indicate p < 0.01 vs. ICH + vector group; ampersand indicates p < 0.05, double ampersands indicate p < 0.01 vs. ICH + control siRNA group. f Fluoro-jade B (FJB) staining. Arrows point to FJB-positive cells. Scale bar = 64 μm. The number of FJB-positive brain cells was calculated. g Data are expressed as mean ± SEM, n = 6. Triple asterisks indicate p < 0.001 vs. sham group; double pound signs indicate p < 0.01 vs. ICH + vector group; double ampersands indicate p < 0.01, triple ampersands indicate p < 0.001 vs. ICH + control siRNA group. h, i ELISA assay of the contents of IL-1β and TNF-α in the serum. The mean values of the sham group were normalized to 1.0. Data are expressed as mean ± SEM, n = 6. Single asterisk indicates p < 0.05 vs. sham group; Single pound sign indicates p < 0.05 vs. ICH + vector group; Single ampersand indicates p < 0.05, double ampersands indicate p < 0.01 vs. ICH + control siRNA group
Fig. 4
Effects of PD-1/PD-L1 overexpression and knockdown on ICH-induced microglia polarization and STAT1 phosphorylation. a ICH rats accepted intracerebroventricular injection of pDNA or siRNAs as indicated. Sections were stained for CD16/CD11b (pro-inflammatory microglia marker) or CD206/CD11b (anti-inflammatory microglia marker). Percentage of CD16-positive cells or CD206-positive cells was shown in b and d and representative images were shown in c and e. Scale bar = 64 μm. In b and d, data are expressed as mean ± SEM, n = 6. Triple asterisks indicate p < 0.001 vs. sham group; single pound sign indicates p < 0.05, double pound signs indicate p < 0.01 vs. ICH + vector group; single ampersand indicates p < 0.05, double ampersands indicate p < 0.01 vs. ICH + control siRNA group. f Sections of ICH + PD-1 overexpression + PD-L1 overexpression group were stained for PD1/CD16/CD206. White arrows point to CD206-positive cells with high fluorescence intensity of PD-1, and purple arrows point to CD16-positive cells with low fluorescence intensity of PD-1. Scale bar = 64 μm. g Western blot analysis and quantification of the phosphorylation level of STAT1. The mean values of the protein levels in the sham group were normalized to 1.0. Data are expressed as mean ± SEM, n = 6. Double asterisks indicate p < 0.01, triple asterisks indicate p < 0.001 vs. sham group; double pound signs indicate p < 0.01, single ampersand indicates p < 0.05. h Western blot analysis and quantification of the phosphorylation level of STAT1. The mean values of the protein levels in the ICH group were normalized to 1.0. Data are expressed as mean ± SEM, n = 6. Double asterisks indicate p < 0.01 vs. ICH + vector group; single pound sign indicates p < 0.05, double pound signs indicate p < 0.01 vs. ICH + control siRNA group
Fig. 5
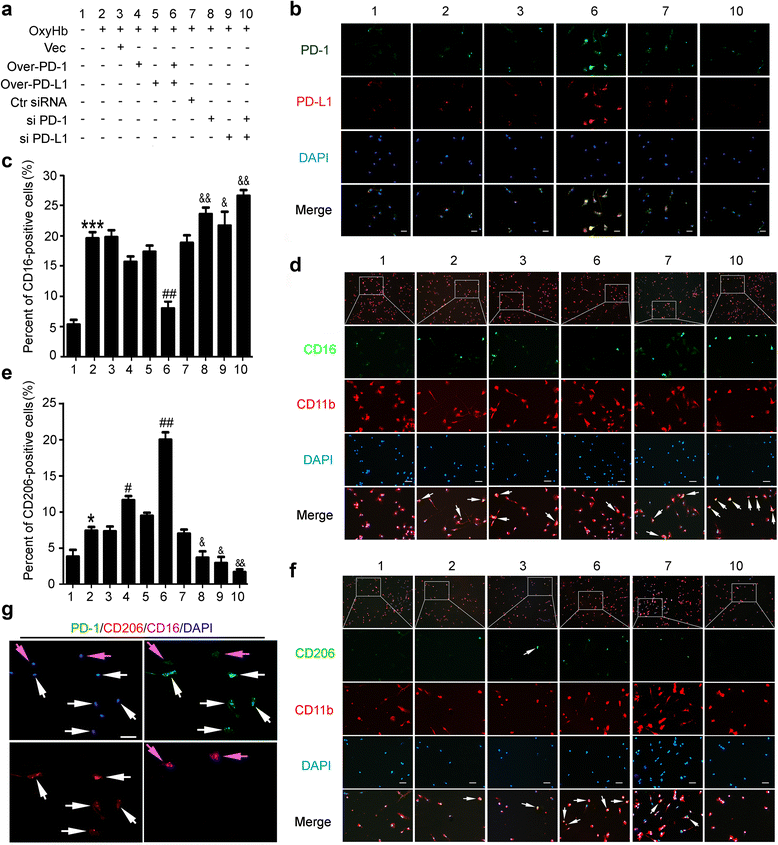
Effects of PD-1/PD-L1 overexpression and knockdown on the polarization of OxyHb-treated microglia. a Cultured microglia accepted transfection of pDNA or siRNAs as indicated. b The efficiency of pDNA and siRNA in cultured microglia was verified by immunofluorescence staining. Scale bar = 64 μm. Cultured microglia was stained for CD16/CD11b (pro-inflammatory microglia marker) or CD206/CD11b (anti-inflammatory microglia marker). Percentage of CD16-positive cells or CD206-positive cells was shown in c and e and representative images were shown in d and f. Scale bar = 64 μm. In c and e, data are expressed as mean ± SEM, n = 6. Single asterisk indicates p < 0.05, triple asterisks indicate p < 0.001 vs. sham group; single pound sign indicates p < 0.05, double pound signs indicate p < 0.01 vs. ICH + vector group; single ampersand indicates p < 0.05, double ampersands indicate p < 0.01 vs. ICH + control siRNA group. g Microglia of ICH + PD-1 overexpression + PD-L1 overexpression group was stained for PD1/CD16/CD206. White arrows point to CD206-positive cells with high fluorescence intensity of PD-1, and purple arrows point to CD16-positive cells with low fluorescence intensity of PD-1. Scale bar = 64 μm
Fig. 6
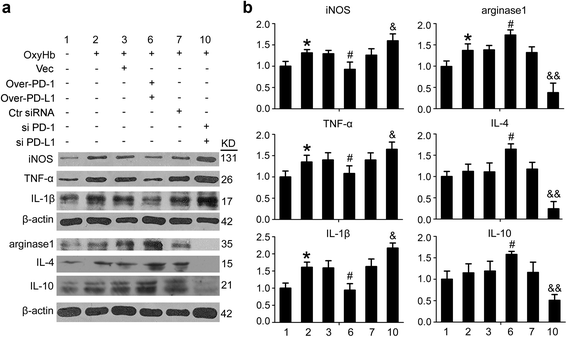
Changes in the expression of pro-inflammatory- and anti-inflammatory-like polarization markers in microglia under indicated treatment. a The immunoblots show TNF-α, IL-1β, iNOS, arginase1, IL-4, and IL-10 produced by microglia under indicated treatment. b The quantitative analyses of TNF-α, IL-1β, iNOS, arginase1, IL-4, and IL-10 in the immunoblots in a. Date = mean ± SEM, n = 6. Single asterisk indicates p < 0.05 vs. control group; single pound sign indicates p < 0.05 vs. ICH + vector group; single ampersand indicates p < 0.05, double ampersands indicate p < 0.01 vs. ICH + control siRNA group
Fig. 7
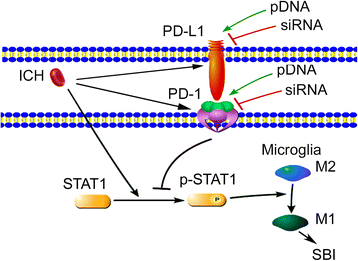
Possible mechanism of PD-1/PD-L1 in secondary brain injury after ICH modeling. After ICH, PD-1/PD-L1 protein expression in the brain tissue significantly increased. In addition, the proportion of STAT1 phosphorylation increased. Moreover, upregulation of PD-1/PD-L1 expression by overexpression suppressed the phosphorylation of p-STAT1, pro-inflammatory polarization of microglia, and subsequent SBI under ICH condition, while PD-1/PD-L1 knockdown induced an opposite effect
Similar articles
- Hyperbaric oxygen preconditioning attenuates brain injury after intracerebral hemorrhage by regulating microglia polarization in rats.
Wang M, Cheng L, Chen ZL, Mungur R, Xu SH, Wu J, Liu XL, Wan S. Wang M, et al. CNS Neurosci Ther. 2019 Oct;25(10):1126-1133. doi: 10.1111/cns.13208. Epub 2019 Aug 14. CNS Neurosci Ther. 2019. PMID: 31411803 Free PMC article. - Electro-nape-acupuncture regulates the differentiation of microglia through PD-1/PD-L1 reducing secondary brain injury in acute phase intracerebral hemorrhage rats.
Liu Y, Zheng S, Zhang X, Guo W, Du R, Yuan H, Zhang L, Cui H. Liu Y, et al. Brain Behav. 2023 Nov;13(11):e3229. doi: 10.1002/brb3.3229. Epub 2023 Aug 23. Brain Behav. 2023. PMID: 37614117 Free PMC article. - Interleukin-33 reduces neuronal damage and white matter injury via selective microglia M2 polarization after intracerebral hemorrhage in rats.
Chen Z, Xu N, Dai X, Zhao C, Wu X, Shankar S, Huang H, Wang Z. Chen Z, et al. Brain Res Bull. 2019 Aug;150:127-135. doi: 10.1016/j.brainresbull.2019.05.016. Epub 2019 May 24. Brain Res Bull. 2019. PMID: 31129170 - Microglial Polarization and Inflammatory Mediators After Intracerebral Hemorrhage.
Zhang Z, Zhang Z, Lu H, Yang Q, Wu H, Wang J. Zhang Z, et al. Mol Neurobiol. 2017 Apr;54(3):1874-1886. doi: 10.1007/s12035-016-9785-6. Epub 2016 Feb 19. Mol Neurobiol. 2017. PMID: 26894396 Free PMC article. Review. - Mechanism and Regulation of Microglia Polarization in Intracerebral Hemorrhage.
Guo Y, Dai W, Zheng Y, Qiao W, Chen W, Peng L, Zhou H, Zhao T, Liu H, Zheng F, Sun P. Guo Y, et al. Molecules. 2022 Oct 20;27(20):7080. doi: 10.3390/molecules27207080. Molecules. 2022. PMID: 36296682 Free PMC article. Review.
Cited by
- Study of the pathology and the underlying molecular mechanism of tissue injury around hematoma following intracerebral hemorrhage.
Wang J, Chen Y, Liang J, Cao M, Shen J, Ke K. Wang J, et al. Mol Med Rep. 2021 Oct;24(4):702. doi: 10.3892/mmr.2021.12341. Epub 2021 Aug 9. Mol Med Rep. 2021. PMID: 34368865 Free PMC article. - Neurovascular Units and Neural-Glia Networks in Intracerebral Hemorrhage: from Mechanisms to Translation.
Sun Q, Xu X, Wang T, Xu Z, Lu X, Li X, Chen G. Sun Q, et al. Transl Stroke Res. 2021 Jun;12(3):447-460. doi: 10.1007/s12975-021-00897-2. Epub 2021 Feb 24. Transl Stroke Res. 2021. PMID: 33629275 Review. - White matter repair and treatment strategy after intracerebral hemorrhage.
Jiang YB, Wei KY, Zhang XY, Feng H, Hu R. Jiang YB, et al. CNS Neurosci Ther. 2019 Oct;25(10):1113-1125. doi: 10.1111/cns.13226. Epub 2019 Oct 2. CNS Neurosci Ther. 2019. PMID: 31578825 Free PMC article. Review. - Negative regulation of glial Tim-3 inhibits the secretion of inflammatory factors and modulates microglia to antiinflammatory phenotype after experimental intracerebral hemorrhage in rats.
Chen ZQ, Yu H, Li HY, Shen HT, Li X, Zhang JY, Zhang ZW, Wang Z, Chen G. Chen ZQ, et al. CNS Neurosci Ther. 2019 Jun;25(6):674-684. doi: 10.1111/cns.13100. Epub 2019 Jan 24. CNS Neurosci Ther. 2019. PMID: 30677253 Free PMC article.
References
- Jiang, B., et al., Role of glibenclamide in brain injury after intracerebral hemorrhage. Transl Stroke Res, 2016 - PubMed
Publication types
MeSH terms
Substances
LinkOut - more resources
Full Text Sources
Other Literature Sources
Research Materials
